How to use percentiles in grain.

The Snapsho
- Deciles (or percentiles) are useful for getting a quick view of the market.
- The current extremes in pricing levels are making them less useful as a decision-making tool.
- The difference between the 90thand 100th decile is huge.
- A 100thdecile price would traditionally be considered a sell signal.
- When the market is rallying, the 100thdecile in the space of a week can change dramatically.
- Deciles should never be used in isolation, they should be used with other tools to form a view of the market.
- Never rely on deciles for decision making, especially in the current market.
The Detail
Percentile (Decile) tables are a helpful tool for getting a swift view of the market but are they losing their value as a tool for decision making due to the extreme prices of recent years?
Let’s start with an explanation of a decile table and how to use them.
The decile table below has a selection of wheat prices for the period 2016 to the present. The minimum and maximum are the highest and lowest prices experienced during the period.
In normal times, this is quite a helpful tool for making decisions. If it is high 90%+ then that is a clear sign to sell; when it is low, it is a clear signal to buy. This is true to an extent.
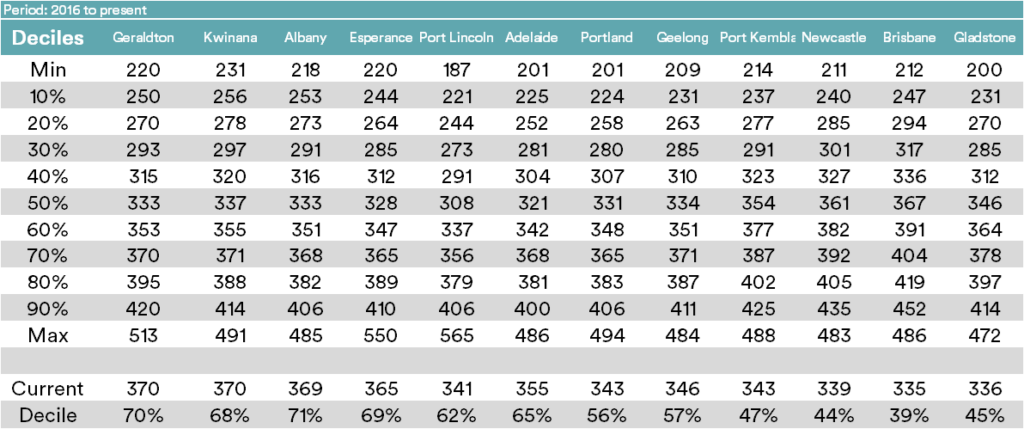
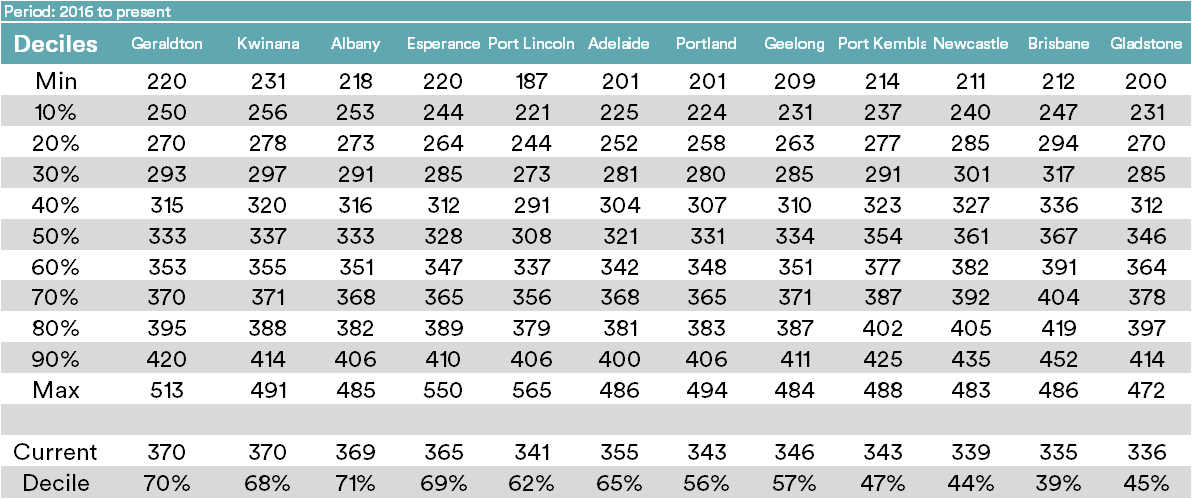
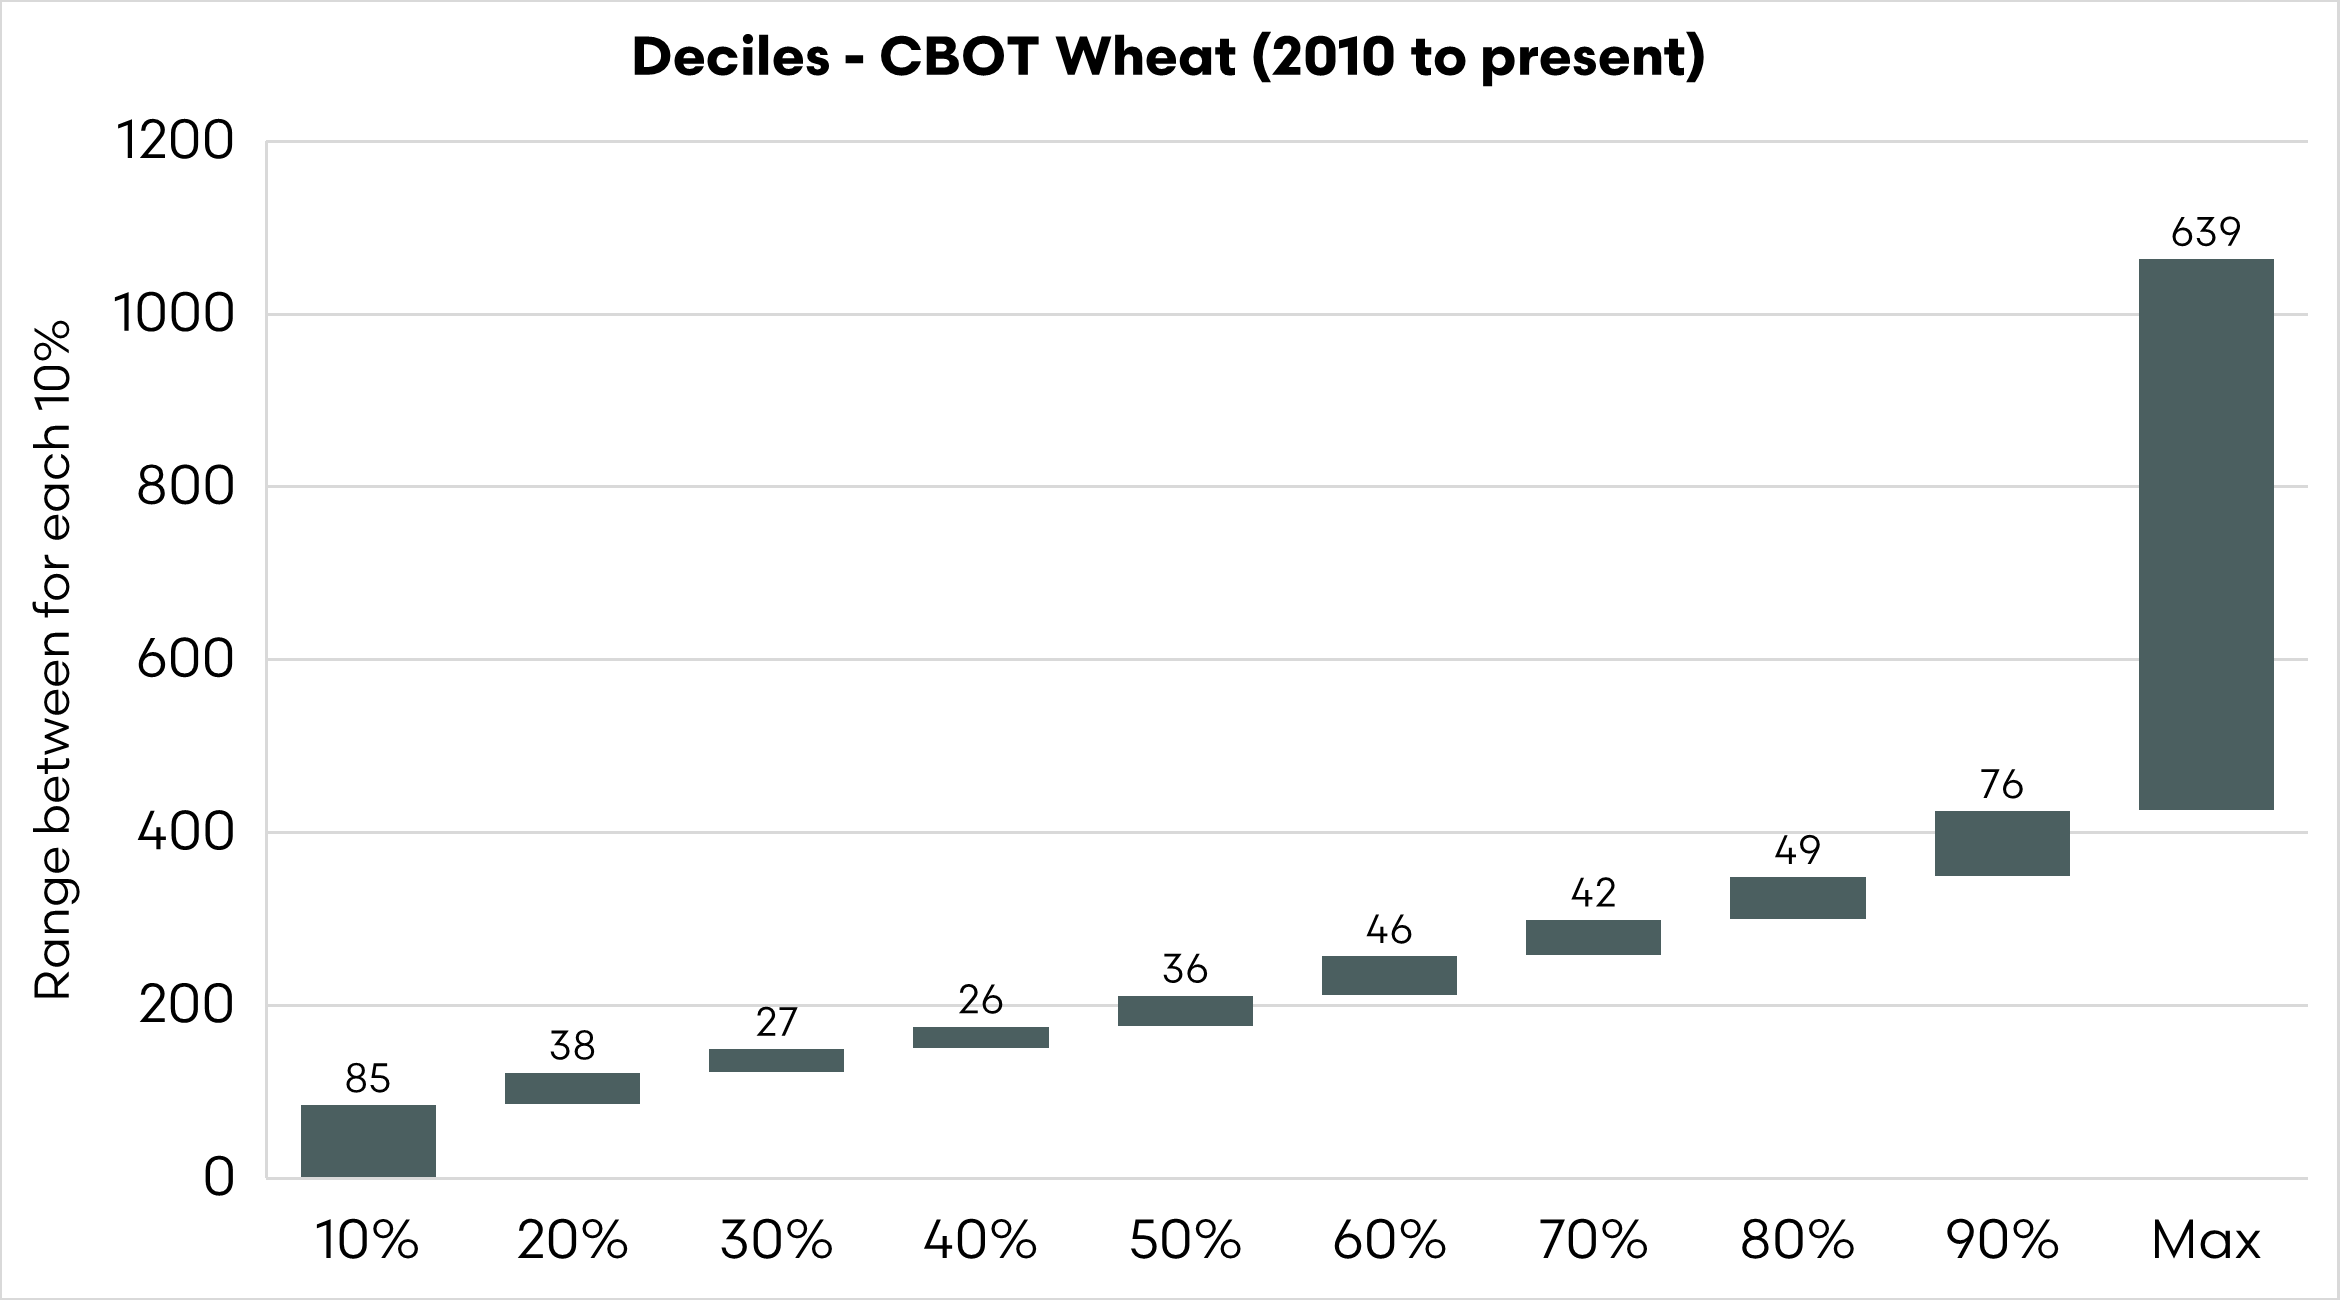
There is a huge range if we look at the difference between the 90th decile and max in wheat. The 90th decile is at A$414, whilst the 100th decile is at A$491. It is the extremes at present that are reducing the efficacy of deciles.
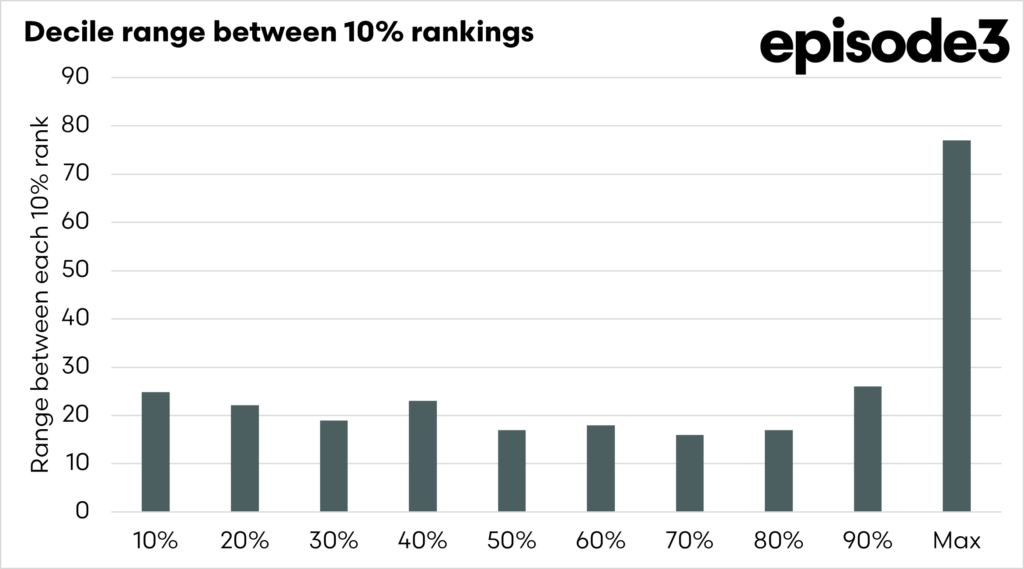
The range between the 90th percentile and the maximum price for wheat is often significantly larger than the other deciles due to the nature of extreme price events in commodity markets. While most price movements occur within relatively stable and narrow bands, the top end of the market distribution captures rare and volatile events. These include major supply shocks like droughts, war, export restrictions, or financial market upheaval, which can cause prices to surge well beyond normal trading levels.
Wheat typically follows a right-skewed distribution. That means most prices are clustered toward the lower and middle parts of the range, while the extreme highs, although infrequent, can be dramatically larger. This statistical skew means that while the 10th to 90th percentiles may be tightly grouped, the final slice from the 90th percentile to the maximum value captures the wildest fluctuations.
Percentile-based charts also naturally compress the middle of the dataset and exaggerate the extremes. Each decile represents 10% of the data, but the actual difference in price between those 10% brackets can vary widely. In normal conditions, the middle deciles are relatively stable. However, once prices push into the top 10%, the final range stretches to capture outliers, those rare, sharp spikes in the market. We saw this in recent years when Russia invaded Ukraine.

Decile charts are a useful decision-making tool for farmers because they help put current prices into a historical context. By showing how current prices compare to long-term patterns, people can assess whether a price is relatively low, average, or high. If the current wheat price sits in the 80th percentile. In that case, it indicates that prices have historically only been higher 20% of the time, suggesting a potentially good time to sell. Conversely, if prices are in the bottom deciles, farmers might hold off on marketing grain or adjust input spending accordingly.
However, deciles are only a snapshot based on historical data. They don’t predict where prices are going or account for future risks and opportunities. A price sitting in a low decile doesn’t guarantee it will rise, just as a high price doesn’t mean it will fall. Market fundamentals, seasonal conditions, global supply shocks, and currency movements can shift price dynamics quickly. Relying solely on deciles without understanding the current drivers of the market can lead to poor decisions. Farmers should use deciles as a reference point alongside other tools like seasonal forecasts, global market news, and input cost analysis to make balanced, informed decisions.
Do not use them in isolation.