
Producer share update – June 2025
Producer Share June 2025 Quarterly Update
The producer share of the retail dollar for both cattle and lamb continued to improve over the June 2025 quarter, extending the recovery that began earlier in the year. This latest update shows notable gains for producers, particularly in the lamb sector, where rising saleyard values have outpaced modest retail price changes.
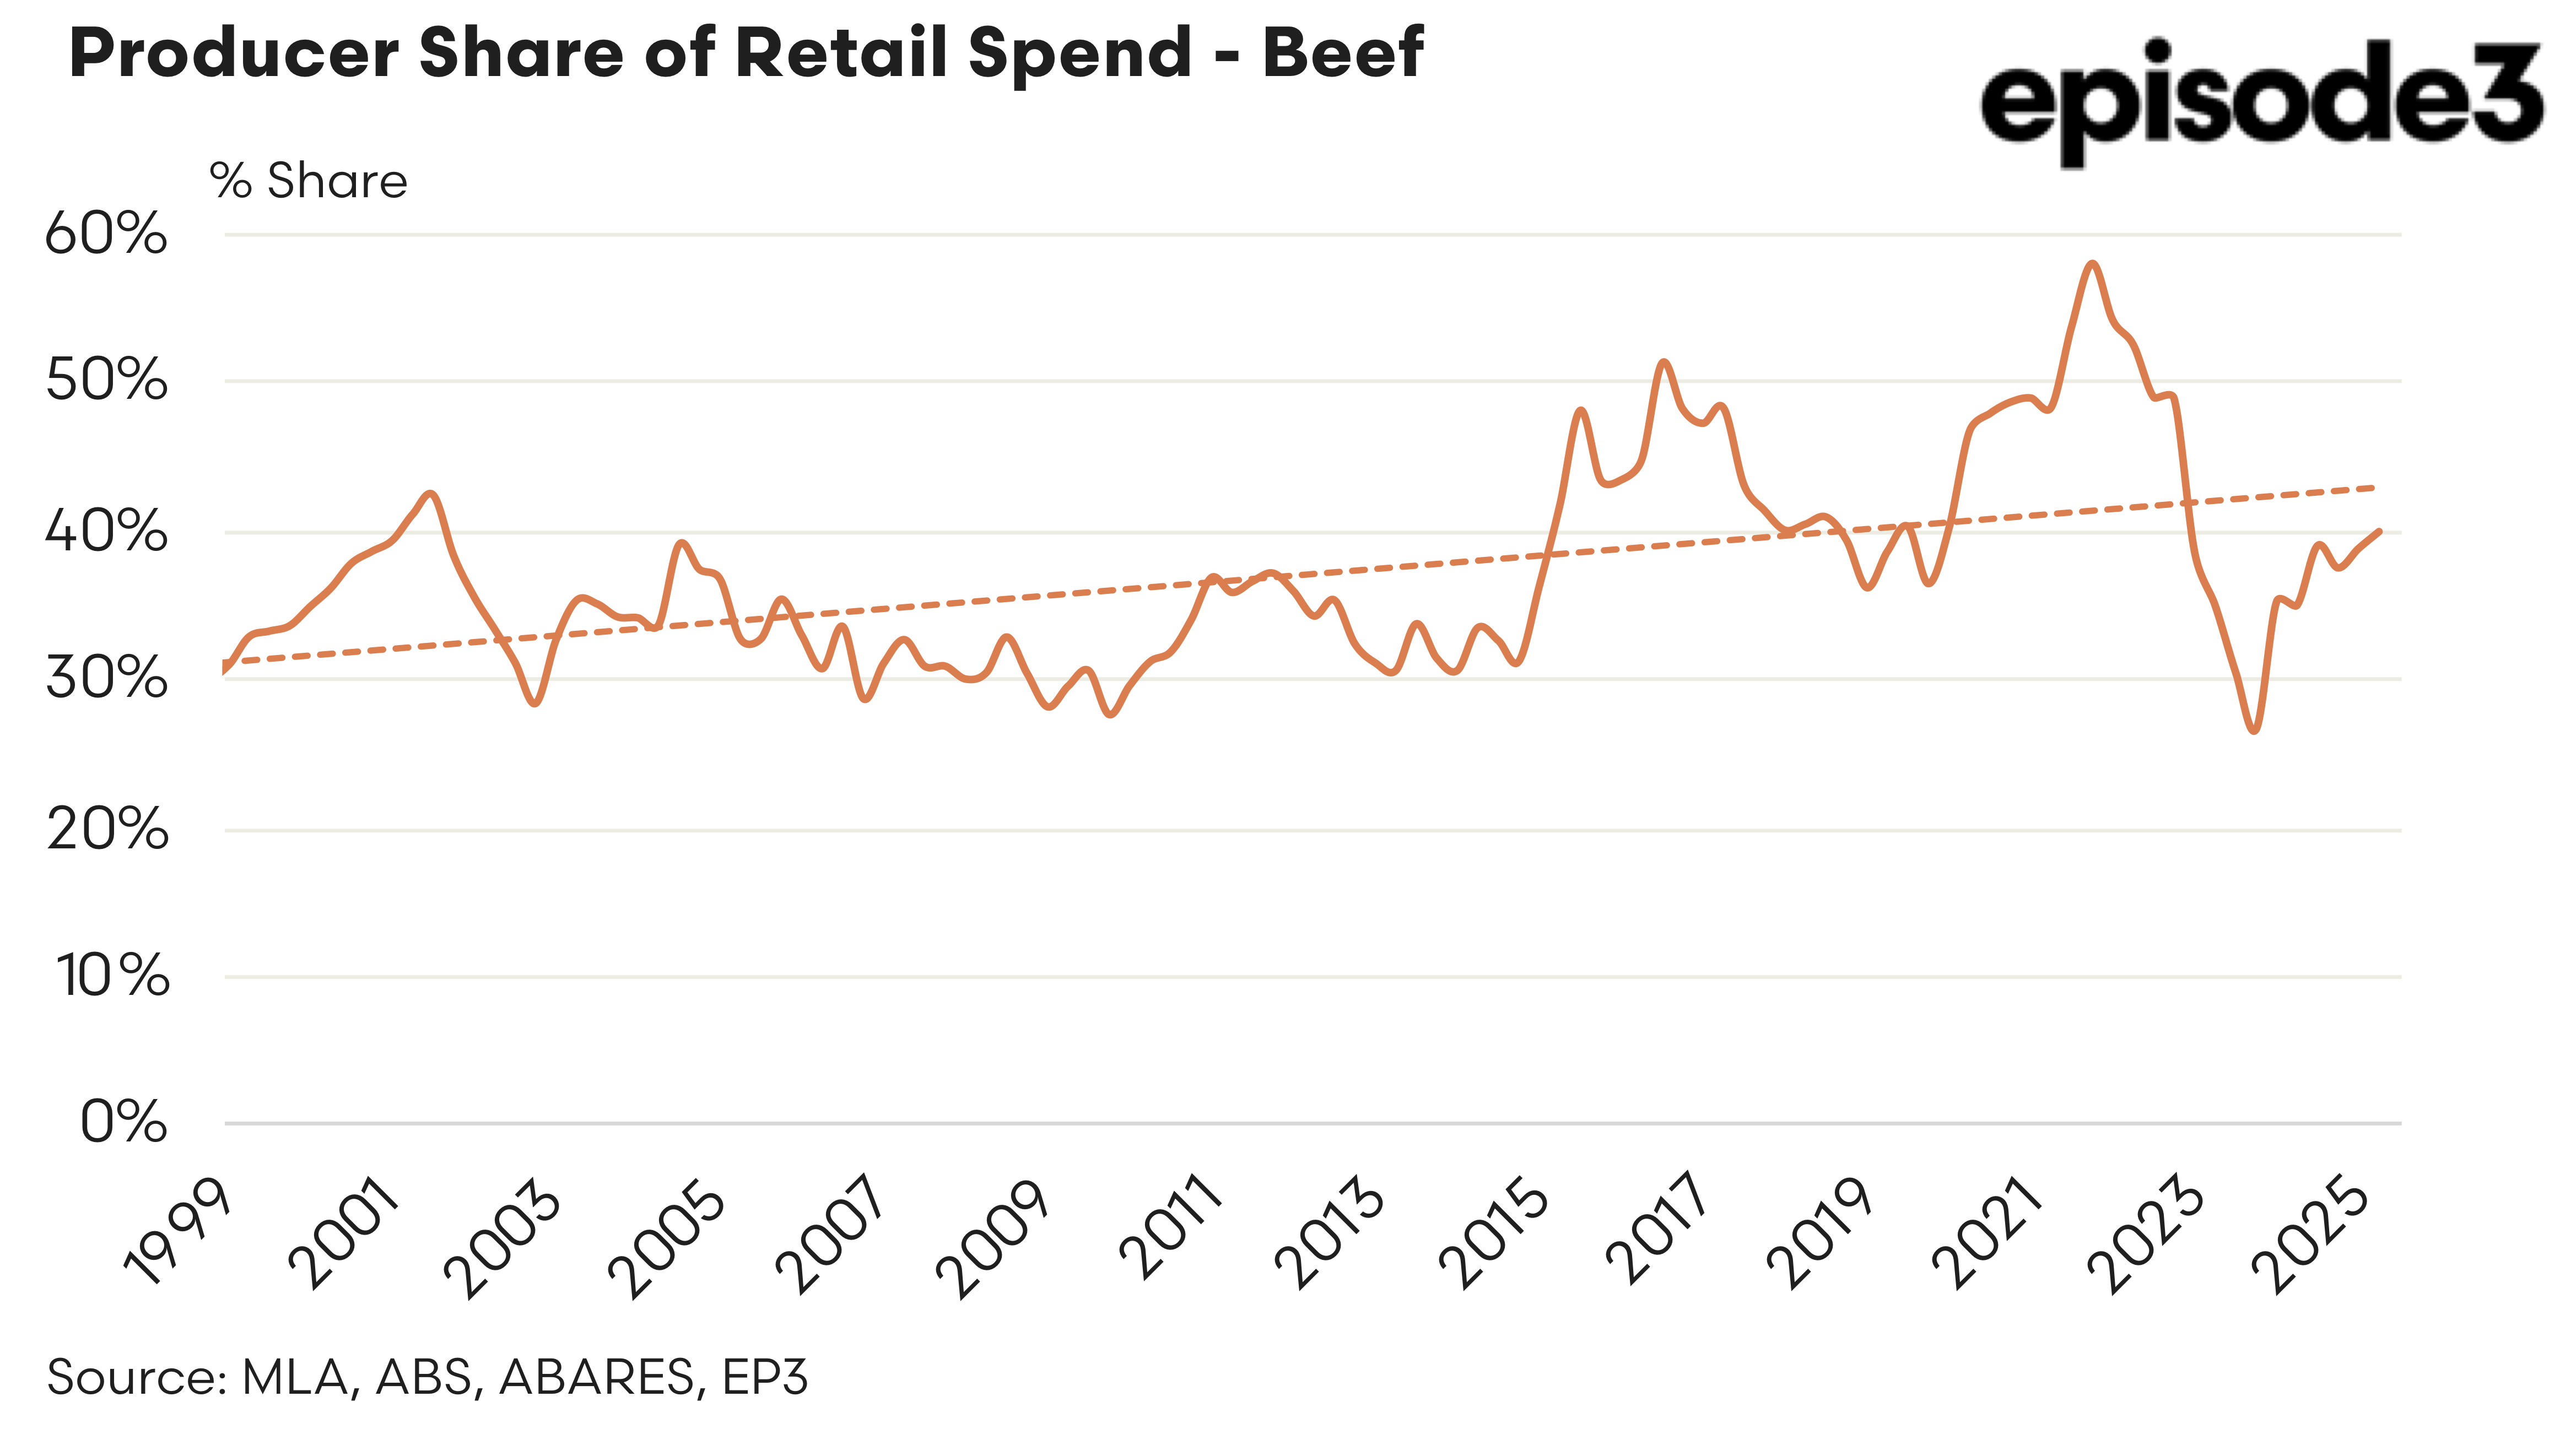
For cattle, the saleyard price index rose from 402 in the March quarter to 420 by the end of June, reflecting stronger competition for finished stock amid tightening supply and increased export interest. At the same time, the retail beef index increased from 268 to 272.
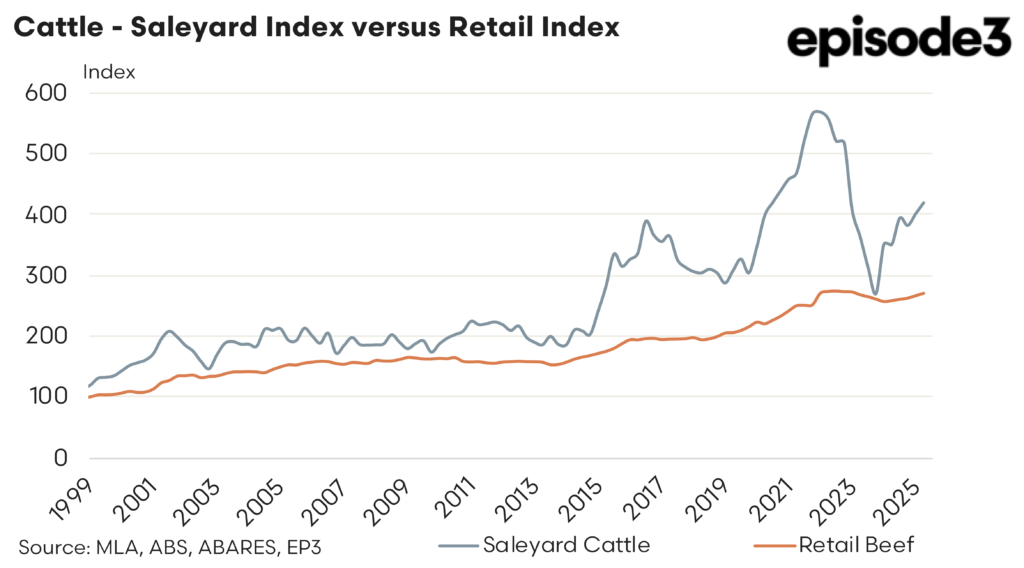
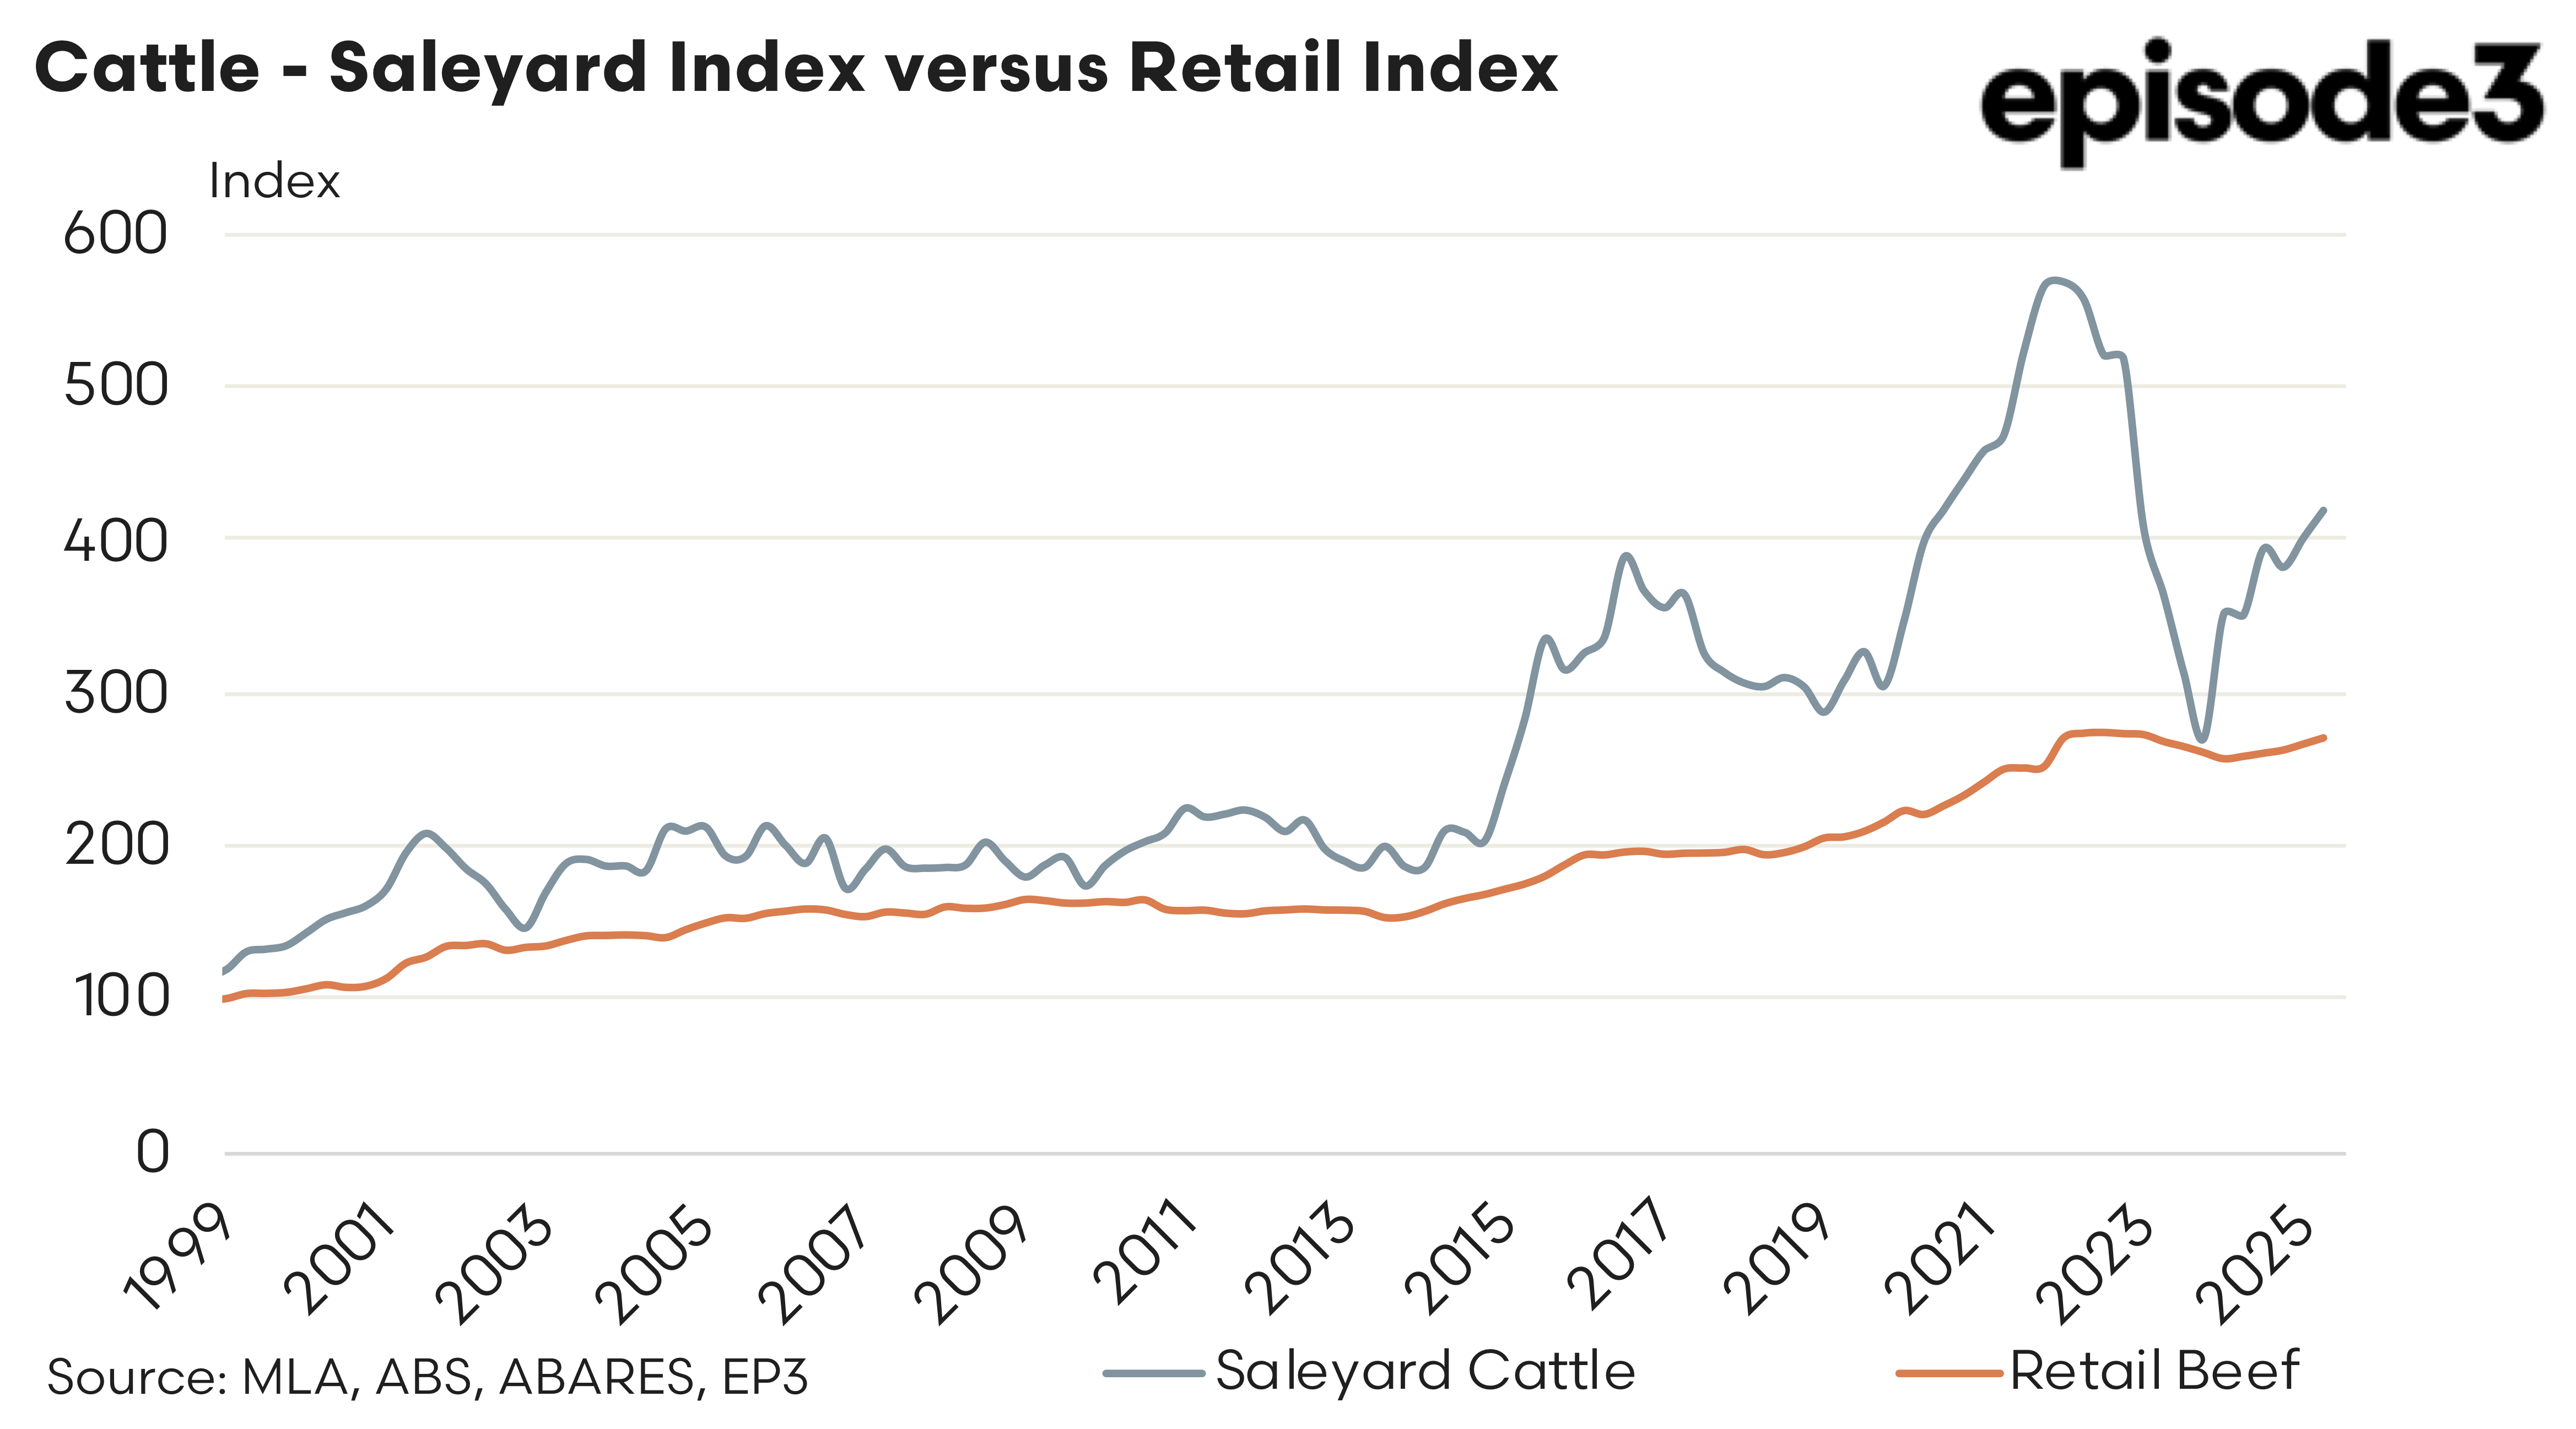
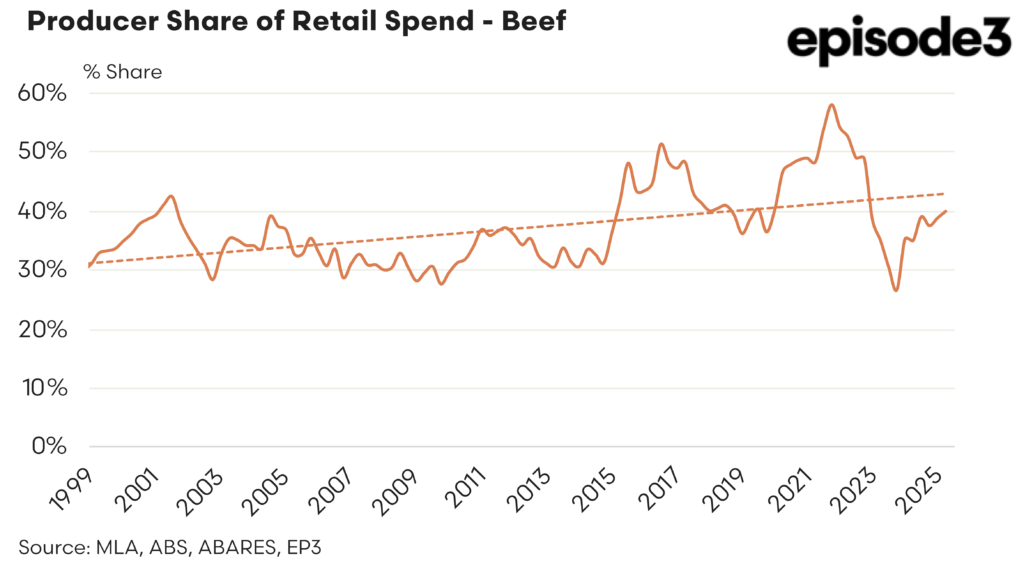
This combination resulted in a further improvement in the producer share of the retail beef dollar, rising from 38.8% in March to 39.9% by the end of June. While still below long-term averages, this marks a steady upward trajectory from the lows seen in mid to late 2024, when the producer share had slipped to the mid-thirty percent range.
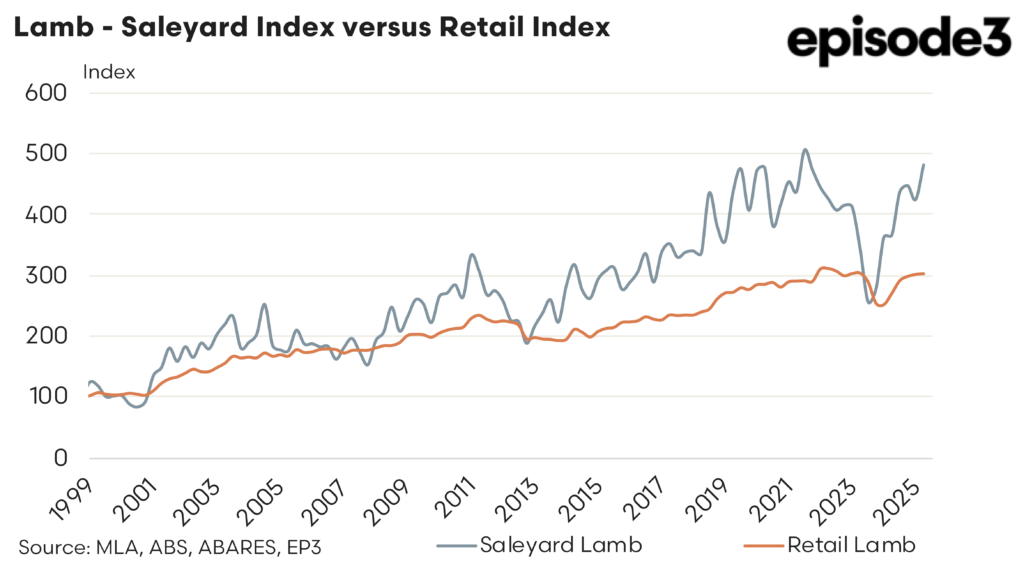
Lamb producers saw an even more pronounced gain. The saleyard lamb index climbed from 423 to 480 over the June quarter, a significant rise reflecting strong restocker and processor demand. In contrast, the retail lamb index remained largely flat, edging up only slightly from 301 to 302.

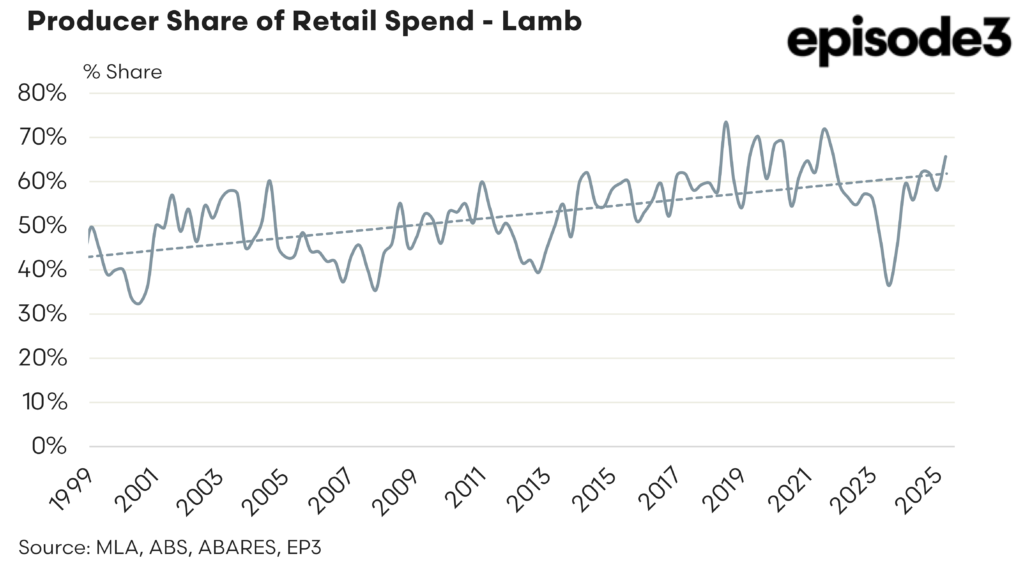
This dynamic delivered a sharp increase in the producer share of the retail lamb dollar, lifting from 58.1% in March to 65.7% by the end of June. This is one of the highest shares recorded in recent years and suggests that lamb producers are benefiting from favourable pricing conditions without those gains yet fully passing through to consumers.

The divergence in retail and saleyard price trends for lamb has created a temporary window in which producers capture a greater proportion of the end value. Whether this persists will depend on how quickly retail prices respond to the saleyard rally and whether demand at the consumer level can absorb further upward movement.
Overall, the June quarter figures confirm a continuation of the more producer-favourable conditions that began to emerge in early 2025. Cattle producers are clawing back some ground after a tough period, while lamb producers currently enjoy a particularly strong position in terms of value share. However, the sustainability of these gains remains tied to broader market dynamics including export demand, consumer purchasing power, and seasonal supply trends in the months ahead.
This quarterly analysis of the producer’s share of the retail beef dollar has been developed to track how much of the consumer spend on beef is returned to cattle producers. This series builds on an earlier version previously published by Meat & Livestock Australia (MLA), which ran for four years before being discontinued in 2016.
The current reporting series was re-established with MLA’s permission to meet renewed industry interest in understanding the value distribution along the beef supply chain. The calculation method follows the same approach as the earlier MLA series to ensure consistency and comparability over time.
The analysis is updated each quarter following the release of retail beef pricing data from the Australian Bureau of Statistics (ABS). It compares national saleyard cattle prices with average retail beef prices, using standard conversion factors to estimate the equivalent value per kilogram at retail level.
The producer share of the retail dollar is calculated using a set of consistent assumptions.
The national saleyard trade steer and trade lamb indicators are used as the benchmark for saleyard livestock prices, representing animals suitable for the domestic beef market. Price data is sourced from MLA’s National Livestock Reporting Service (NLRS).
To convert carcase weight prices into a retail weight equivalent is applied in order to reflecting average boning room recovery rates.
Retail beef and lamb prices are indexed from actual quarterly averages, using the respective red meat sub-group of the Consumer Price Index (CPI) published by the ABS. This CPI component reflects average prices for a basket of beef cuts across Australian capital cities, weighted by consumer spending patterns.
Finally, the producer share is calculated by dividing the retail weight equivalent value of the livestock by the average indicative retail beef price. This provides a percentage figure that reflects how much of the retail spend returns to the producer.