
Why is the grain price declining?

The wheat price has been on a downward trend since February, which is not great news for farmers in Australia, as we head towards harvesting. In the past few months, I have been travelling to various conferences to discuss the factors driving the market, which, in many cases, have been geopolitics; however, supply and demand remain the primary drivers of grain markets.
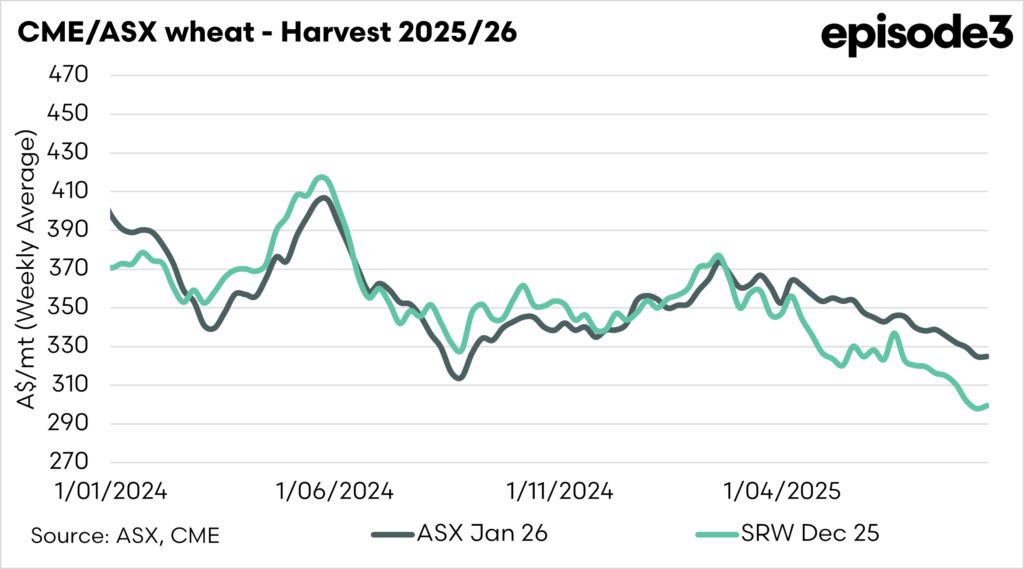
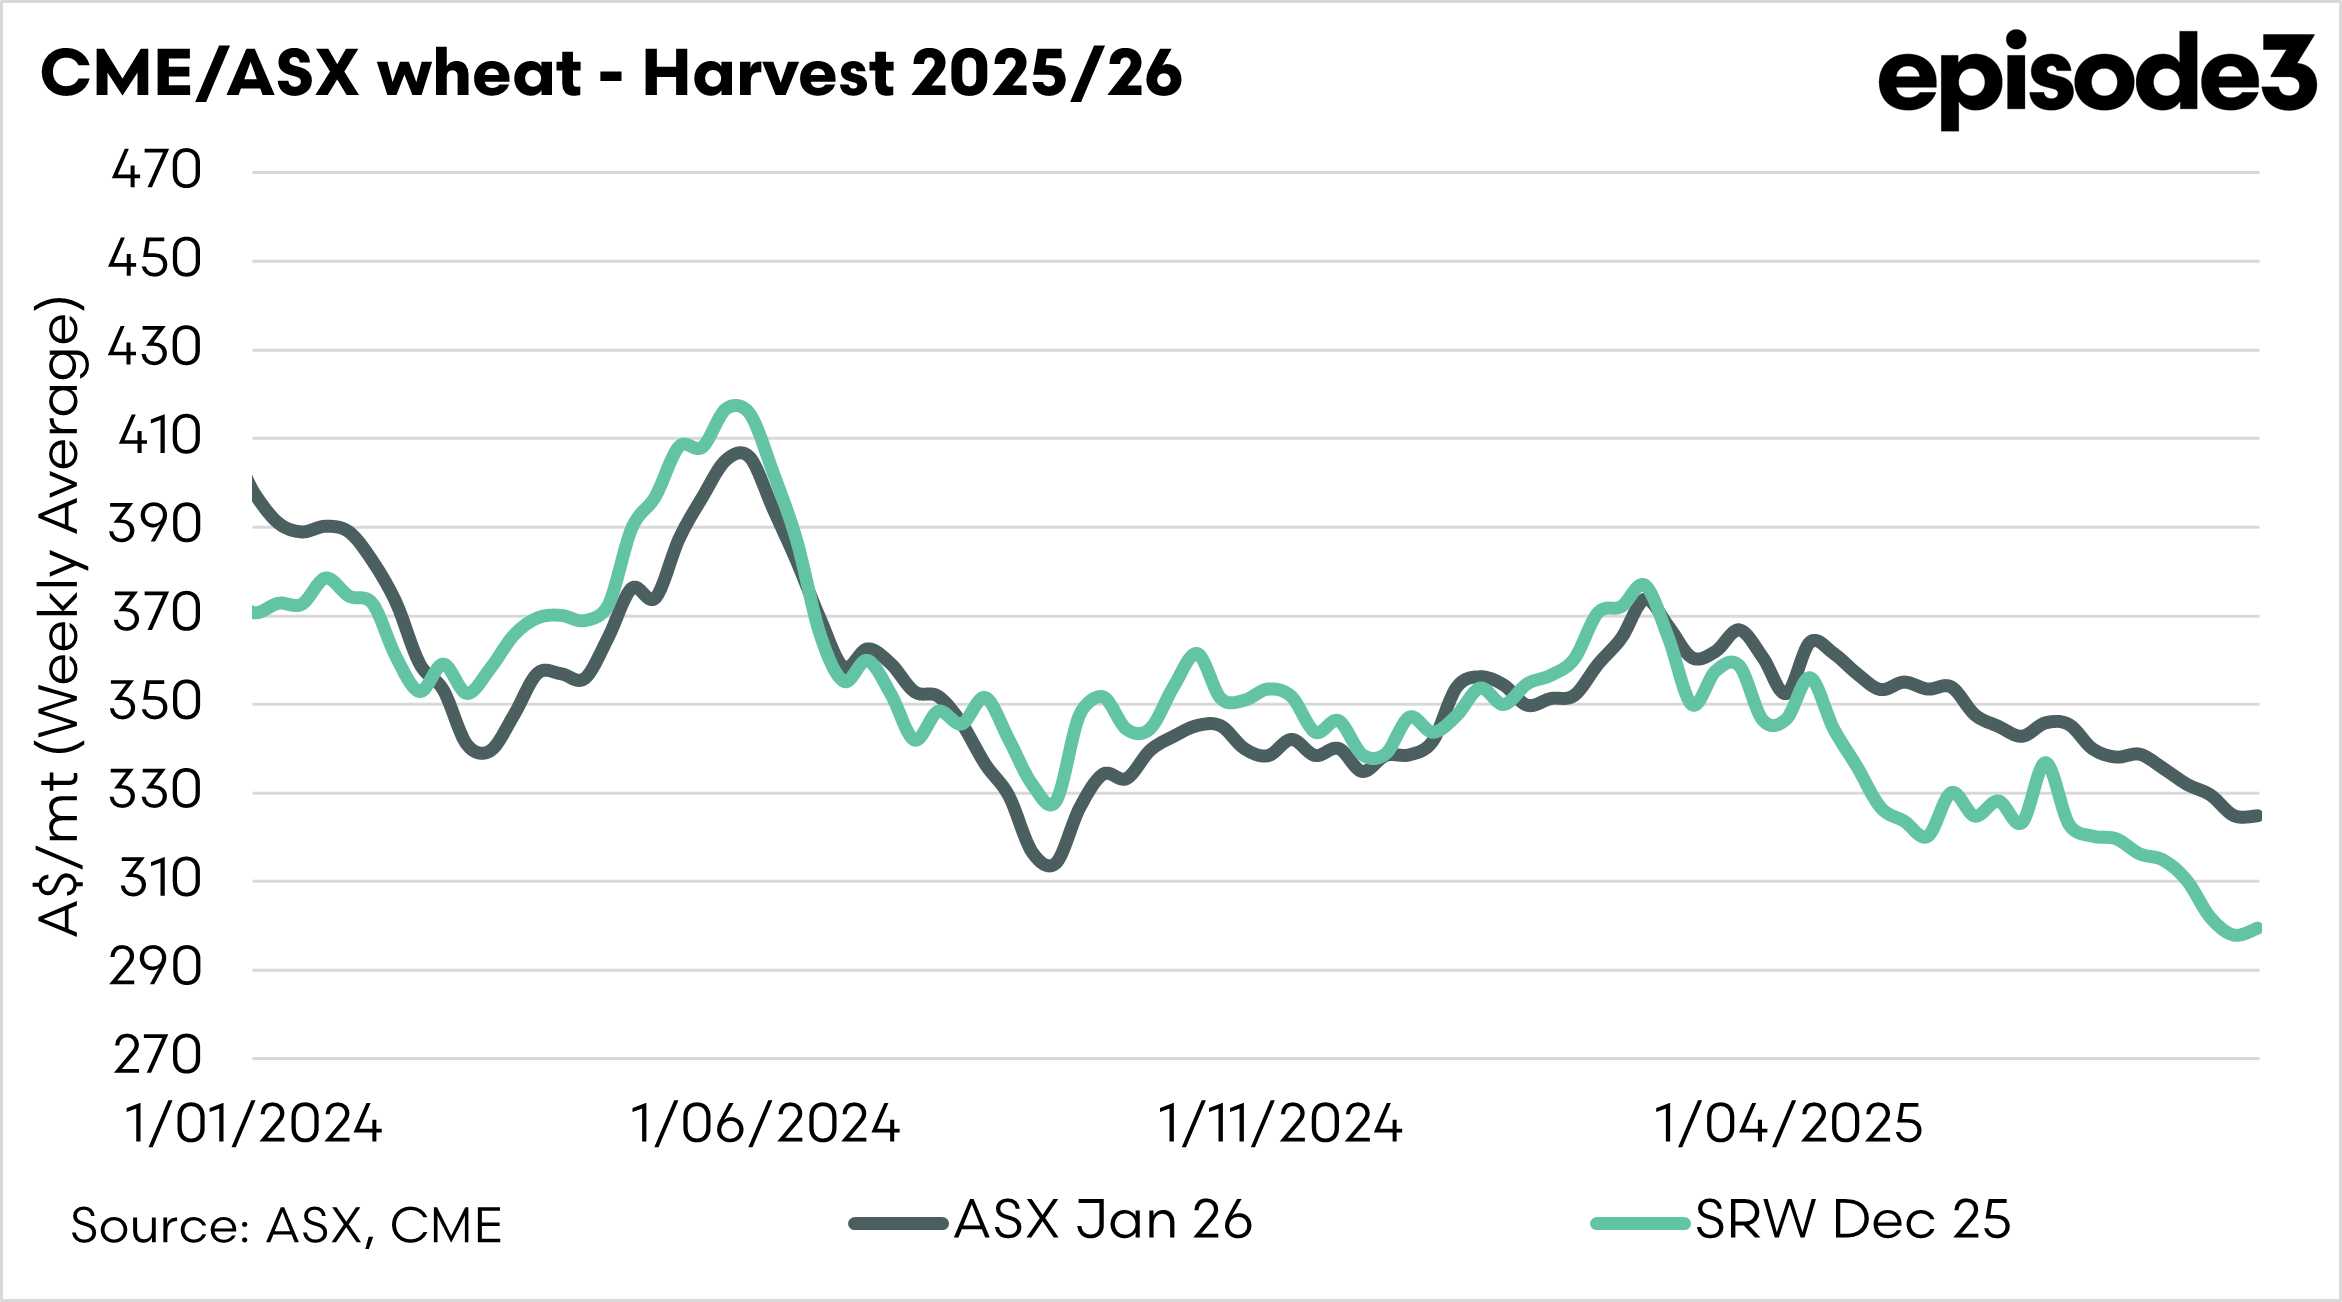
The chart below shows the ASX wheat price and the CBOT wheat price, which both closely match our harvest timing in Australia. In the past year, it has traded from above A$400, to now trading below A$300 (CBOT wheat).
The middle of the year usually has an increase in volatility, and with volatility the market can often provide opportunities for Australian farmers. Volatility shouldn’t be a word that scares (most of the time).
As we move into the middle of the year, the majority of the world’s crops are produced, as the northern hemisphere moves towards harvest.
This tends to set the price for the following months (and often beyond our harvest). This is because if something is going to go wrong for the worlds crop, it will be around this time (June to September).
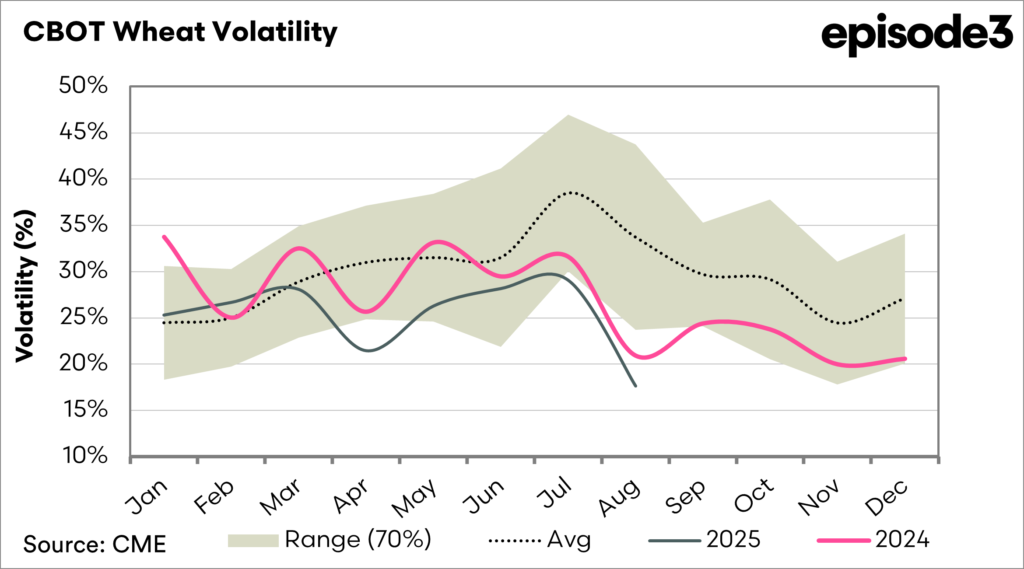
This year, the volatility in the wheat market has been remarkably low, as seen in the chart below. The world hasn’t had any major issues to cause a major drop in supply, and that is what is now directing the market – large supplies

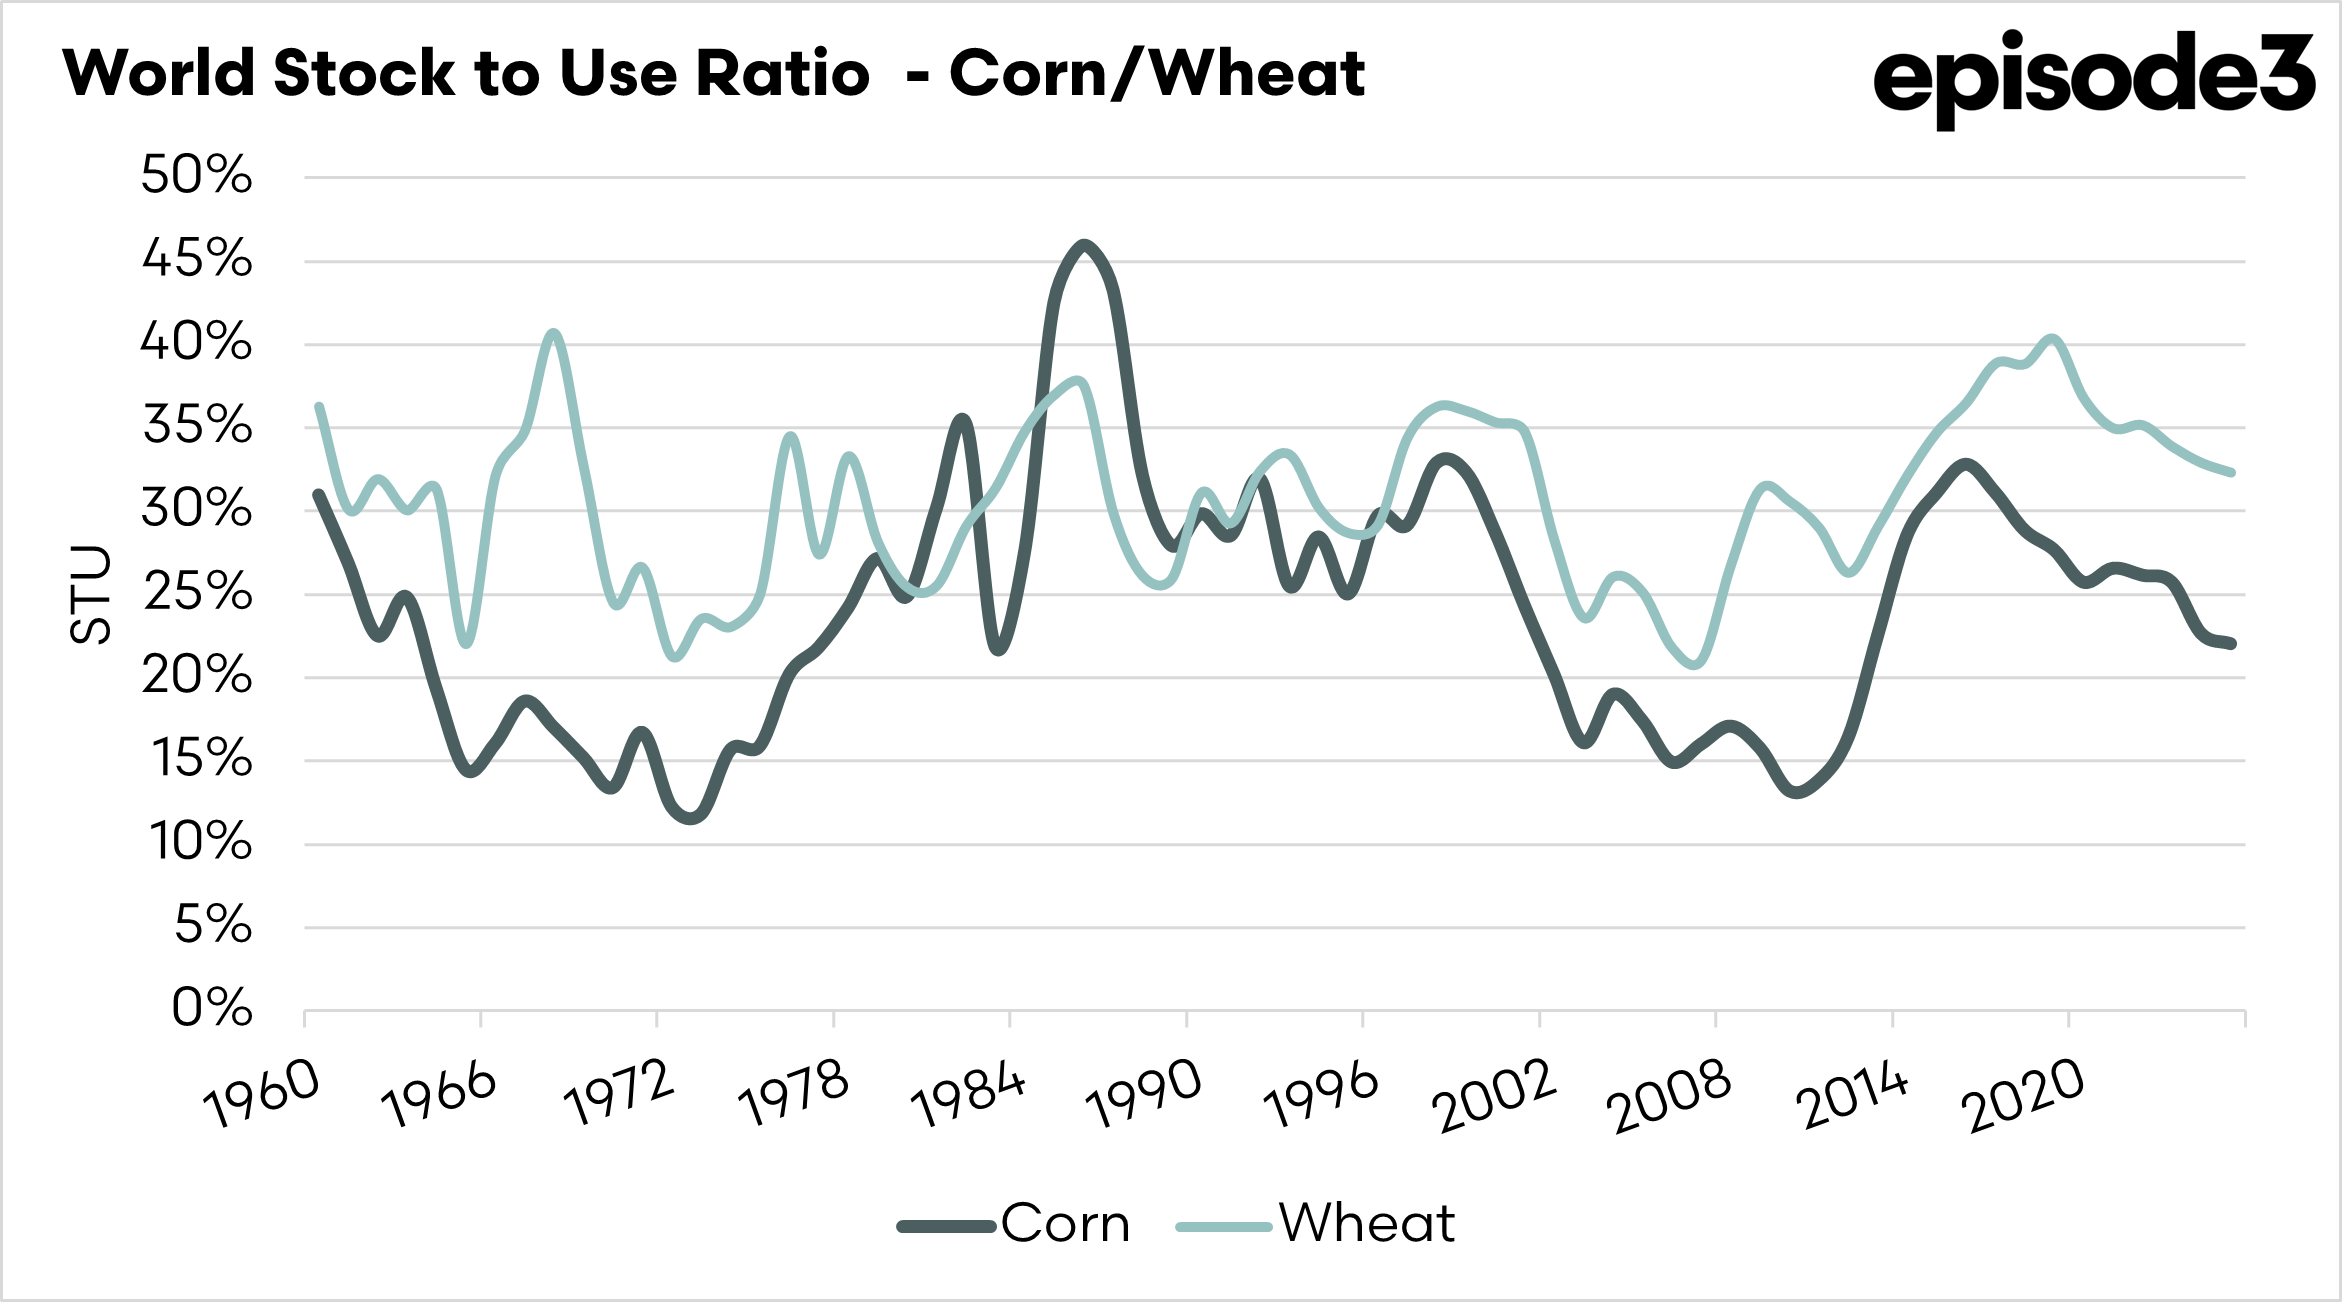
The stocks-to-use ratio is one of the most important gauges of balance in agricultural commodity markets. It measures the amount of grain left in storage at the end of a season compared with total demand, expressed as a percentage. In practical terms, it indicates how much of a buffer exists between supply and consumption. A low stocks-to-use ratio points to a tighter market, where even small disruptions in production or trade can spark price rallies. Conversely, a higher ratio signals comfortable inventories and puts downward pressure on prices.
At present, the story differs depending on the crop. In corn, the global stocks-to-use ratio is sitting at historically lean levels. Even with record production forecasts, stocks are expected to remain below long-term averages, leaving the market vulnerable to weather shocks or export disruptions.
Wheat tells a different story. Stocks are comparatively comfortable, with the global ratio hovering close to 38 per cent. This suggests an overall oversupplied market, although regional risks, particularly in the Black Sea, could still cause volatility.

The stocks to use ratio is one of the most telling measures of balance in world grain markets. It reflects how much carryover stock is available at the end of the season compared to total demand, giving a percentage indicator of how comfortable or tight supplies are. It is important because it takes into account both supply and demand.
Low ratios often mean heightened price risk, while high ratios suggest markets can weather production shocks more easily.
In the most recent period, wheat remains well supplied, with global ratios near 35 per cent in 2025. Corn, however, shows a decline toward 22 per cent, keeping it tighter and more exposed to production or trade disruptions. Taken together, the picture is of a world where wheat offers security of supply. The world having relatively healthy supplies of both corn and wheat, places a bearish tone on the market.
However, there is a little more to it.

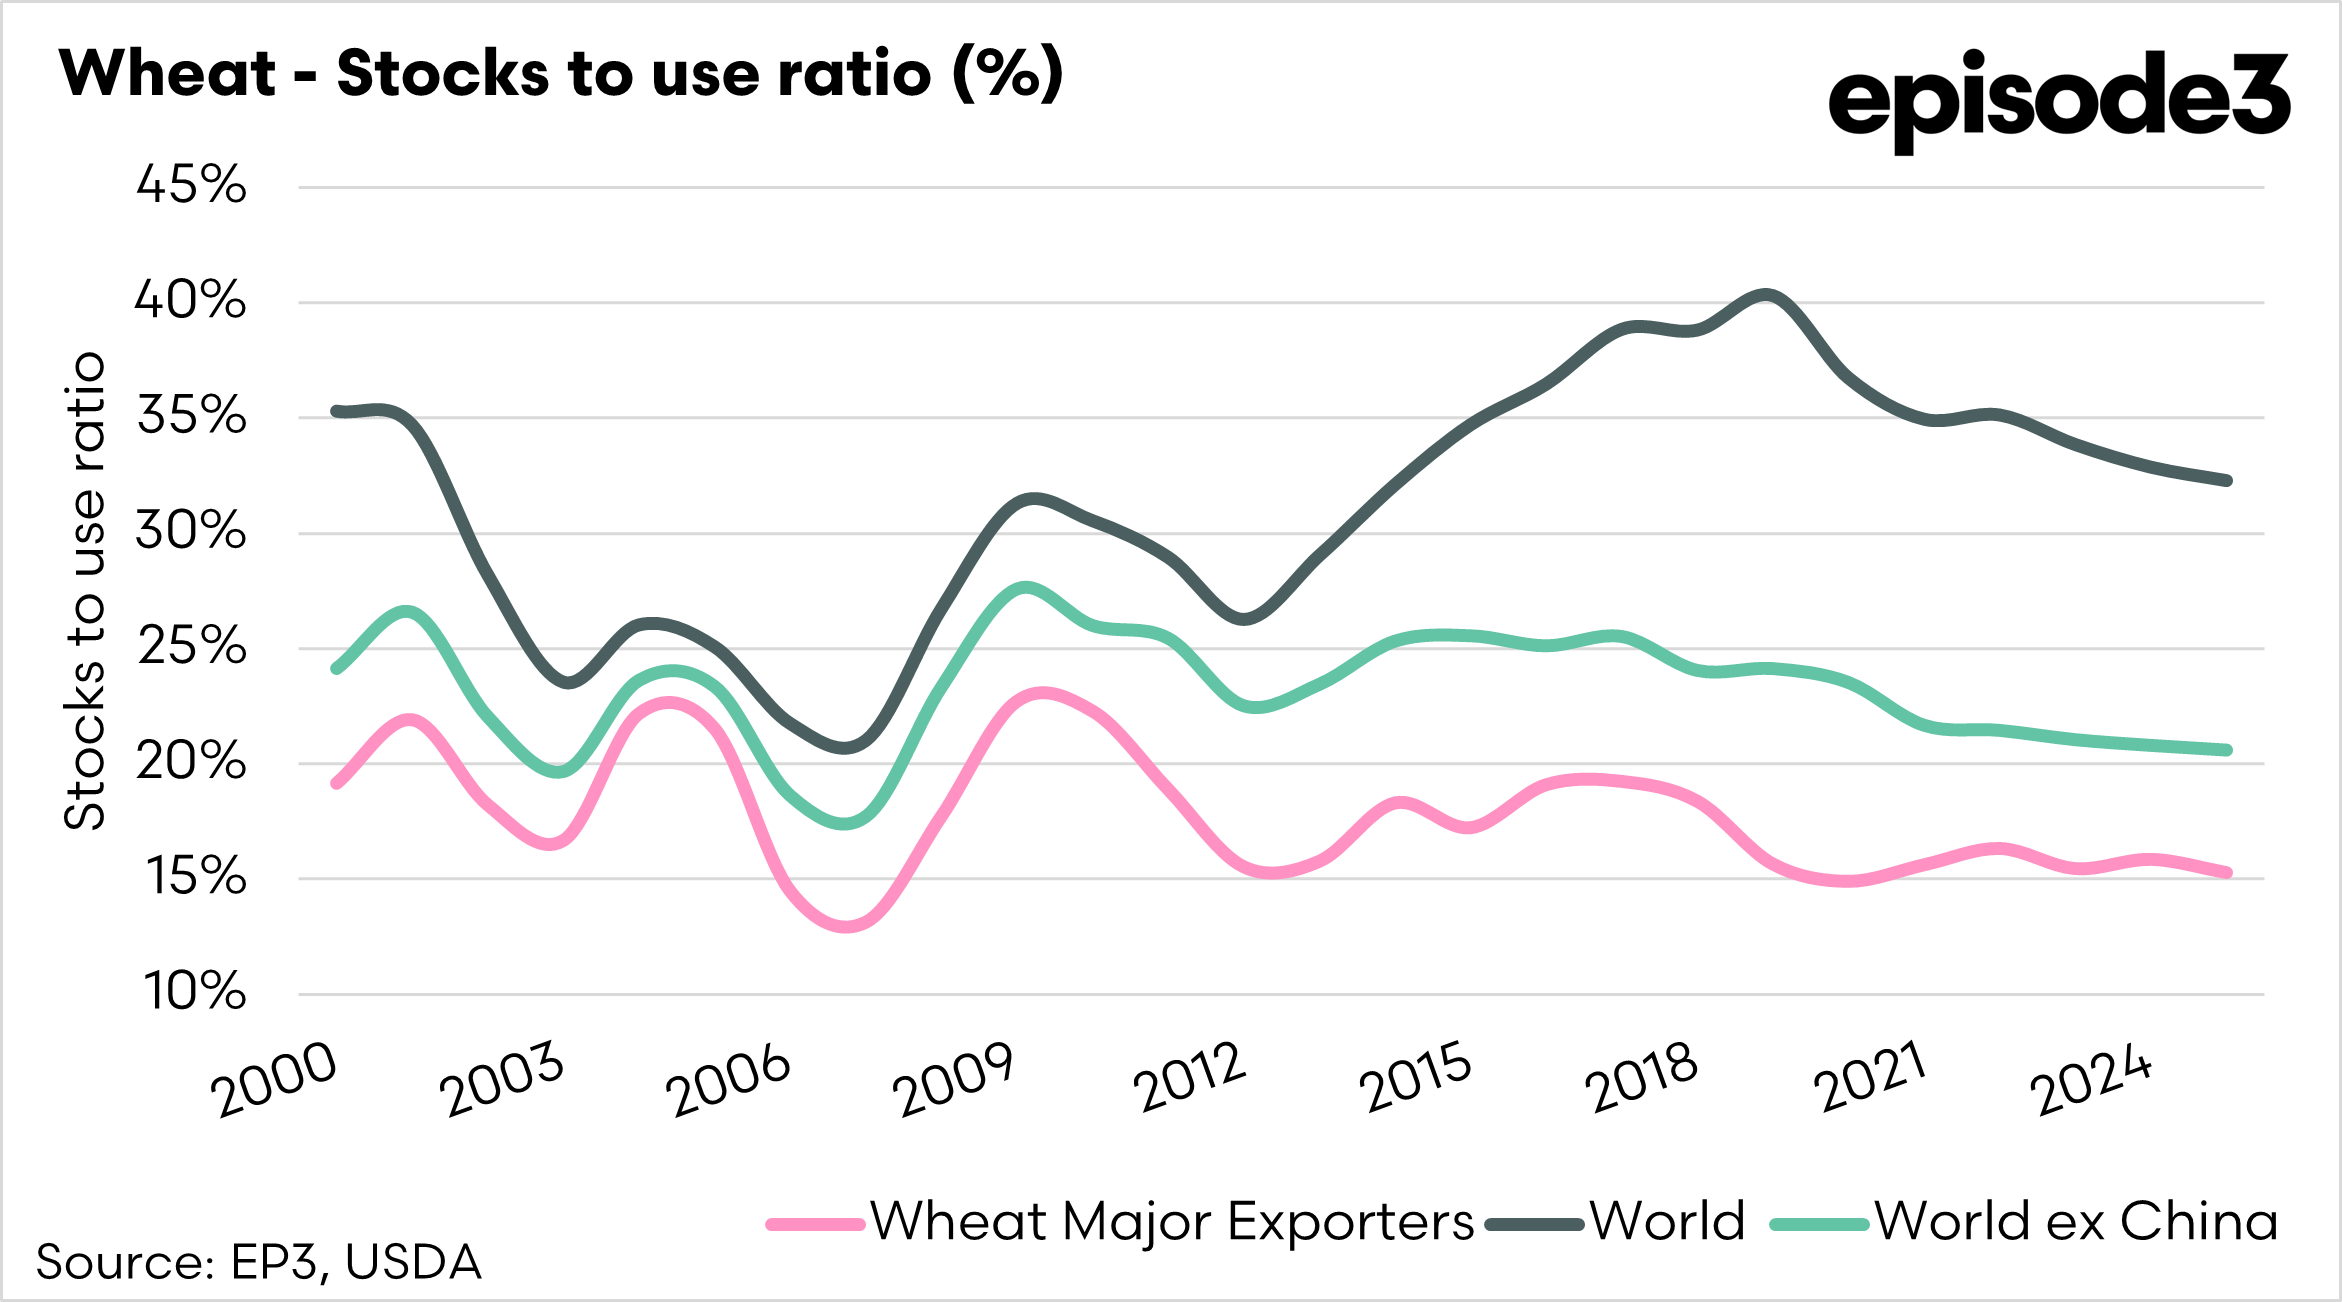
If we delve further into the stocks to use ratio of wheat, we can see that the overall balance sheet is quite strong for wheat. It is when we delve into the numbers and look at the wheat exporters and the world without China.
China holds just over one-half of the world’s supply of wheat; it will likely never be traded on the world market, so the global figure is irrelevant if China is included. So when we remove China, we see a different picture. We see a declining stocks to use ratio, which is the lowest since 2008.
The major wheat exporters provide the majority of the world’s wheat supplies to countries of deficit. They are the significant countries to keep an eye on. The stocks to use ratio for the major exporters has been hovering around the 15% mark in the 2020s, which is on the low end of the scale.
If anything majorly goes wrong in a couple of the major wheat exporters, then that can lead to supply shortages.
The problem is that there has been no major issue with the scale to disrupt the supply of wheat around the world massively. That is why we have seen prices start to decline.
It does, however, continue to point to a relatively short supply of wheat if there is a major issue with the exporters in the 2026 season. It’s not good news for the next couple of months, but the scene is still set for a rebound in pricing, provided something goes wrong in the other majors (but not us!)