
Seasonal lamb supply trends
Market Morsel
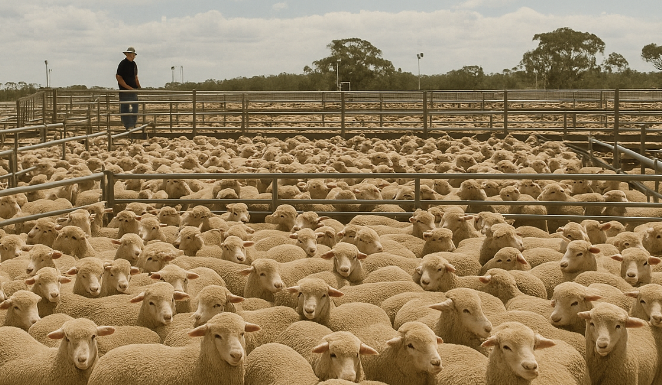
MLA reported historic lamb and sheep saleyard throughput volumes on a monthly basis provide an insight into how the production cycle impacts supply across the season. Monthly yarding data was collected and indexed to provide a summary of the ten-year average seasonal trend and the current trend seen so far in 2025. The yarding indices highlight how seasonal cycles play out differently across states, reflecting lambing calendars, climatic conditions and regional production systems.
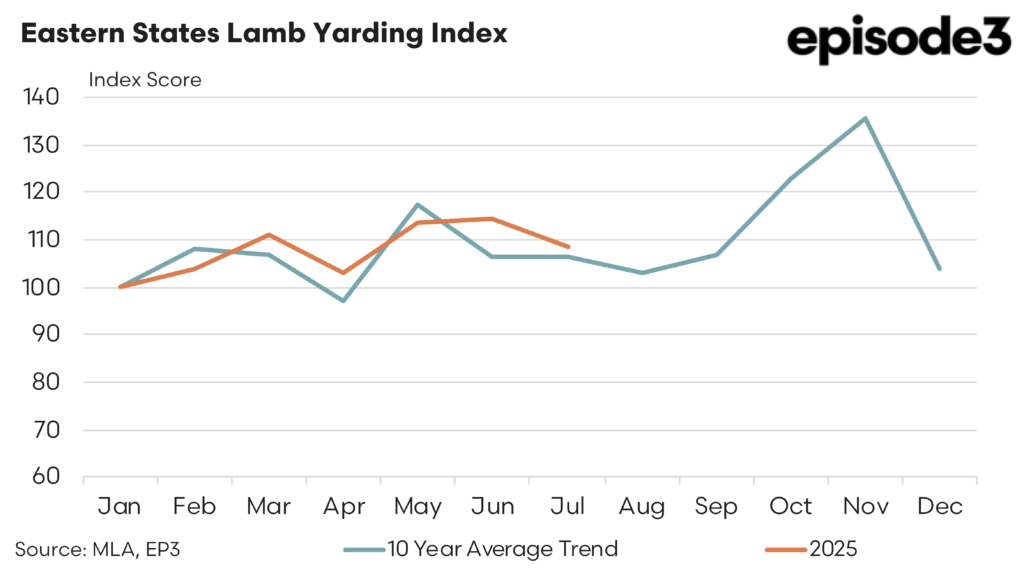
In the eastern states, which account for the majority of national lamb supply, the ten-year trend shows a steady build in throughput across autumn, peaking in May before easing through winter. Yardings then climb sharply from September, with November traditionally recording the heaviest turn-off. This spring flush reflects the timing of lambing in high rainfall and mixed farming regions, as well as the structure of the domestic processing sector which is geared towards peak flows late in the year. In 2025, the broad shape of the eastern states trend has held true, although yardings in March–April were slightly softer than average before recovering to align with the long-run profile by early winter.

Looking more closely at state-level indices reveals additional variation. In New South Wales, the ten-year average indicates strong yardings early in the year, a softening through March–April, and then a sharp lift into spring, with July to October the key supply months. In 2025, the pattern has been similar, although May yardings surged higher than usual, pulling the cumulative trend above average heading into winter. This reflects both seasonal conditions and the earlier marketing of lambs in some districts.


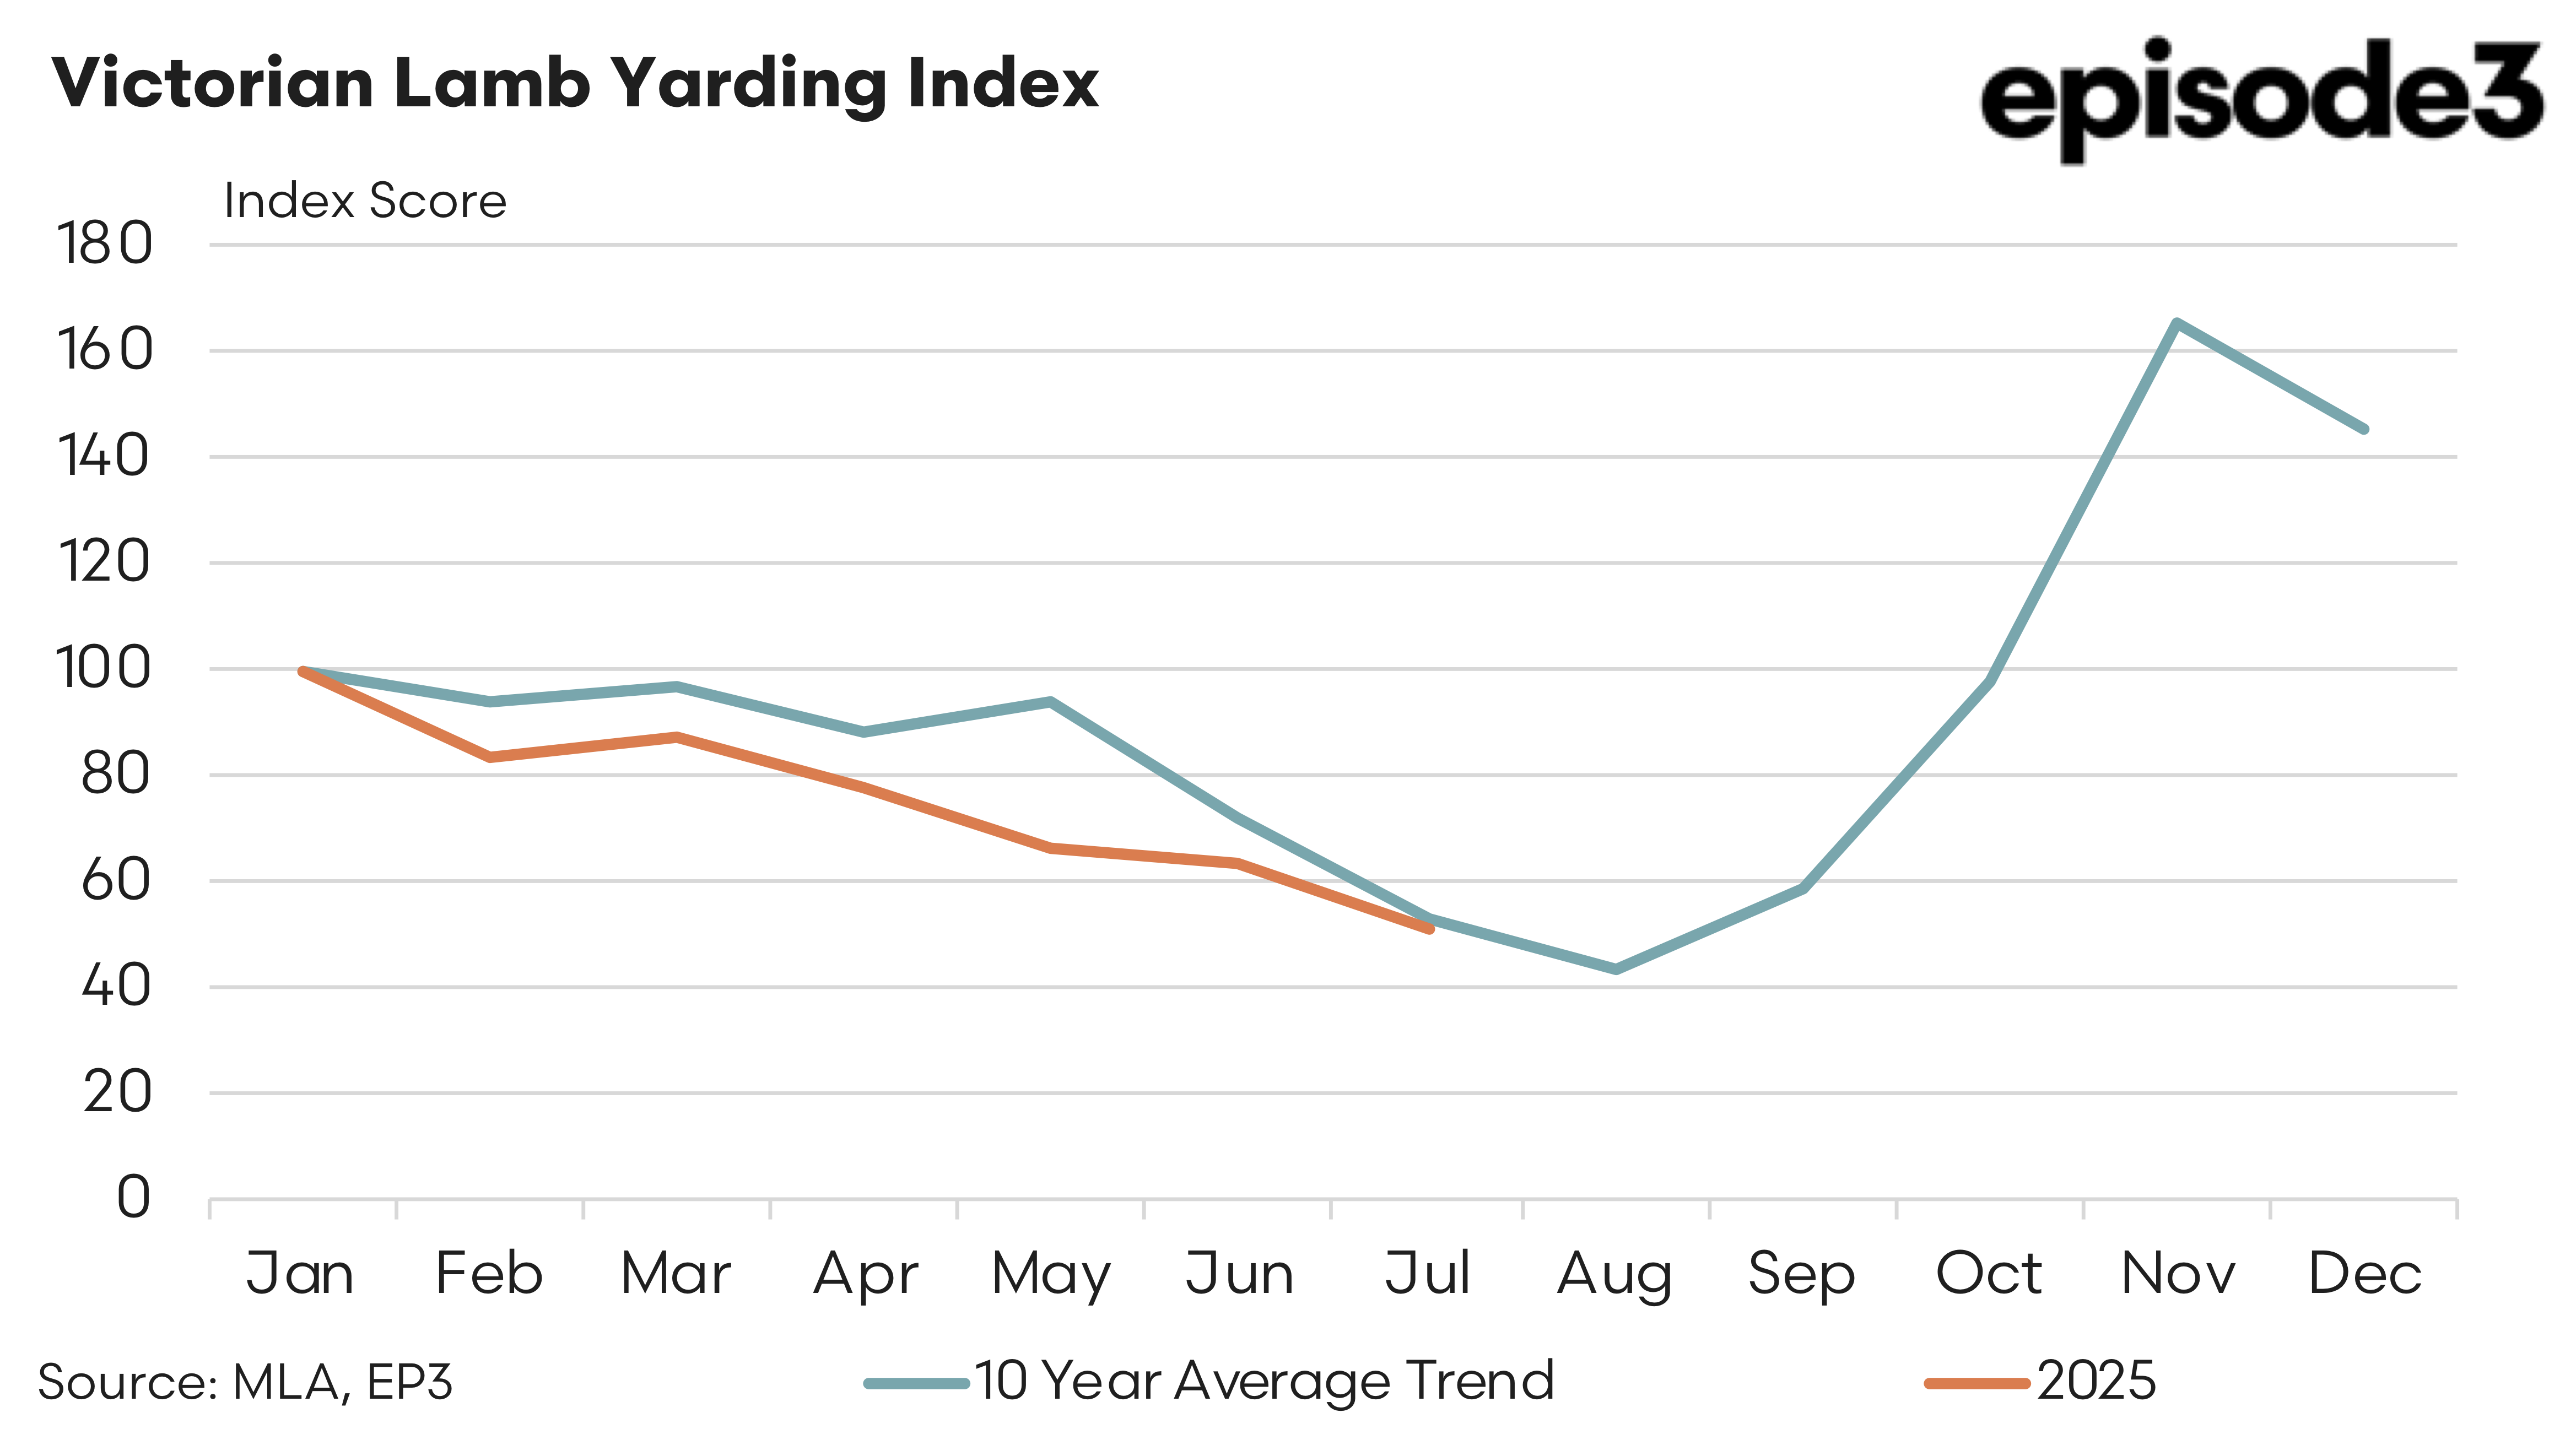
Victoria, by contrast, exhibits the most pronounced spring flush. The ten-year pattern shows yardings easing consistently from January through to a winter low in July–August, before exploding upwards into October–November, when volumes more than double compared to mid-year levels. This reflects the state’s concentration of spring lambing flocks. In 2025, Victorian yardings have been softer than average across autumn and into winter, tracking below the long-run seasonal line. The spring flush remains critical, and a key question will be whether this year’s October–November turn-off can match the strength of past cycles given the subdued mid-year supply.

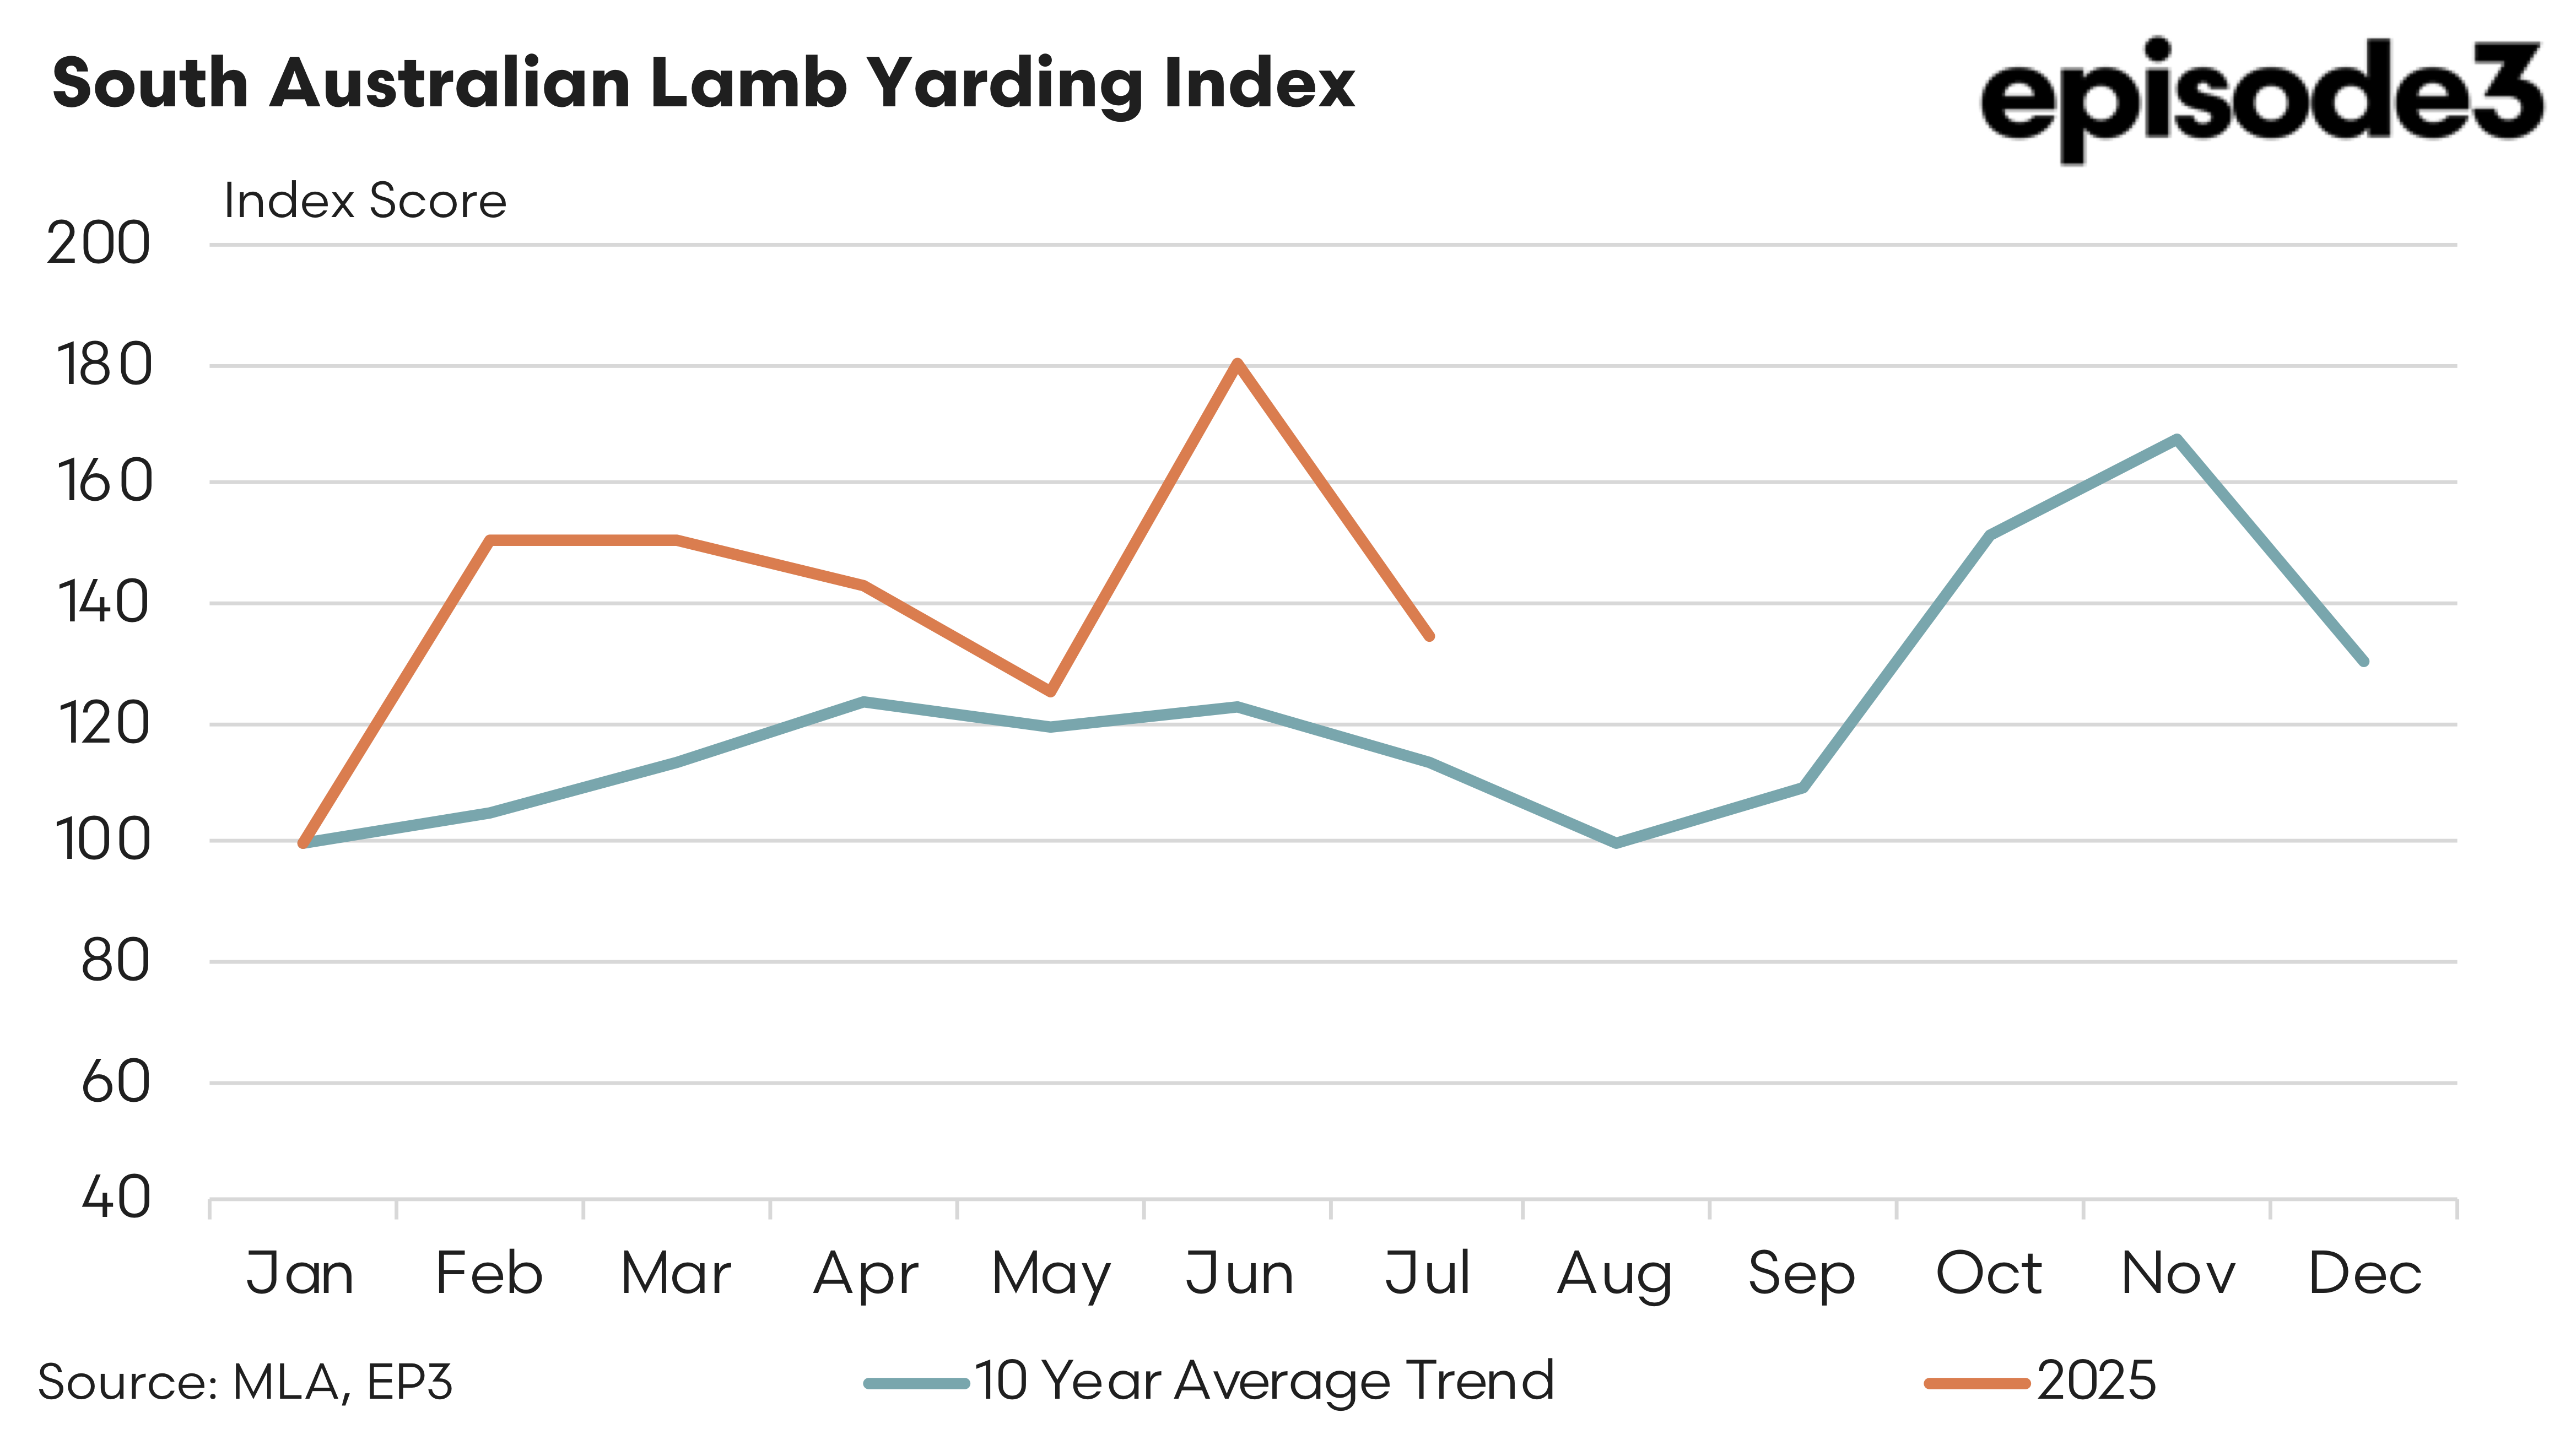
South Australia’s lamb yarding trend also highlights the importance of spring, although the ten-year pattern shows a steadier throughput through autumn compared to Victoria. Yardings typically lift into October–November, but without the same dramatic spike seen further east. In 2025, however, conditions have diverged sharply. A much worse season, with widespread drought, has pushed producers to market earlier than usual. Yardings surged from February onward, and by May–June were running nearly double the ten-year average. This heavy early turn-off suggests that the traditional spring flush may be constrained, as lambs have been offloaded ahead of feed shortages.

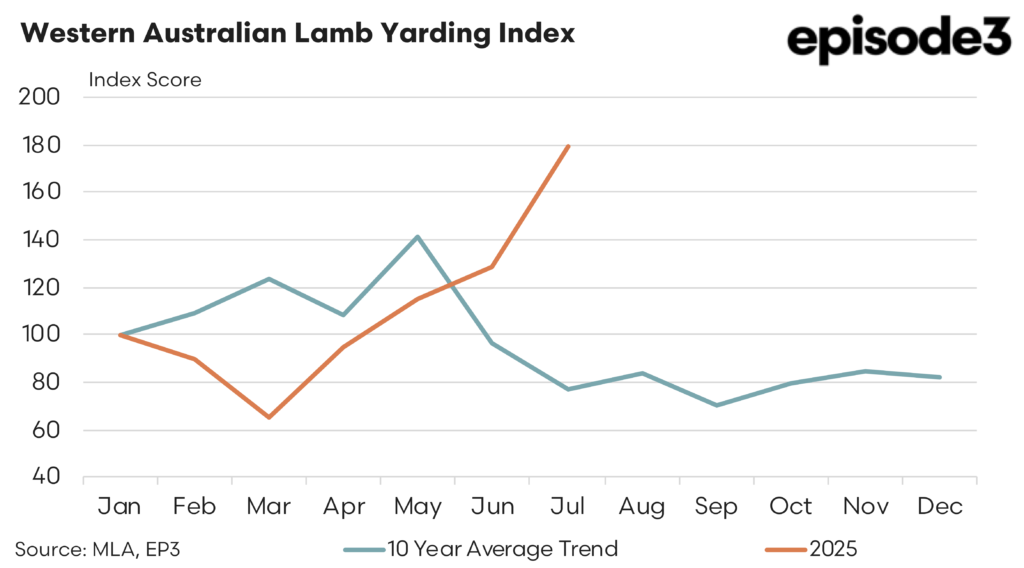
Western Australia shows a very different seasonal profile to the eastern states. The ten-year average indicates yardings peaking in May, reflecting the earlier lambing season, before collapsing into June–July and remaining low through spring and summer. Unlike Victoria and New South Wales, WA does not experience a large late-year flush. In 2025, the pattern has diverged sharply from the long-term profile. After a soft start in February–March, yardings surged well above average from April and into June, reaching almost double the seasonal norm by mid-winter. This points to significant early marketing of lambs, again influenced by dry conditions and feed availability.

The national picture therefore highlights two key themes. First, the ten-year averages confirm the distinct seasonal cycles driven by regional production systems: an early winter peak in WA, a spring flush in Victoria and SA, and a more balanced but still spring-focused profile in NSW and the broader eastern states. Second, the 2025 season so far has seen divergence from these trends, particularly in the southern states where drought has forced a heavier turn-off earlier in the year. NSW has also seen elevated throughput in May, while Victoria’s yardings have been below average, setting up a watchpoint for the size of its usual spring flush.
These shifts underline how climatic conditions and feed availability can reshape supply timing. While the long-run averages provide a guide to the “normal” shape of lamb throughput, the 2025 experience demonstrates how weather shocks and market pressures push producers to adjust marketing strategies. For processors and buyers, this creates a different challenge each season: managing the timing of peak flows while also responding to the unpredictable shifts that drought or favourable rainfall can trigger.
As the eastern states seasonal pattern demonstrates the spring flush of lambs is coming, and will peak in November. This spring flush often coincides with price pressure as the new season lambs hit the market in volume. Turning the NTLI price into an index highlights the average seasonal trend with its winter price peak in July/August and the spring trough in late November.

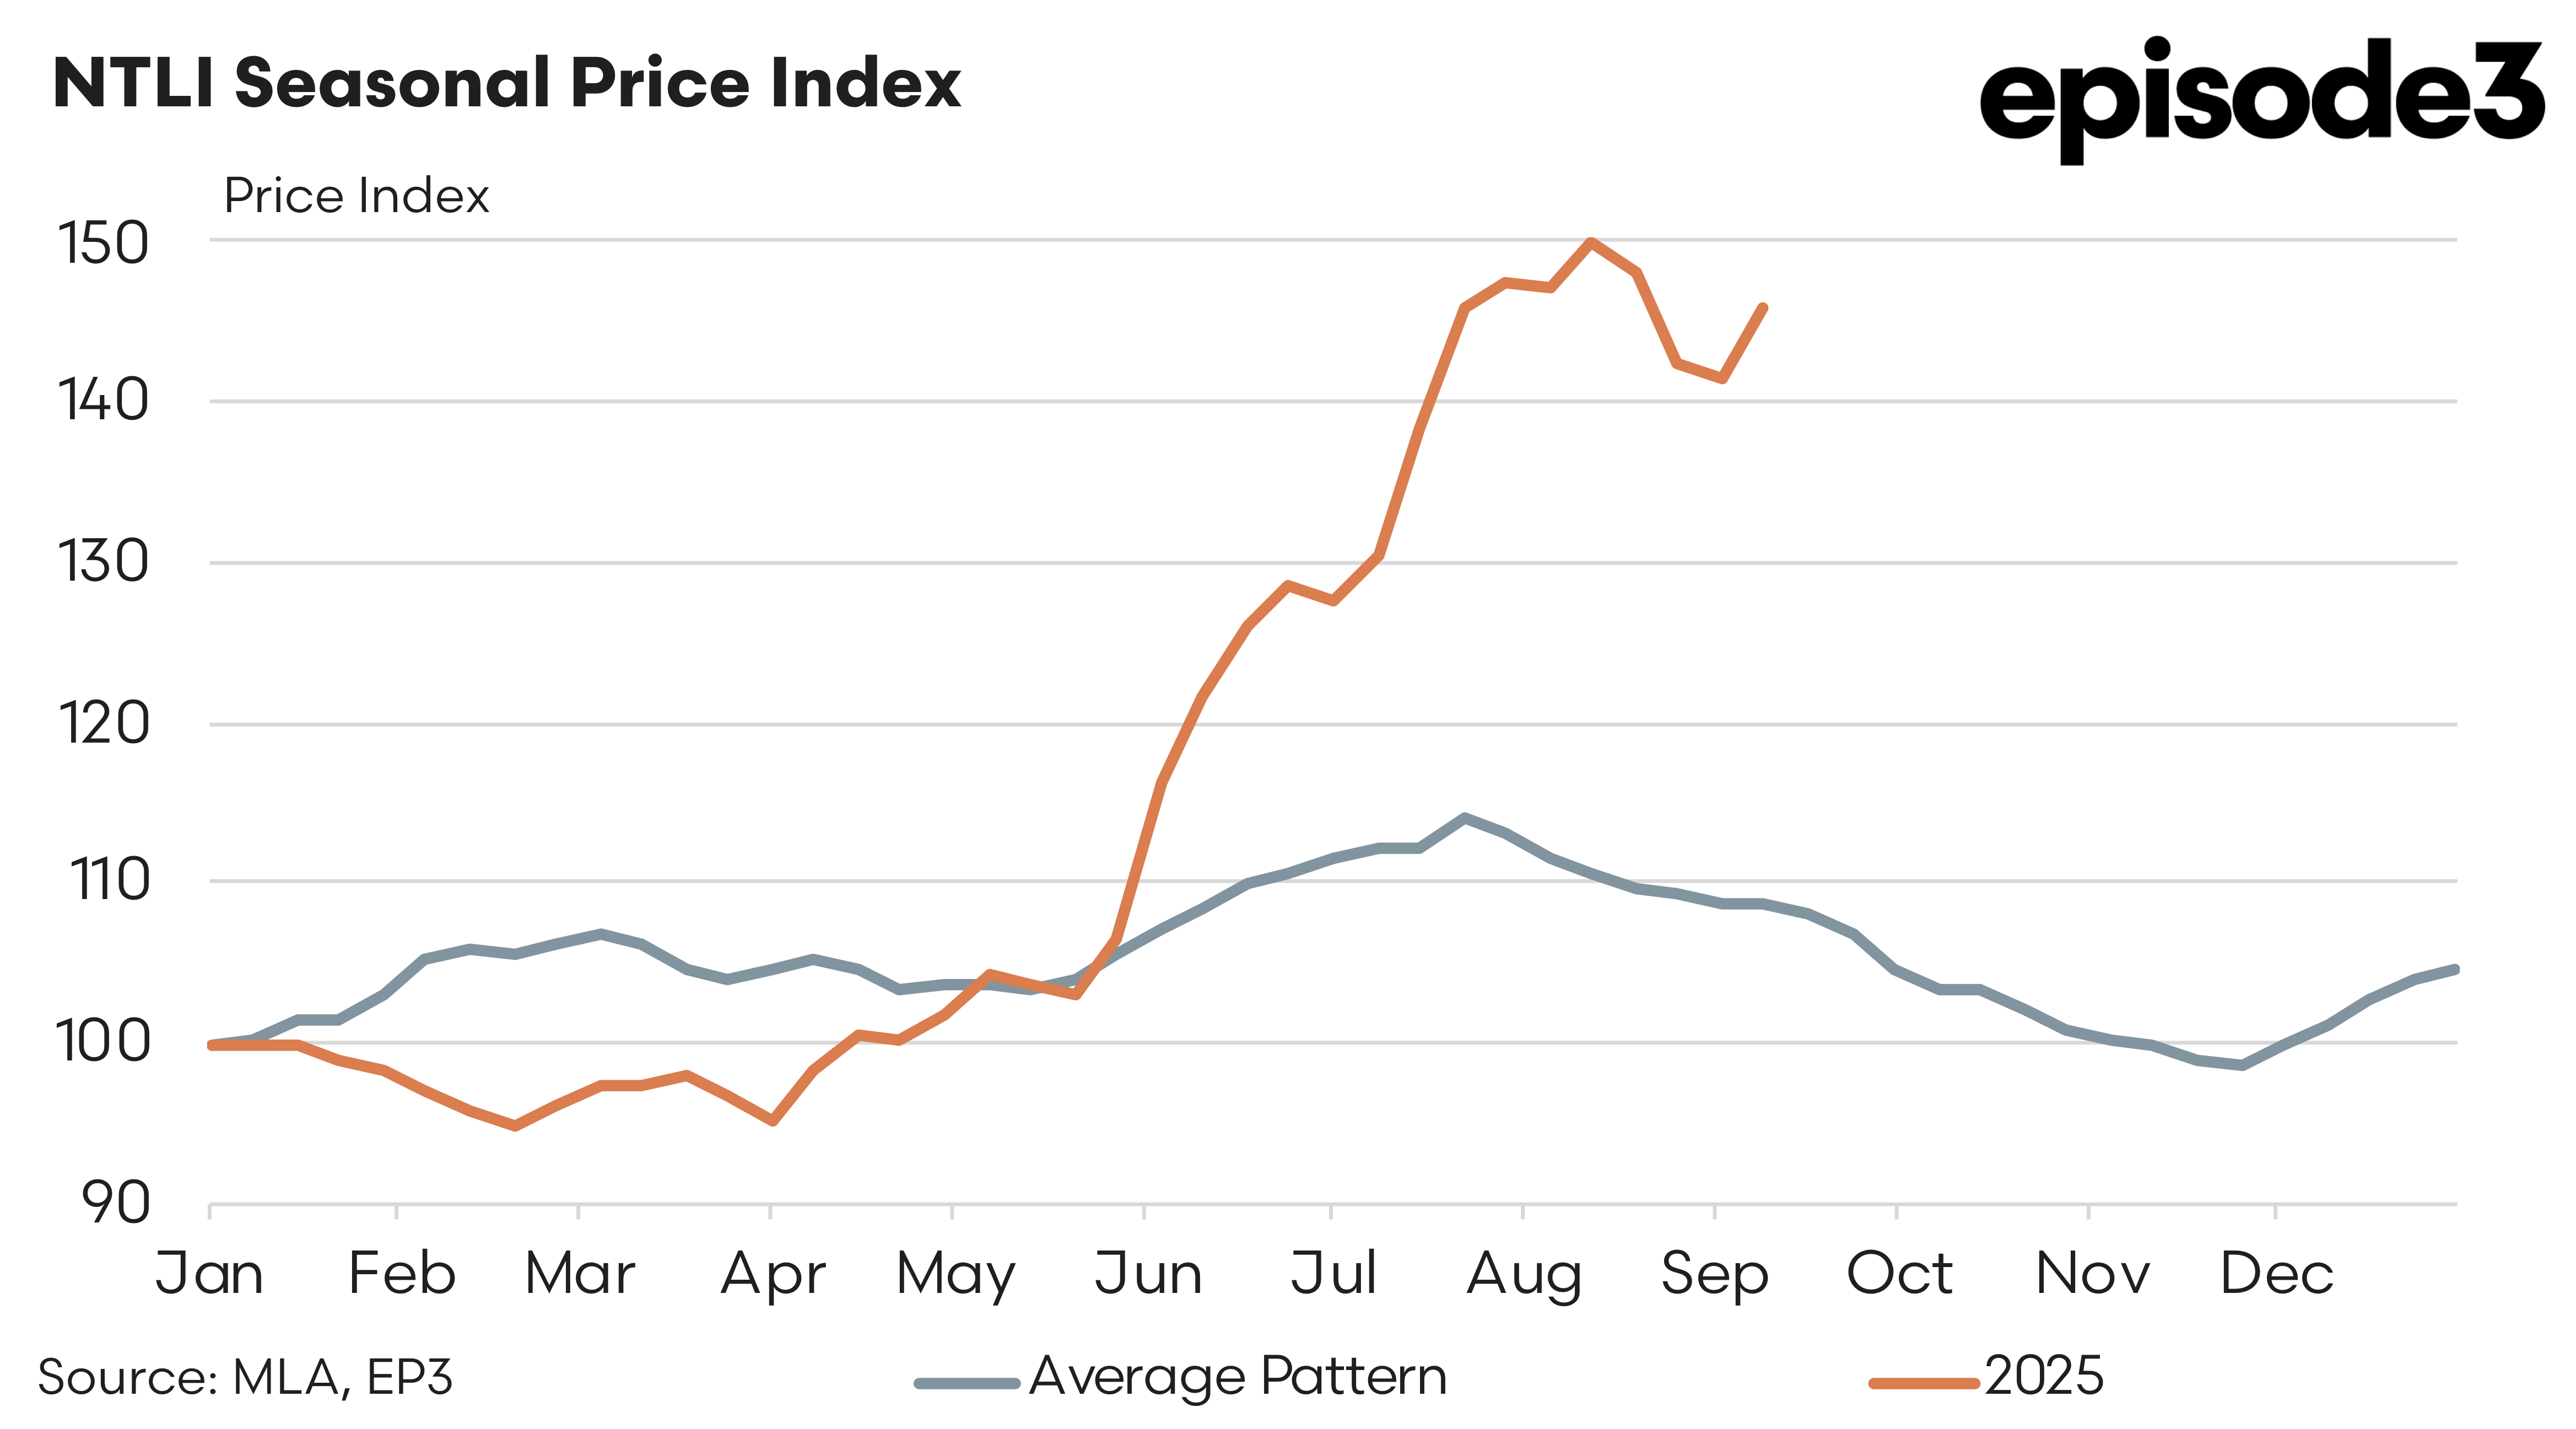
This season there is much anecdotal evidence to suggest the spring flush volumes could be weaker than normal and if this eventuates could mean that the price pressures into November could be weaker. Current price trough estimates from EP3 put the spring low point between 925 to 1010 cents per kilogram cwt for the NTLI indicator.