
Australia Has Hit $100 Billion in Agriculture. What Should the Next Target Be?

The Snapshot
- Australian agriculture has effectively reached the A$100bn production milestone, several years ahead of the 2030 target.
- Much of the growth came from good seasons, higher global commodity prices, and inflation, rather than structural industry change.
- Farm costs have risen sharply, reaching about A$79bn, leaving roughly A$22bn in margin within the farm sector.
- The A$100bn target measures the size of the industry, but not necessarily farmer profitability.
- Future targets should place farmers at the centre, focusing more on margins and value kept on farm rather than just production growth.
Last week, the fireworks and champagne were flowing as Australian agriculture exceeded its A$100 bn target, well ahead of its 2030 target. The question we have is: was it the right target? More importantly, what should the next target be, and how do we put the farmer at the centre of the target?
ABARES now forecasts the gross value of agricultural production will reach around A$101 billion in 2025/26, effectively crossing the long-discussed A$100 billion mark several years ahead of the original 2030 timeframe. This is
The $100 billion agricultural sector served as a simple benchmark for growth. It was an easy number to communicate and to measure. The gross value of agricultural production is published regularly and provides a clear snapshot of the sector’s size in any given year.
Now that the industry is effectively there, the more interesting question is what the next benchmark should look like.
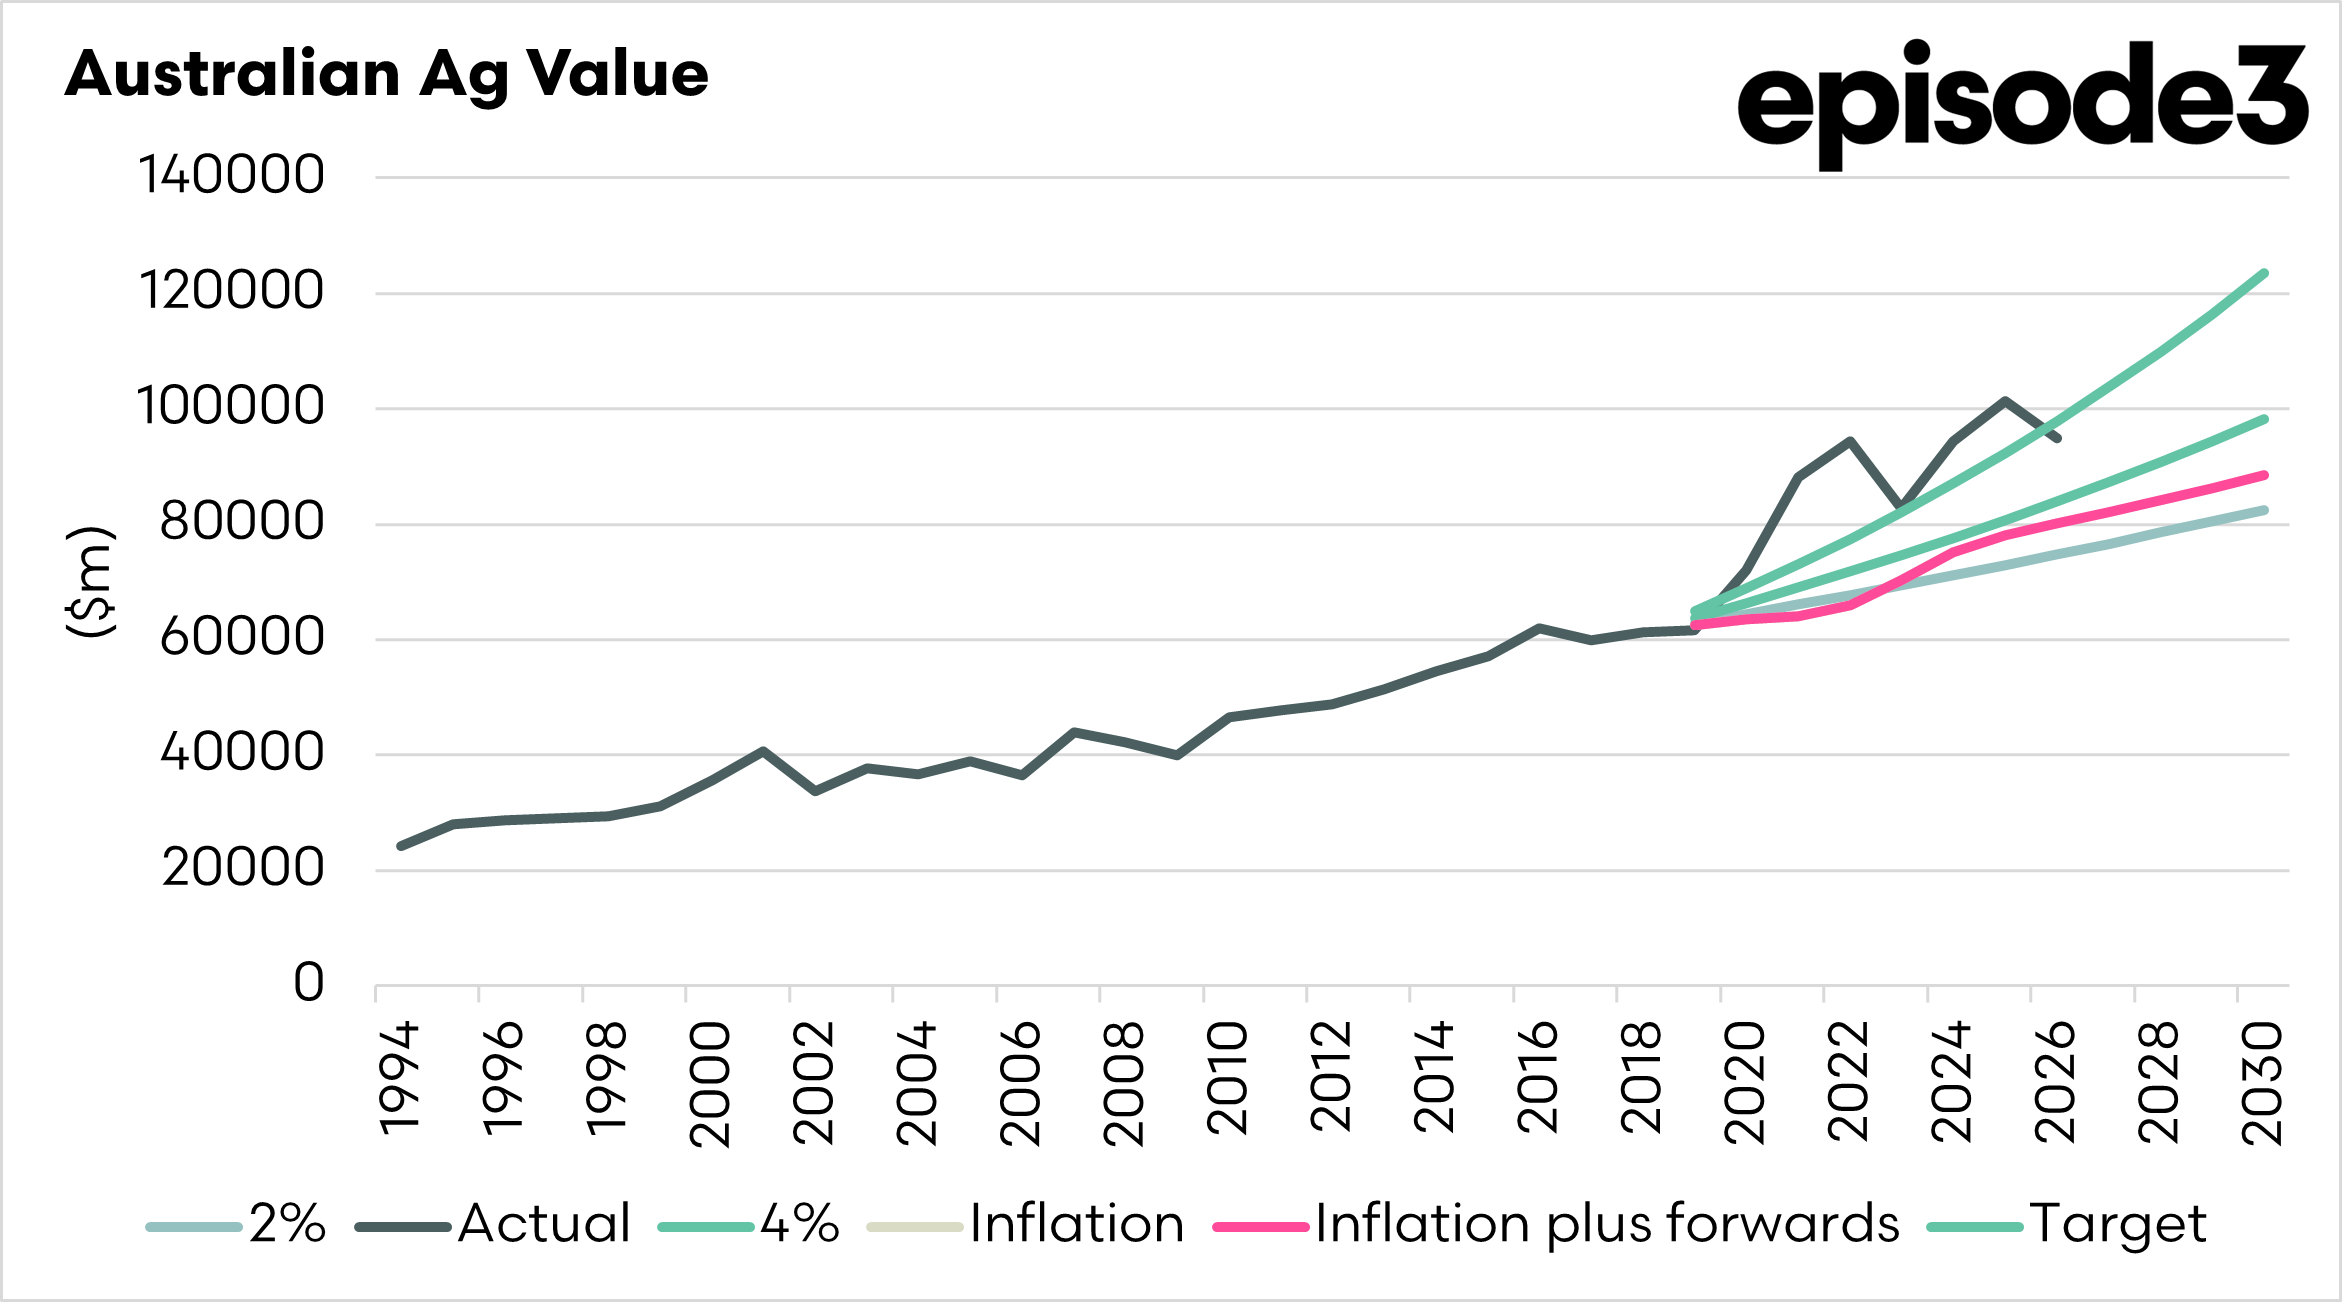
The story behind the A$100bn milestone helps explain why the target has been reached earlier than many expected. When the idea gained traction in the late 2010s, Australia’s agricultural output was sitting at roughly A$60bn. Doubling that figure within a decade sounds ambitious, but the longer-term trend showed we would largely get there based on historical movements.
We can see this in the period prior to the target setting. In the mid-1990s, the gross value of agricultural production sat at around A$24bn. By the early 2000s, it had climbed into the A$35–40bn range. By the mid-2010s, it was approaching A$55bn, and by the late 2010s, it had surpassed A$60bn. Agriculture has been expanding for decades. The target did not create that growth, but it provided a convenient reference point for discussing it.

Several factors then accelerated the rise in production values during the past five years. All of which were factors outwith the control of the government, farmers, and the organisations that represent the industry.
The first was seasonal conditions. Huge chunks of the Australian wheatbelt and pastoral regions experienced exceptionally heavy rainfall during the La Niña years, producing record grain harvests and robust pasture growth. Higher volumes alone pushed production value upward.
The second driver was global commodity prices. Agricultural markets strengthened following major supply disruptions, particularly after Russia’s invasion of Ukraine.
The third factor was inflation across commodity markets more broadly. When prices rise, the value of production rises even if the underlying physical output changes only modestly. A tonne of wheat worth A$350 contributes more to the production total than the same tonne worth A$200.
These factors have driven the gross value of Australian agriculture sharply higher. Production reached A$72bn in 2020/21, jumped to A$88bn in 2021/22, and climbed further to about A$94bn in 2022/23. Even with some easing in prices and seasonal conditions since then, agriculture has gone on to exceed A$100bn.
But while the headline number tells us how large the agricultural sector has become, it tells us far less about its profitability.
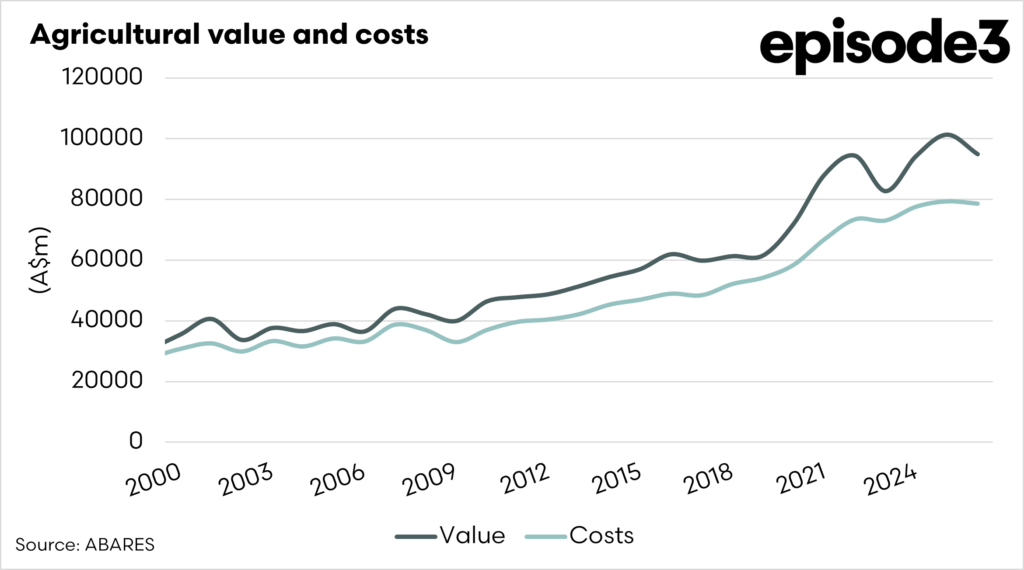

Alongside the rise in production value has been a dramatic increase in farm costs. In the mid-1990s, total farm costs were roughly A$24bn, almost identical to the value of production. As the industry expanded, costs rose steadily as well. By the mid-2000s, they had climbed above A$30bn, and by the mid-2010s, they were approaching A$45bn.
The rise since 2020 has been exceptional and may have more to play out with the current Middle Eastern crisis. Fertiliser prices rose due to the war in Ukraine, interest rates have risen, machinery costs make Ferraris seem cheap, and the cost of labour has gone up (along with pretty much everything else)
Whilst grain prices have retreated, production costs are still elevated, risking future cost-price squeezes. Estimates suggest farm costs could approach A$79bn in 2025/26, showing that a large share of the increase in agricultural production value has been absorbed by rising input costs.
This creates an important distinction between the industry’s size and the returns it generates.

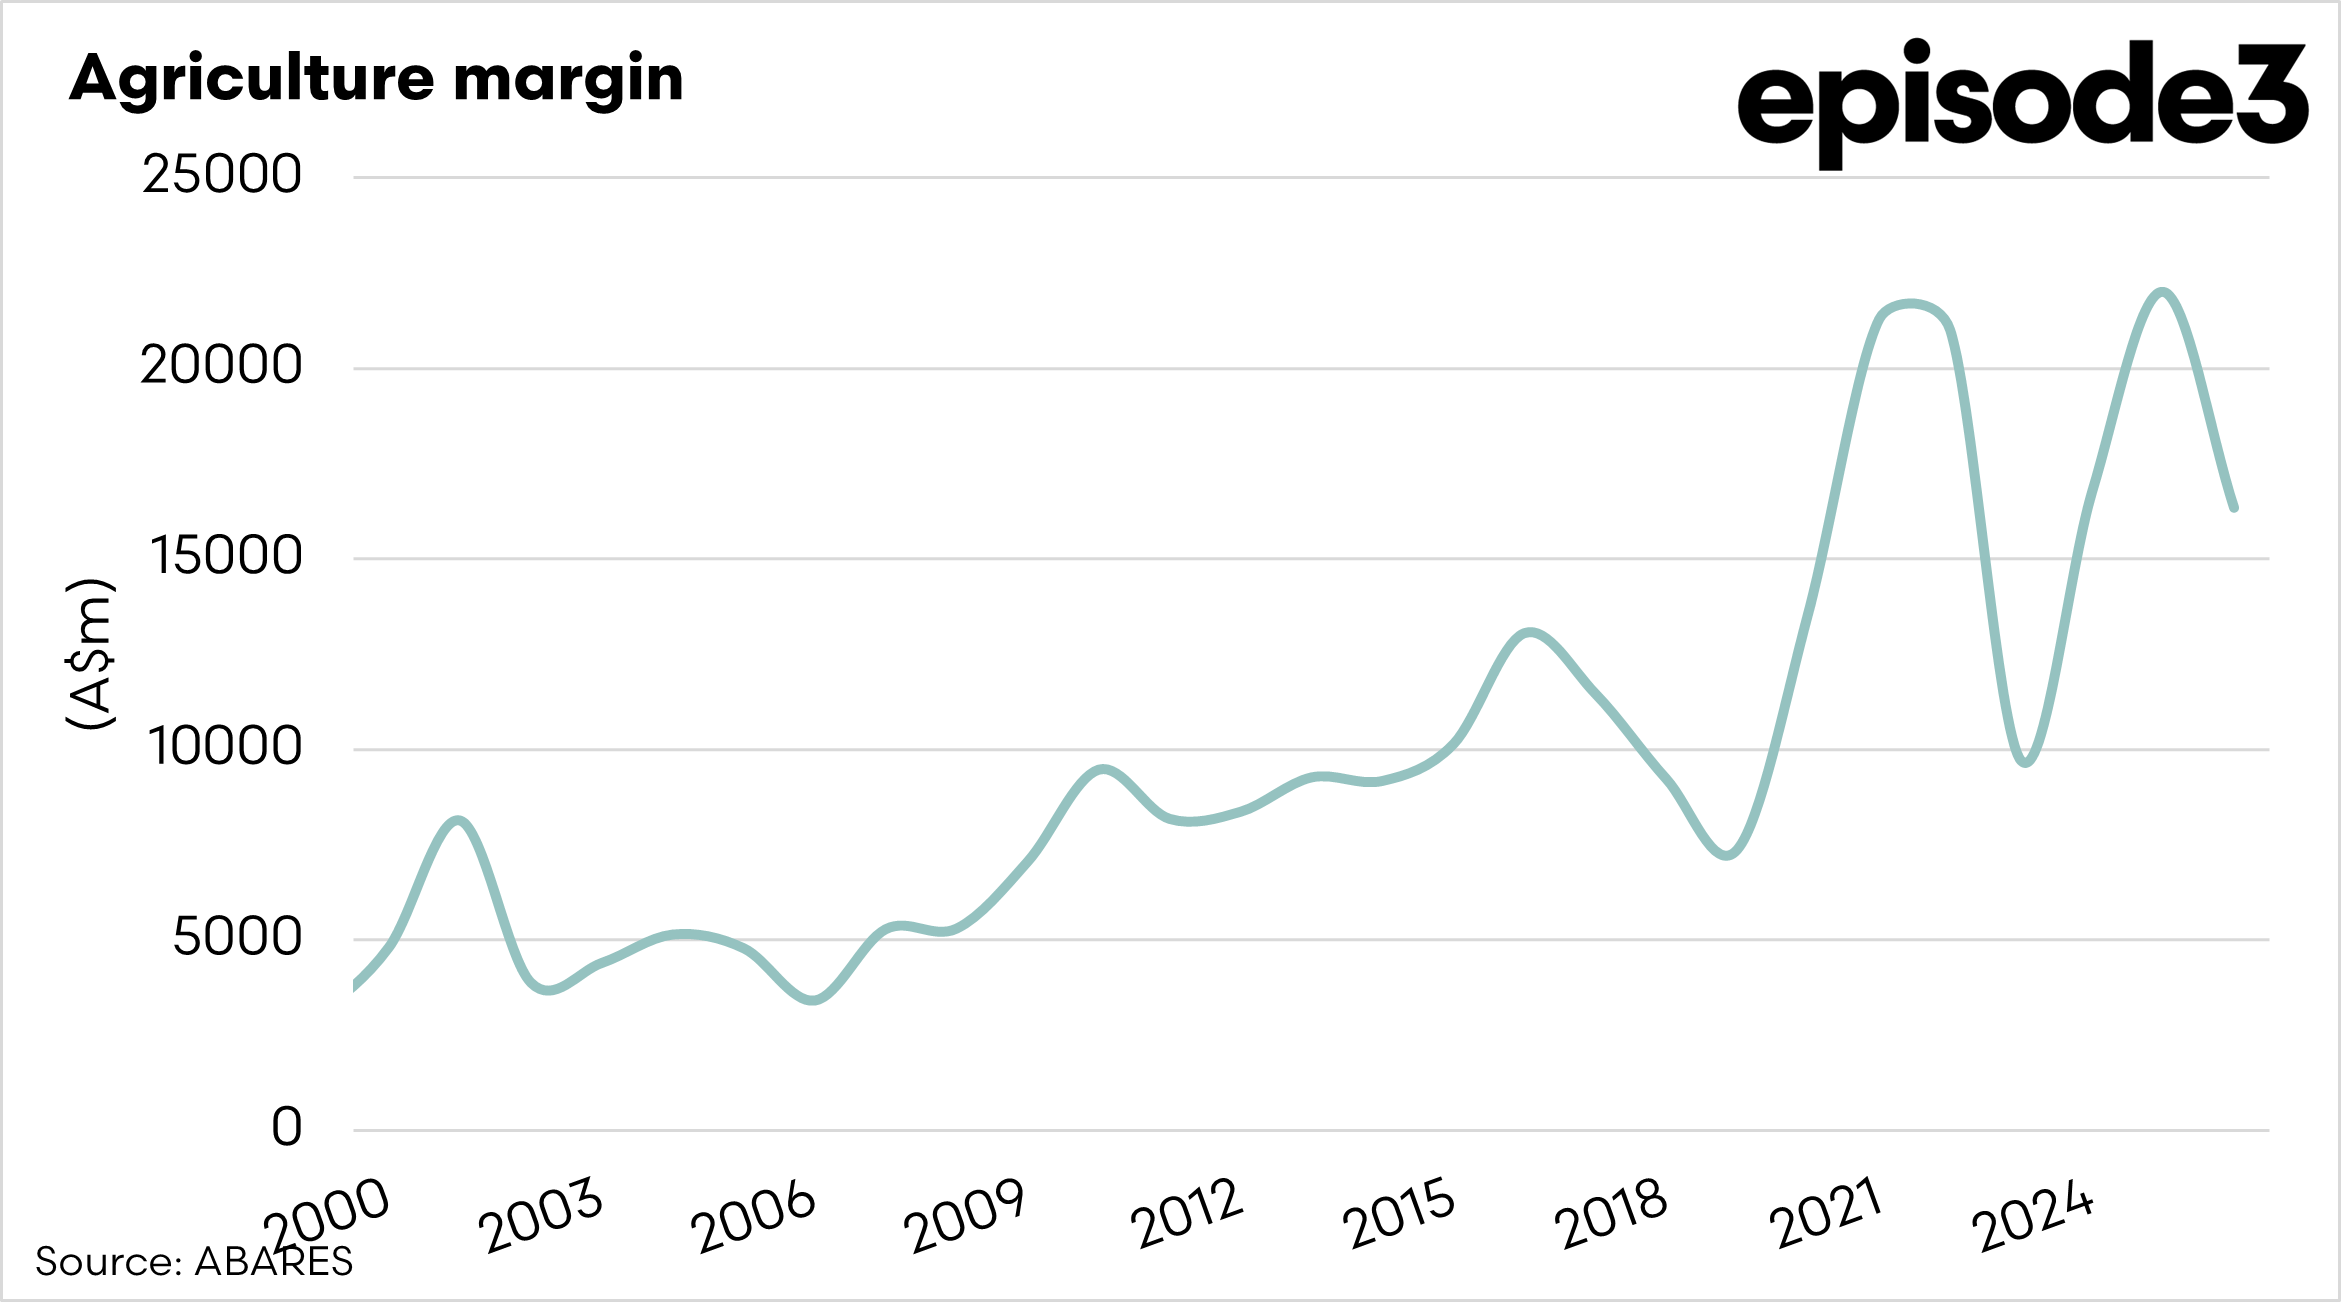
When production reaches A$101bn, but costs sit close to A$79bn, the surplus staying within the farm sector is closer to A$22bn. I’d rather have an A$75bn target, with A$30bn staying in farmers’ bank accounts.
Seen from that perspective, the A$100bn milestone is significant as a measure of scale, but it does not necessarily tell us whether agriculture has become dramatically more profitable.
There is talk of the industry setting another benchmark for the next decade, and whilst last time they went to a Big Four consultancy to develop their plan, I have ruminated on what the target should be, and I have three suggestions for how the industry should measure its success.
Option 1 – $50 Billion Net Farm Margin
This would measure the difference between gross agricultural production and total farm costs.
Based on current estimates:
- Production: A$101bn
- Farm costs: A$79bn
- Net margin: A$22bn
A future target could be A$50bn in net farm margin by the end of the decade, which would be ambitious and also reflect farmers’ financial health.
The advantage of this measure is that it focuses directly on profitability. It reflects the money left in the farm sector after costs are paid, providing a clearer picture of the industry’s economic health. The drawback is that some may think the target is falling from A$100bn, so they would require an explanation to those not paying attention.
Option 2 – Farmers Retain 30% of Production Value
This option focuses on the share of agricultural value that stays with farmers after costs are paid. Rather than measuring the sector’s total dollar margin, it measures how much of every dollar generated by agriculture stays on the farm.
Unlike Option 1, which measures the total margin in dollars across the farm sector, this approach measures the proportion of industry value that farmers keep. Based on current estimates, farmers keep around 20% of the total production value after costs. A future target could aim to lift that share to 30%.
The advantage of this approach is that it focuses on value capture within the agricultural system, encouraging improvements in productivity, cost control and supply chain efficiency. The drawback is that the percentage can move from year to year as commodity prices and input costs fluctuate. While it may offer a clearer view of industry health, “30% of production value” is also less intuitive and frankly less sexy for a press release.
Option 3 – $150 Billion Production Target
This would be the natural successor to the $100bn production target.
The advantage of this approach is that it is simple, easy to communicate and straightforward to measure each year. The drawback is that production costs can rise due to inflation, exchange rates, or commodity price cycles, meaning the headline number can grow even if underlying farm profitability does not improve.
This production target carries the same limitation as the A$100bn goal. It measures the size of the sector but says little about its health. It also ignores the cost of farming, which has become one of the most important issues facing producers.
Australian agriculture will likely continue to grow in scale in the years ahead, as it has done over recent decades. The question is whether future benchmarks should focus purely on the size of the industry or on the economic strength of the farms that underpin it.
The A$100 billion milestone shows how large Australian agriculture has become, but it was always a measure of the industry rather than the financial health of the farmers within it. Gross production captures the total activity across the agricultural system, but it does not tell us whether farmers themselves are becoming more profitable.
As the industry begins to think about the next benchmark, the focus should shift. The next target should place farmers firmly at the centre, recognising that a successful agricultural sector is ultimately defined not just by how much it produces, but by whether the people producing it are financially stronger as a result. We need to focus more on margins than on productivity.