Middle Eastern Crisis – Live Updates – WC 6th April 2026

Live Markets Feed
The EP3 team is tracking developments as the fuel and fertiliser situation continues to evolve across Australia.
Markets are shifting quickly, and writing longer form articles is harder than ever, due to the likelihood of change by the time we hit publish. We have decided to open a live feed whilst the middle eastern crisis evolves.
This live feed is your central point for real-time updates on supply, pricing and market risk.
If you have any questions which you would like us to cover, or any content that you want us to share on this blog, send us an email info@episode3.net
If you want to continue supporting our work, click here to subscribe
8th April 2026 1339 AEST
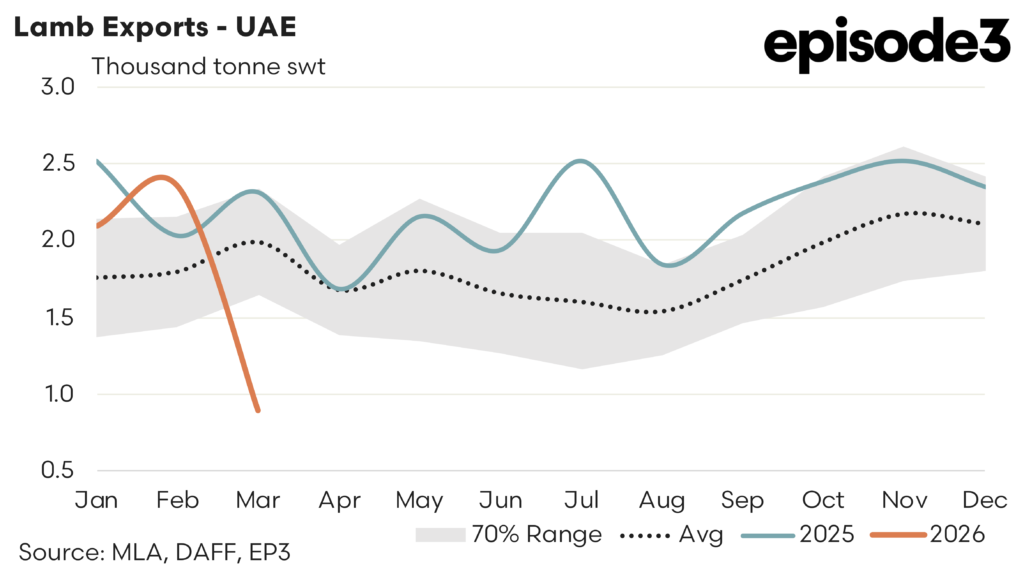
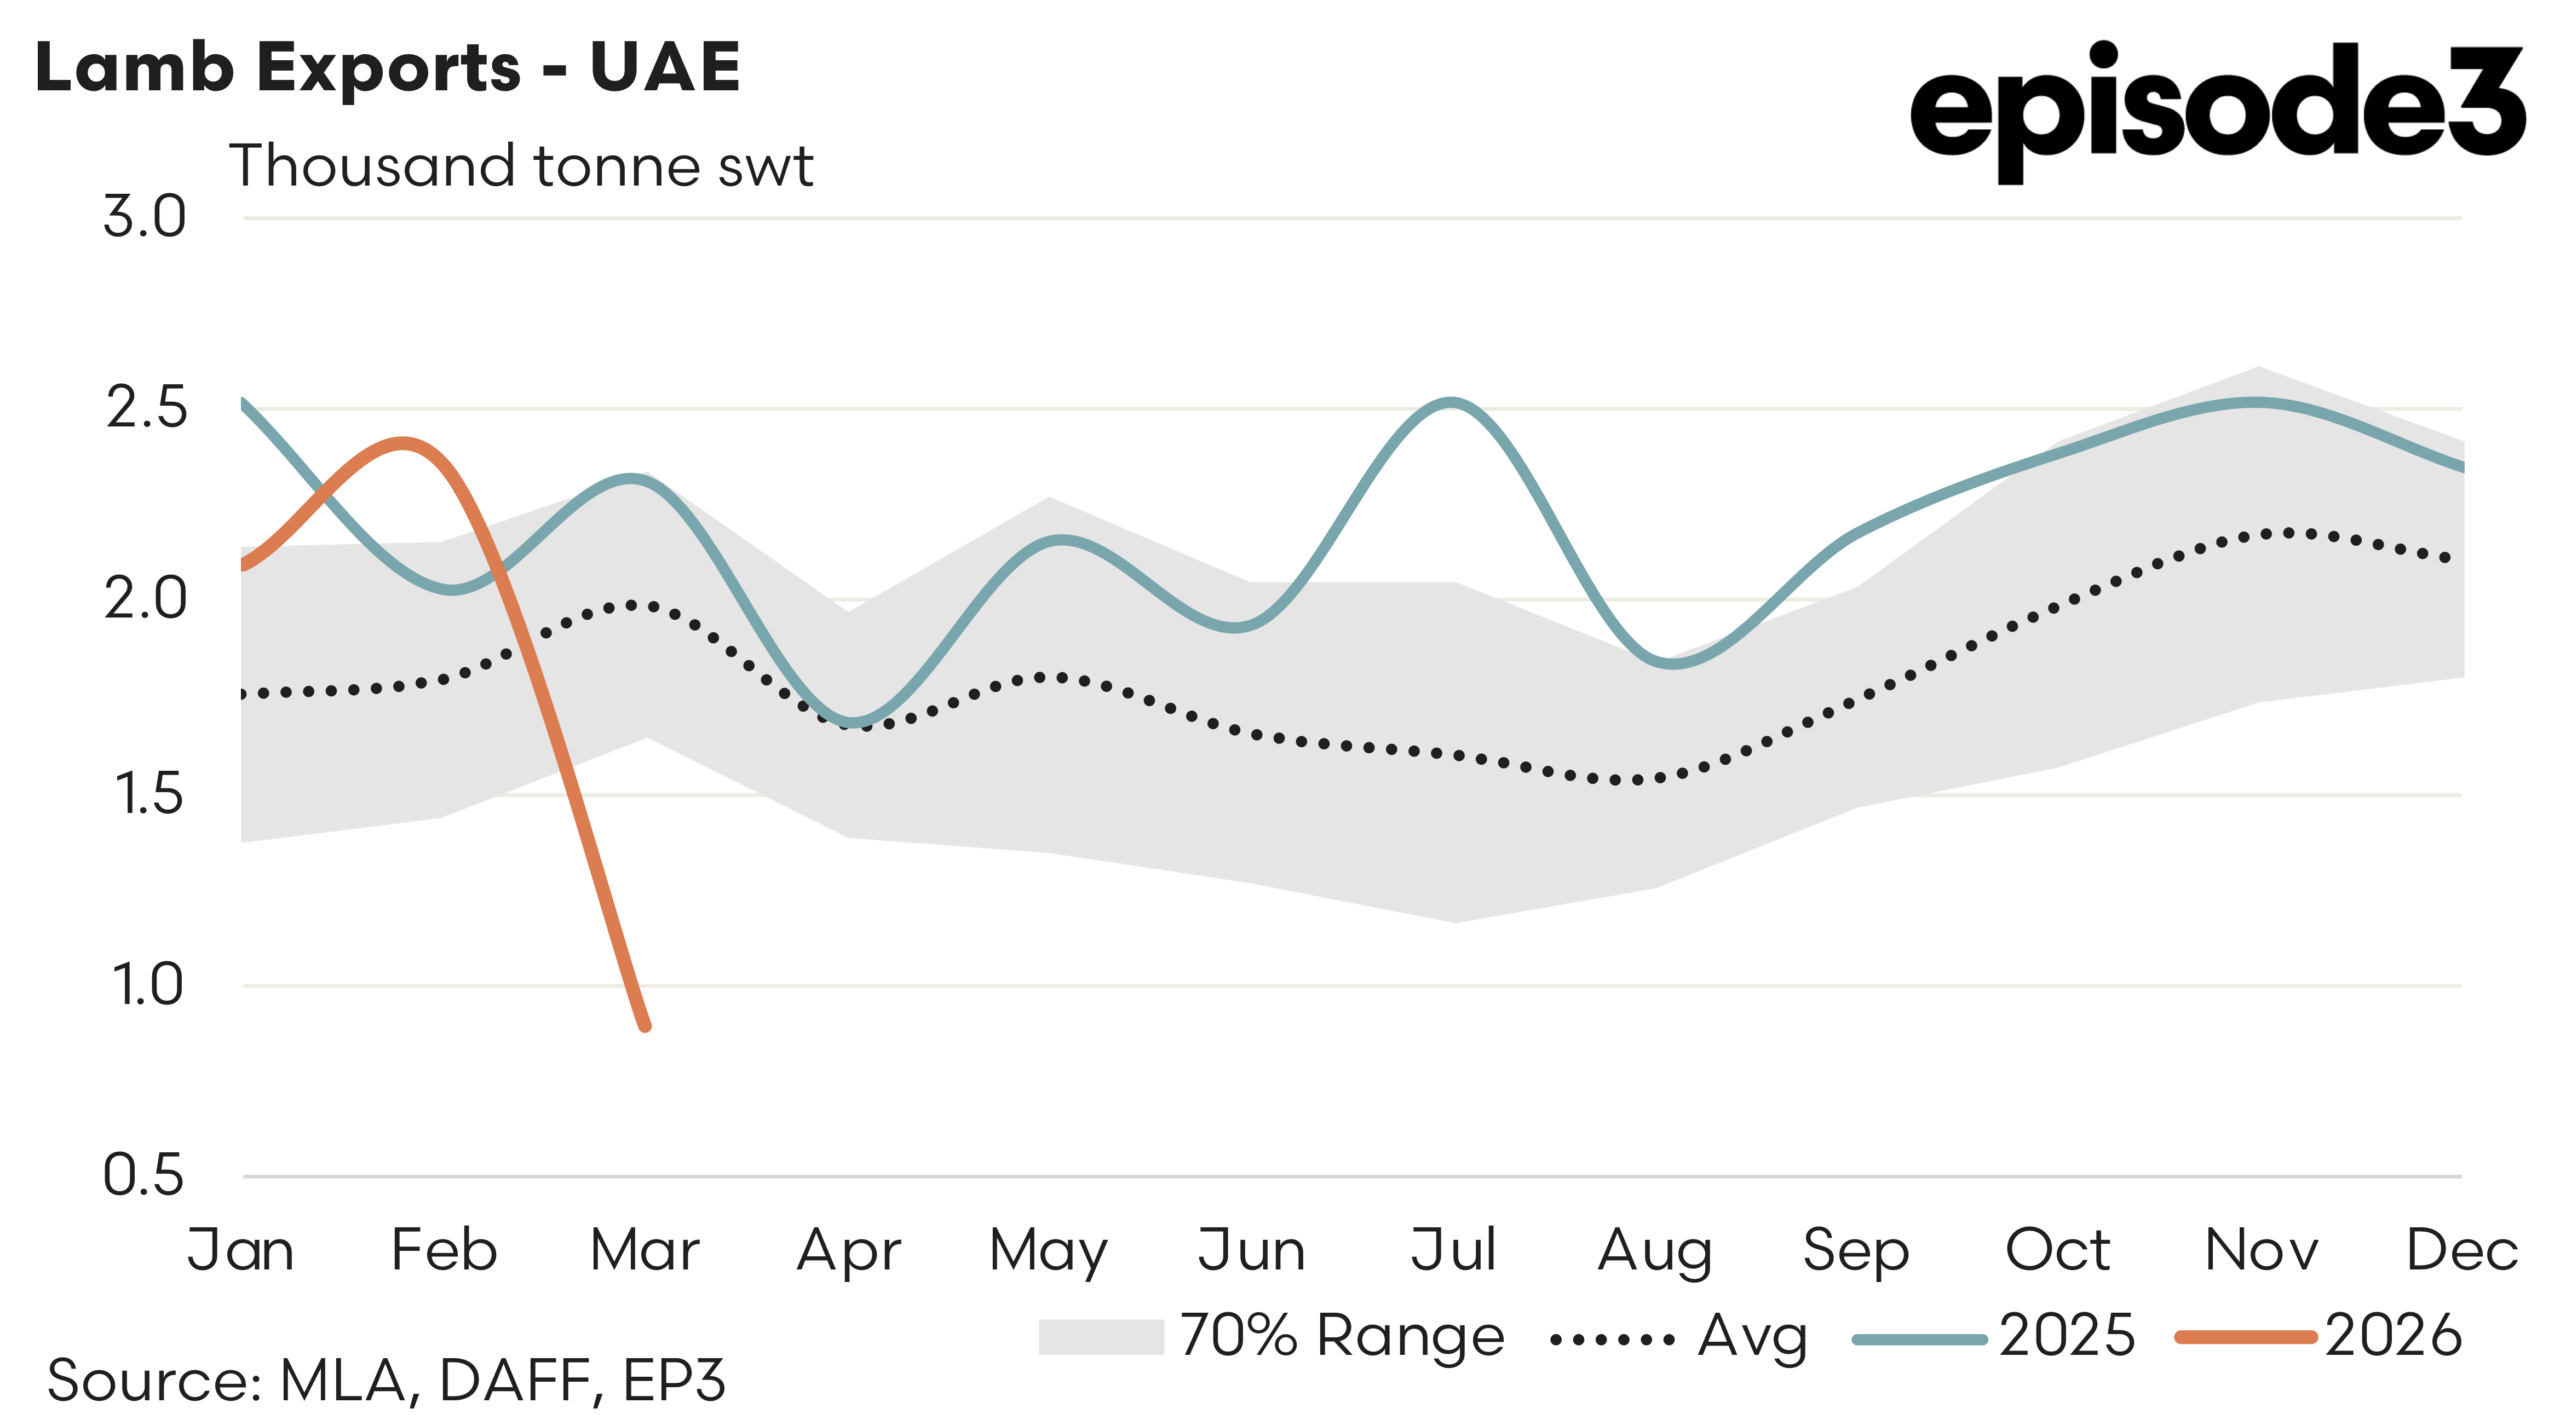
Lamb export flows to the United Arab Emirates drop significantly during March 2026 as access is curtailed. There was a two month dip in 2021 to these levels but realistically we haven’t seen flows this low on a consistent basis in over 15 years. Lamb to UAE is 55% under the five-year average for March. Mutton to the UAE is down 25% on the five-year average for March
Lamb flows to Qatar down 55% on the five-year average for March
Lamb flows to Jordan 44% under the five year average for March
No lamb flows to Bahrain
Mutton to Kuwait 25% under the five year average
Mutton the Saudi Arabia 49% below the five-year average
Mutton to Oman 87% below the five year average
8th April 2026 1226 AEST
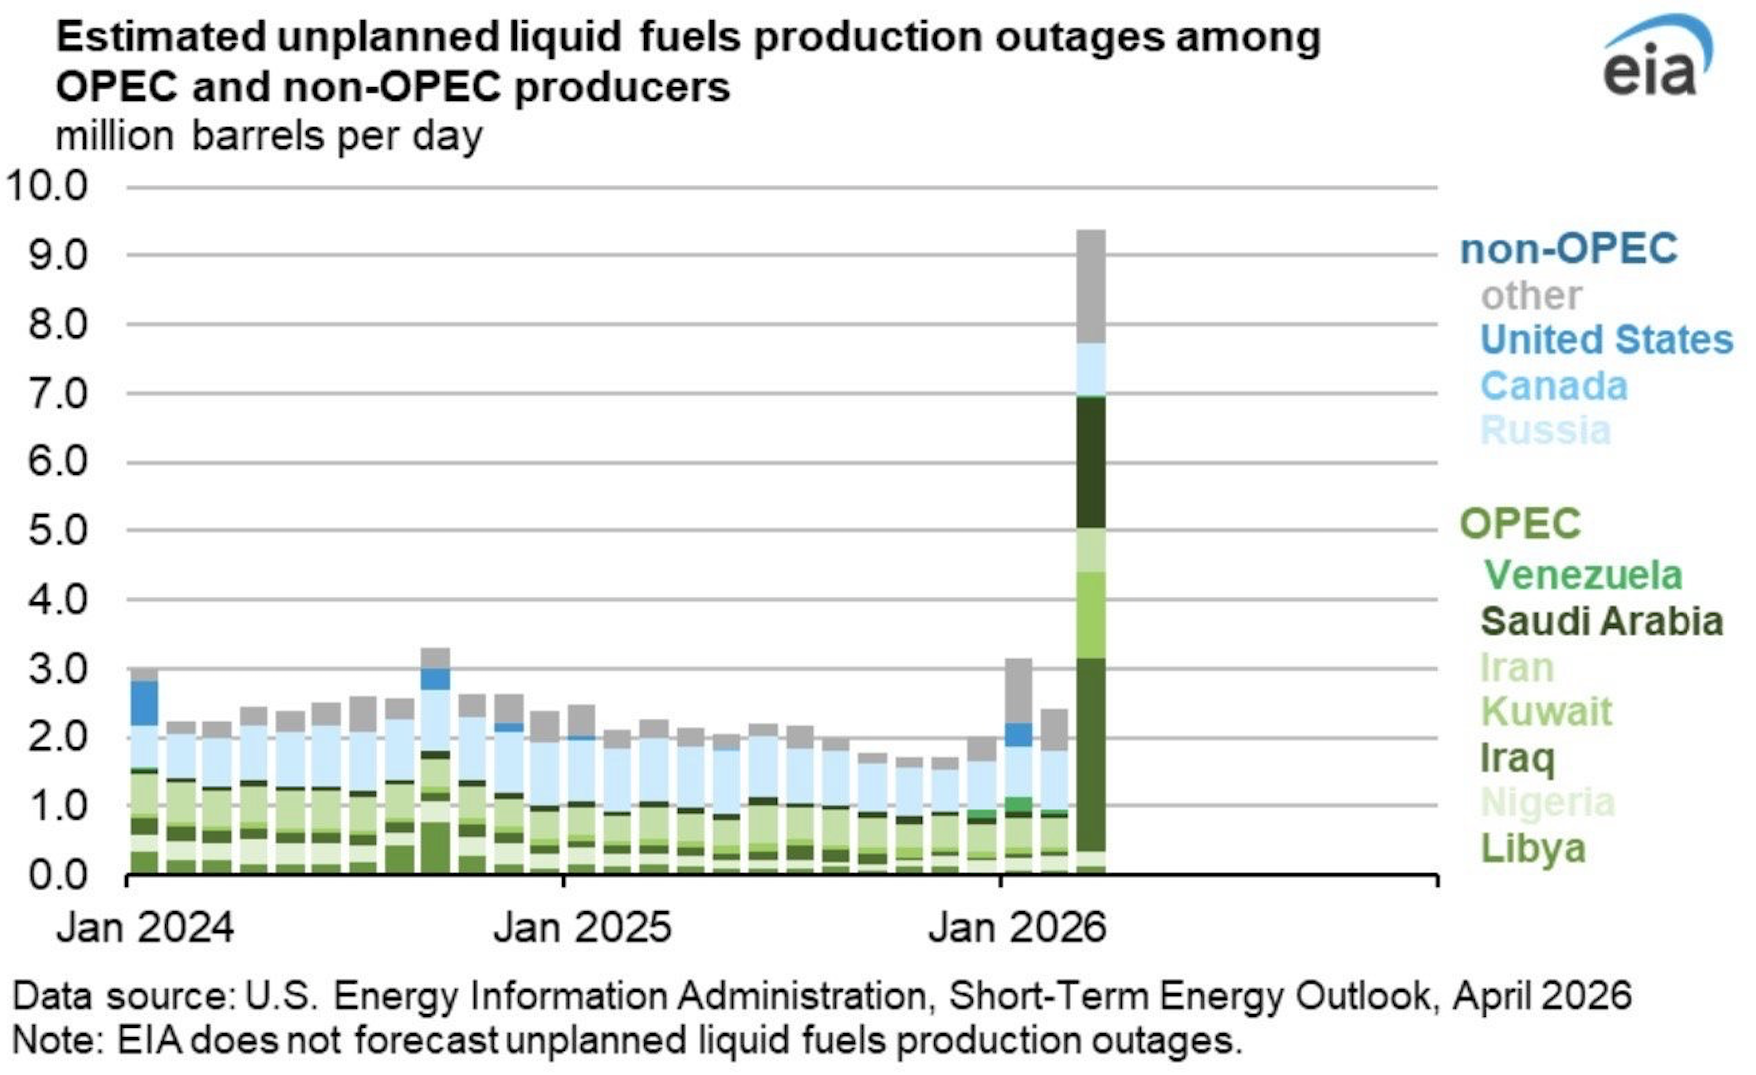
Some interesting analysis from social media today.
The first item shows the huge rise in unplanned liquid fuel production outages, showing the huge lift in outages during March 2026 particularly in key MENA suppliers to Asia.
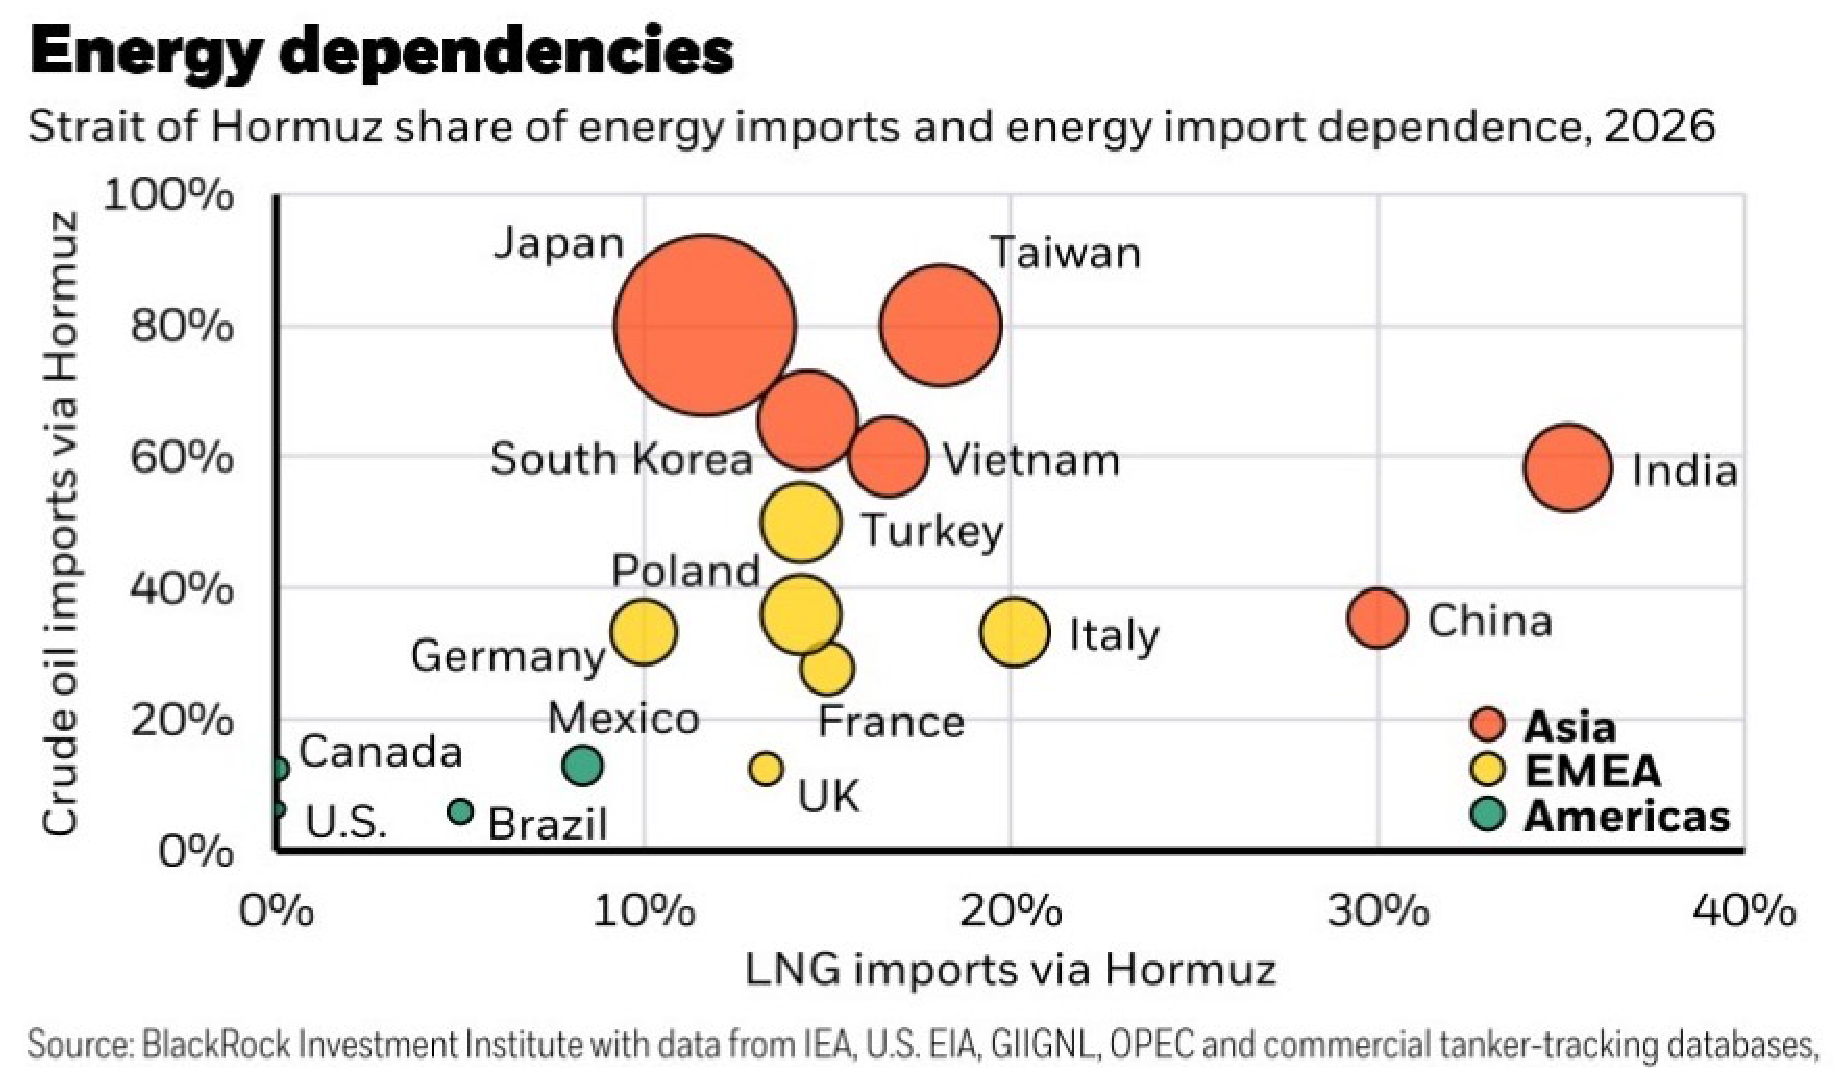
The second chart shows the huge reliance on crude oil and LNG imports into key Asian refinery centres, of which Australia rely on for petrol, diesel and aviation fuels.


8th April 2026 1125 AEST
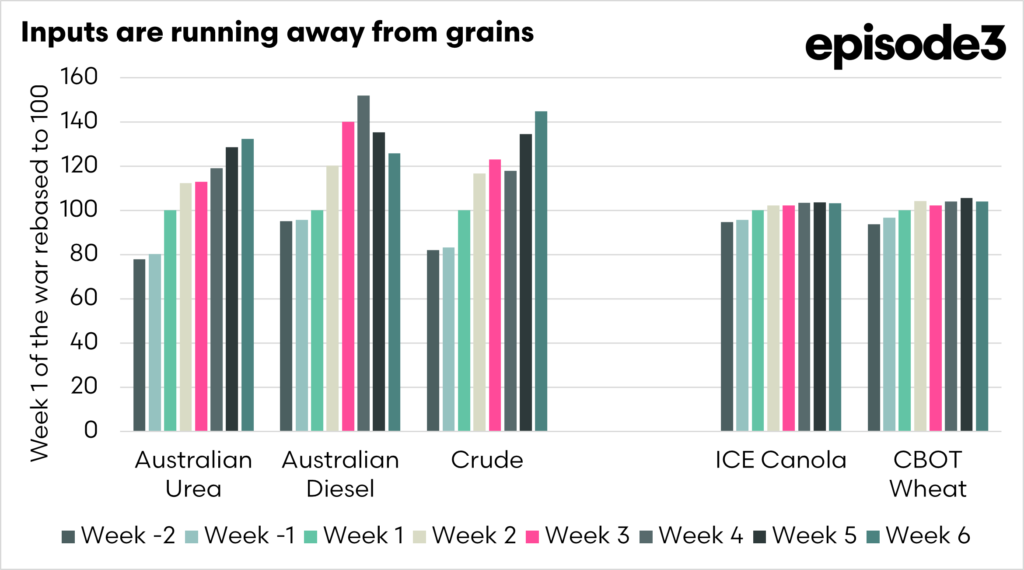
These are indexed from the week of the invasion, with two weeks prior, until today. Grains barely lifted. Inputs rocketed.
Percentage change from week 1 of conflict
- Wheat +4%
- Canola +3%
- Diesel +26%
- Urea +32%
Percentage change from two weeks priod to conflict
- Wheat +11%
- Canola +9%
- Diesel +32%
- Urea +70%

8th April 2026
US President Donald Trump says he has agreed to a two-week pause in bombing operations against Iran, conditional on the immediate reopening of the Strait of Hormuz.
Pakistan’s Prime Minister Shehbaz Sharif has urged the US to extend that deadline by a further two weeks, with the White House confirming that Donald Trump is aware of the proposal.
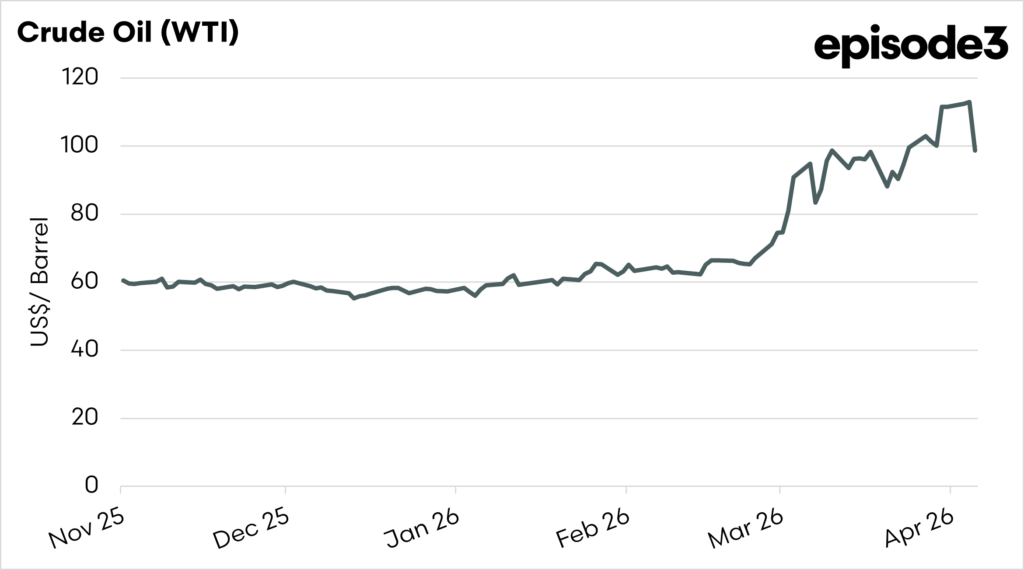
Crude oil falls 14% on new ceasefire agreement. The situation may remain volatile, with Israel reporting launches against them from Iran.
8th April 0900 AEST
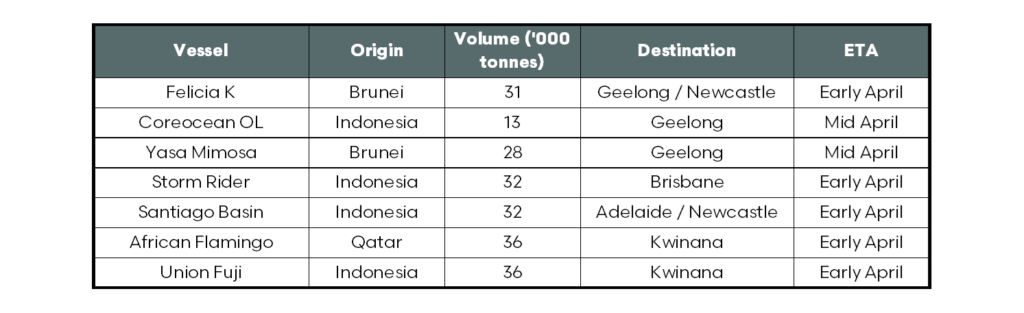
While this is a still a prototype, these are some of the fertiliser vessels which we believe are heading to Australia for April. We will be looking to develop this further, so that vessel tracking is possible, both for the current crisis and for the future.
8th April 2026 - 0826 AEST
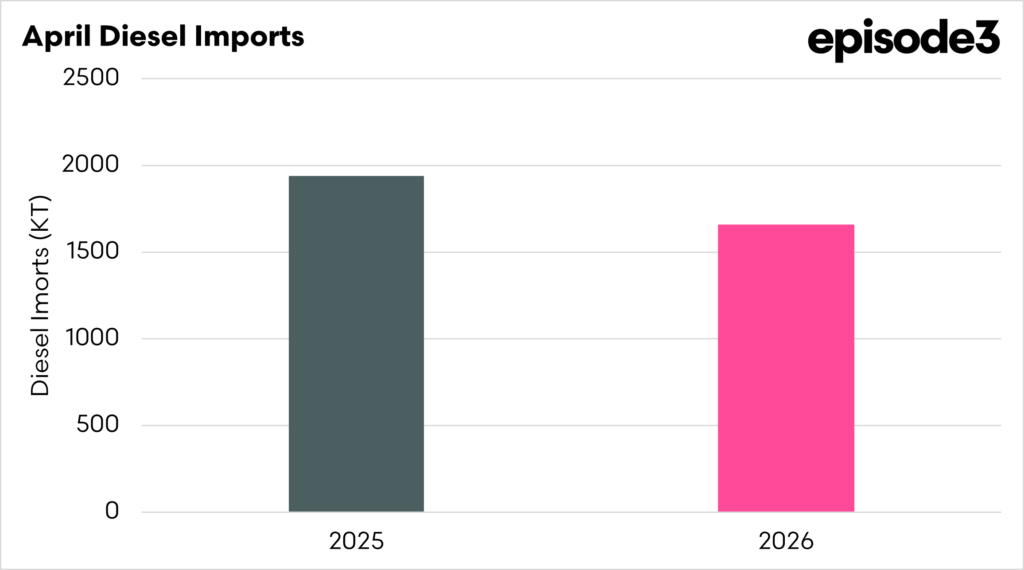
This morning, another vessel has been added to the line up, this brings the volume of diesel due to arrive during april to 1715kt, on 40 vessels. This equates to 88% of last years full april imports.
NB this is not the final april volume, more vessels will be added.

7th April 2026 - 1520 AEST
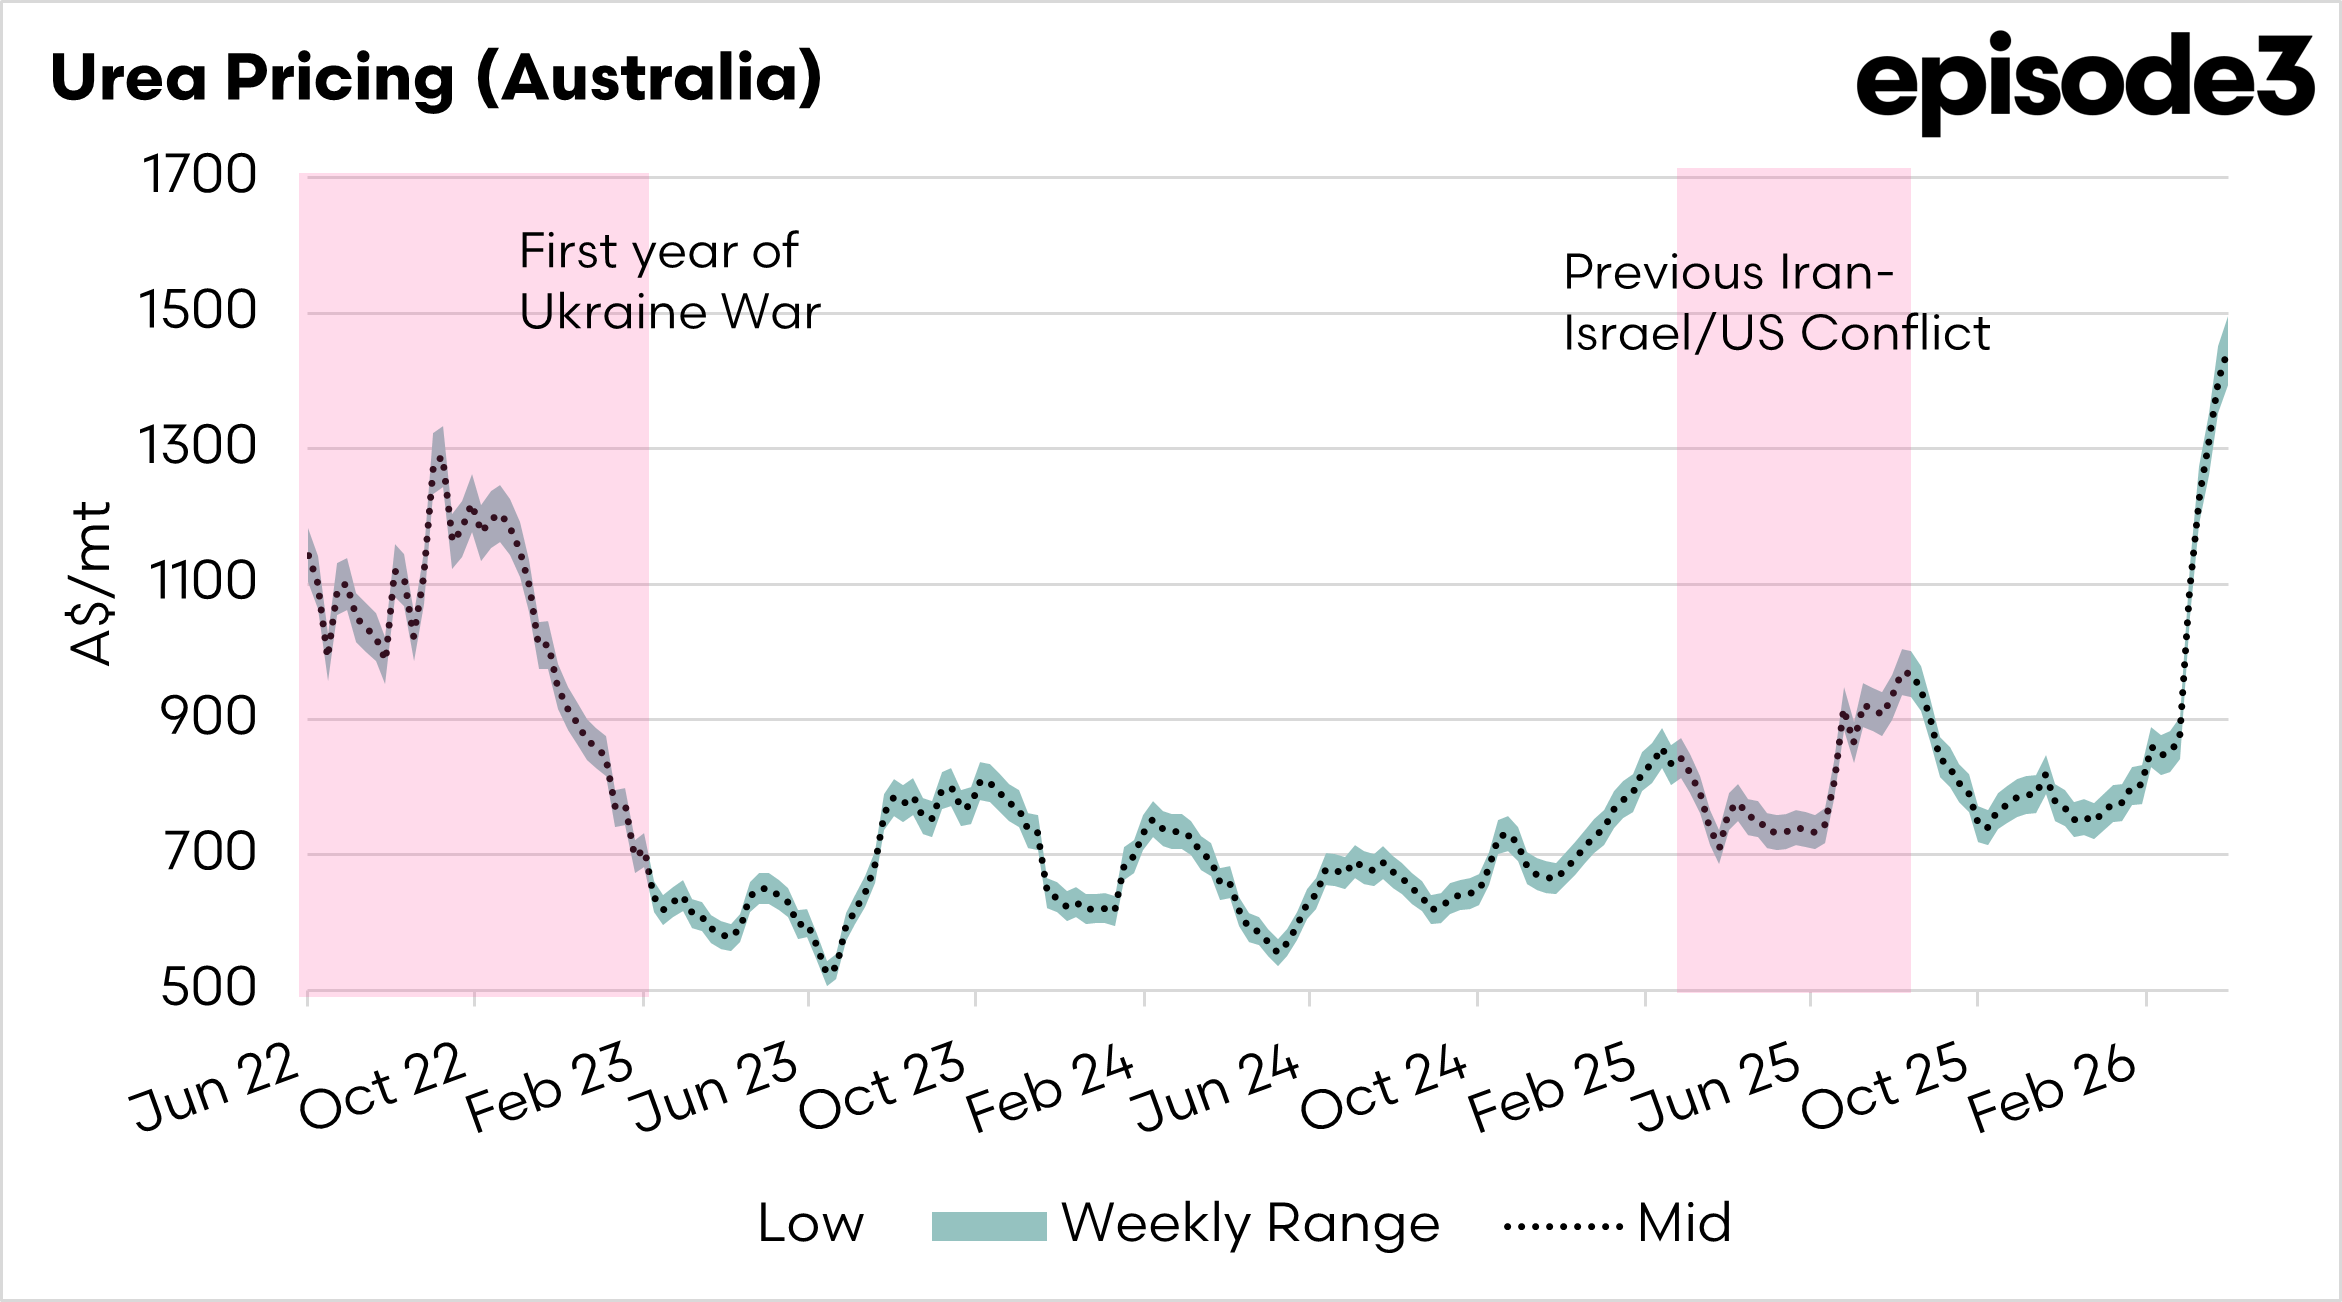
Episode 3 has, for the past six years, provided transparent information on the Australian fertiliser market. One of the key items we publish is our landed Australia urea pricing. This indicates the cost of getting urea to Australia, it does not include margins.
The chart below is updated as of this morning. The landed model shows urea at between A$1445 and A$1495, far exceeding the values during the urea peak pricing period in the first year of the Russian invasion of Ukraine.

7th April 2026 - 1502 AEST
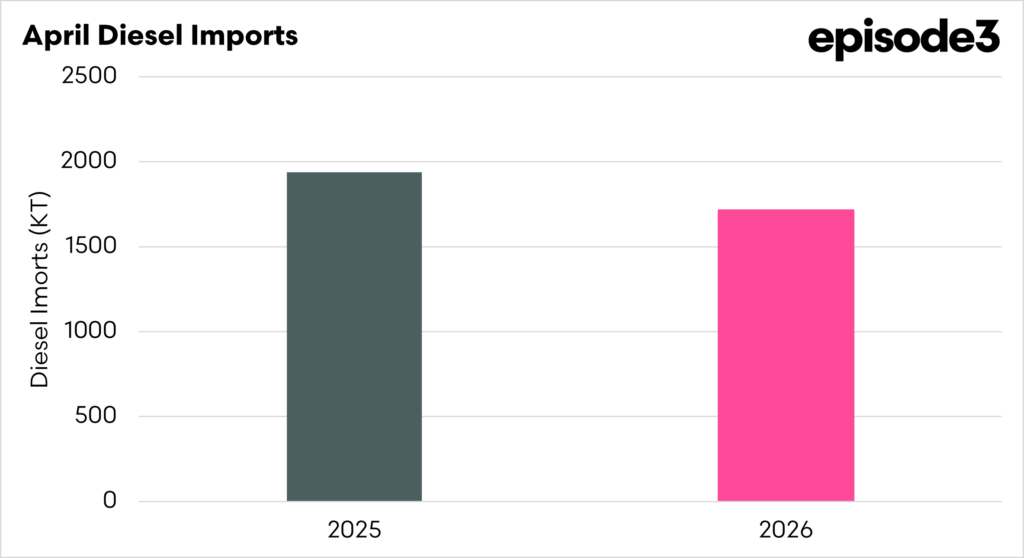
This chart compares last year’s April diesel import volumes with the vessels due to arrive in Australia during April. The vessel numbers will change, and more volume will be added as we move through the month.
At present, there are 1654kt on 39 vessels, which equates to 85% of last year’s volumes. At this pace, last year’s import volumes should be easily beaten.

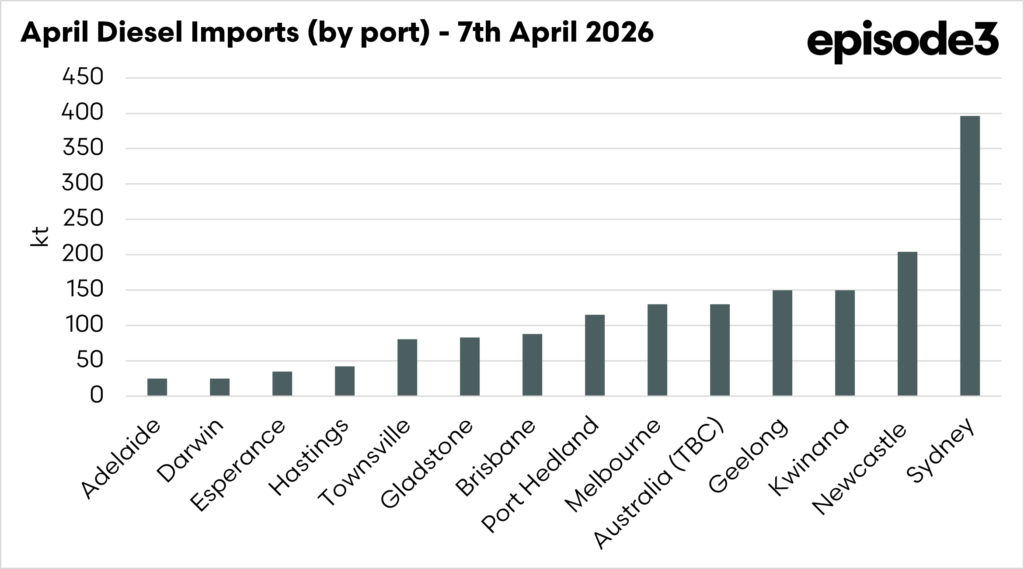
7th April 2026 - 1425 AEST
This chart shows the vessels currently en route to Australia with diesel, on a port-by-port basis.
Sydney dominates discharge volumes at 24% (396kt), well ahead of Newcastle at 12%, with the east coast collectively accounting for a significant share of arrivals.
Beyond that, volumes are relatively fragmented, with most ports handling between 2–9%, highlighting a broadly distributed supply chain across Australia.