
More Risk, Less Margin: Why El Niño Matters This Season more than ever.

The Snapshot
- More than a century of data shows El Niño consistently shifts yields lower.
- Nationally, yields fall around 15pc versus surrounding seasons.
- The downside risk varies materially by region, with NSW and QLD most exposed.
- In NSW, half of El Niño years fall more than 20pc below expectation, while WA sits closer to 29pc.
- In a tight margin year, that shift in risk matters.
Mike Tyson famously said, “Everyone has a plan until they get punched in the mouth”, and for many farmers this year, they may think that expression was aimed at them.
The risk of farming is starting to rise. Input costs are extremely high, fertiliser is in short supply, grain prices are flat, and now an El Niño is forecast. This creates a situation where margins are at risk.
The question is not whether El Niño matters, but how much it shifts the odds and where that risk is most concentrated. To answer that, we went back through more than a century of Australian wheat data, using production records dating back to before Federation and comparing each El Niño year with the seasons in the same era.
This approach removes the long-term trend in yields and isolates the seasonal signal, allowing for a clearer view of how crops perform relative to the conditions at the time rather than against a different technological era. The result is consistent and difficult to ignore.
In El Niño years, Australian wheat yields are typically around 15pc lower than surrounding seasons, but focusing on the average alone misses the real story. What matters is the distribution of outcomes and how the risk balance shifts. Where you are in the country matters.
Across the dataset, more than half of El Niño years finish at least 10pc below expectation, 36.8pc fall more than 20pc short, and 23.7pc drop by 30pc or more. This is not a marginal change; it is a clear shift in the likelihood of underperformance, particularly at the lower end of the distribution.
However, the national result only tells part of the story. When the data is broken down by state, the differences become far more pronounced, and the uneven nature of El Niño risk becomes clear.
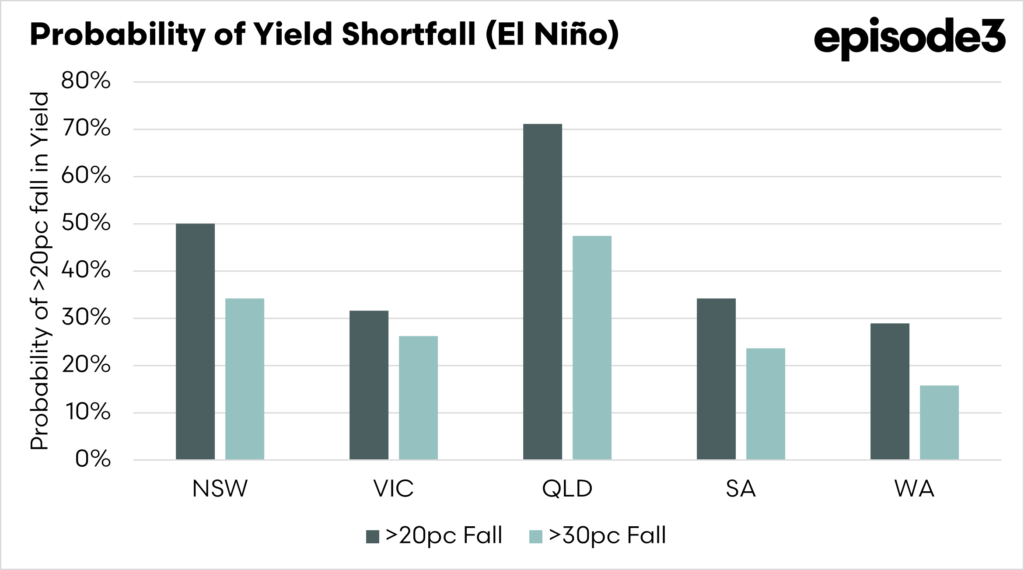

New South Wales carries the greatest exposure among the major wheat-producing states. In El Niño years, 50pc of seasons fall more than 20pc below expectation and 34.2pc drop more than 30pc, leaving a distribution that is heavily skewed to the downside. Good years still occur, but poor outcomes are far more common.
Victoria and South Australia sit in the middle. In both states, around one-third of El Niño years fall more than 20pc below expectation, at 31.6pc and 34.2pc respectively, while severe outcomes occur less often than in New South Wales but remain a consistent feature of the distribution.
Western Australia presents a different profile. While El Niño still increases risk, the magnitude is smaller, with 28.9pc of seasons falling more than 20pc below expectation and only 15.8pc falling more than 30pc. The distribution is more balanced, with fewer extreme downside outcomes.
Queensland produces the most extreme results, with 71.1pc of El Niño years falling more than 20pc below expectation and 47.4pc dropping more than 30pc. These results highlight significant downside risk, although they should be interpreted with caution given the smaller production base and higher volatility.
The key takeaway is not that El Niño guarantees a poor season, because it does not. In every state, there are years when yields hold up or even exceed those of surrounding seasons.
What changes is the balance of outcomes.
The upside is still possible, but the downside becomes more likely and, in some regions, significantly more severe. This distinction is critical, particularly in a year where input costs are high and margins are already under pressure.
In a neutral season, the range of outcomes is more balanced, but in an El Niño year, the middle of that distribution shifts lower, and the downside risk increases, raising the likelihood of a poor result even if a good season remains possible.
In New South Wales, that shift is pronounced, while in Western Australia it is more contained, but across all regions the direction is consistent. The odds move against you, even if they do not guarantee the outcome.
That has practical implications for how the season is approached, influencing decisions around input use, yield expectations and overall risk management. There is no single correct response, because every farm is different, but the underlying message is clear.
El Niño does not guarantee a bad crop, but it makes a good one harder to achieve, and in a year when margins are already tight, that shift in the odds cannot be ignored.