An exporting nation

Market Morsel
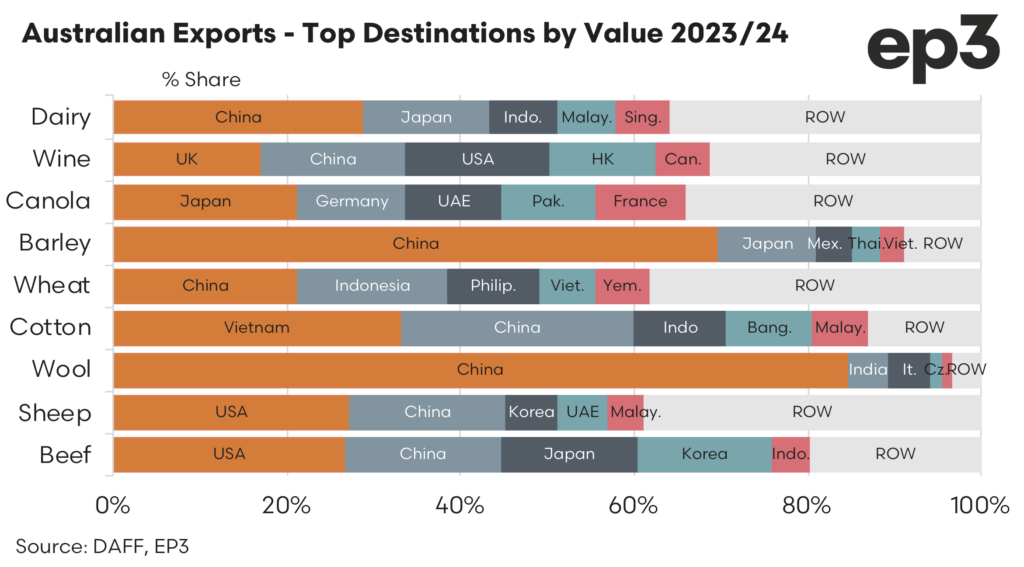
Now that the financial year for 2023/24 has finished we can take a look at the top agriculture trade destinations (by value) for the last year. Wool and Barley export markets stand out as least diversified with export flows directed towards China as the top trade destination of 85% and 70% of the trade value, respectively.
Unsurprisingly, China features prominently in most commodity export markets for Australia sitting in first or second place for all agricultural exports markets listed, with the exception of the Canola category.
A summary of each commodity category is as follows:
Dairy – China sits in top spot on 29% of dairy exports, followed by Japan on 14% and then Indonesia in third place with 8% of the value of the trade. Malaysia and Singapore sit in fourth and fifth spot on 7% and 6%, apiece. The rest of the world (ROW) takes the remaining 36%.
Wine – The resumption of trade to China has seen them re-enter the top players for wine export destinations by value sitting in second place behind the UK, albeit marginally. Indeed the three top destinations are relatively evenly spread with the UK on 17%, China on 16.7% and the USA on 16.6% market share. Hong Kong is in fourth place on 12% and Canada comes in fifth on 6%. The rest of the world accounts for the final 31%.
Canola – This category includes the export of both seed and oil. As already outlined it is the only category that doesn’t feature China in the top destinations. Japan was the top destination for Canola exports from Australia in FY2023/24 with 21% of the total trade value. European nations feature prominently in the trade with Germany in second spot on 12% and France in fifth spot on 10%. The United Arab Emirates (UAE) and Pakistan sit in third and fourth place on 11.1% and 10.7%, respectively. The ROW takes up the final 34%.
Barley – After re-entering the trade this financial year it hasn’t taken too long for China to dominate sitting on 70% of the total export value. Japan sits in second place on a respectable 11% market share but the remaining destinations drop quickly to single digits with Mexico on 4%, Thailand on 3.1% and Vietnam on 3%. Just 9% remaining goes to other destinations around the world.
Wheat – This category includes both wheat and flour exports, of which China dominates the market share on 21% of the trade value. Indonesia sits in second place on 17% with the Philippines in third spot on 11%. Meanwhile, Vietnam and Yemen are tightly locked in a battle for fourth and fifth place with 6.4% versus 6.2%. The remaining 38% of the trade goes to the rest of the world.
Cotton – Vietnam and China are the two biggest trade destinations for Australian cotton on 33% and 27% of the trade value, respectively. Indonesia and Bangladesh sit in third and fourth place on 11% and 10%, apiece. In fifth spot on 6% of the trade value sits Malaysia, while the remaining 13% is distributed across the other cotton trading nations.
Wool – This is the least diversified of all the markets presented with 85% of the trade value going to China. India and Italy battle is out for second and third place with a narrow difference of 4.8% and 4.7% each. Equally, Czechia and South Korea are in a tussle for fourth and fifth place on 1.4% and 1.2%, respectively. A little over 3% is left for the rest of the world.
Sheep & Goat Meat – This category combines sheep (lamb and mutton) exports plus goat meat exports. By value the USA was Australia’s largest market in FY2023/24 with 27% of the trade value. The USA was followed by China in second place on 18%. South Korea and the UAE sit on equal third place with 5.9% each. The fifth spot goes to Malaysia on 4% of the trade value. The rest of the world takes the remaining 39%.
Beef – The beef trade value mirrors the sheep and goat situation with the USA and China in the top two spots on 27% and 18%, respectively. However, Japan features prominently in the beef trade in third place on 16%, just ahead of South Korea on 15%. In fifth spot sits Indonesia with 4% of the total Australian beef export value for the 2023/24 financial year. This leaves 20% for the remaining global destinations.
The table below shows the top 10 trade destinations (by value) for each commodity based on the flows seen during the 2023/24 financial year.


