More food inflation data, more often

Food Inflation Update - October 2025
Retail food inflation has taken another step forward in transparency with the ABS rolling out an expanded monthly dataset that now mirrors the breadth of the former quarterly series. For analysts and consumers alike, this means a clearer, more granular view of how prices are shifting across the supermarket aisle in real time, rather than waiting for the larger quarterly releases. The October update provides the first full month of data under this broader scope and already reveals some notable divergences across categories.
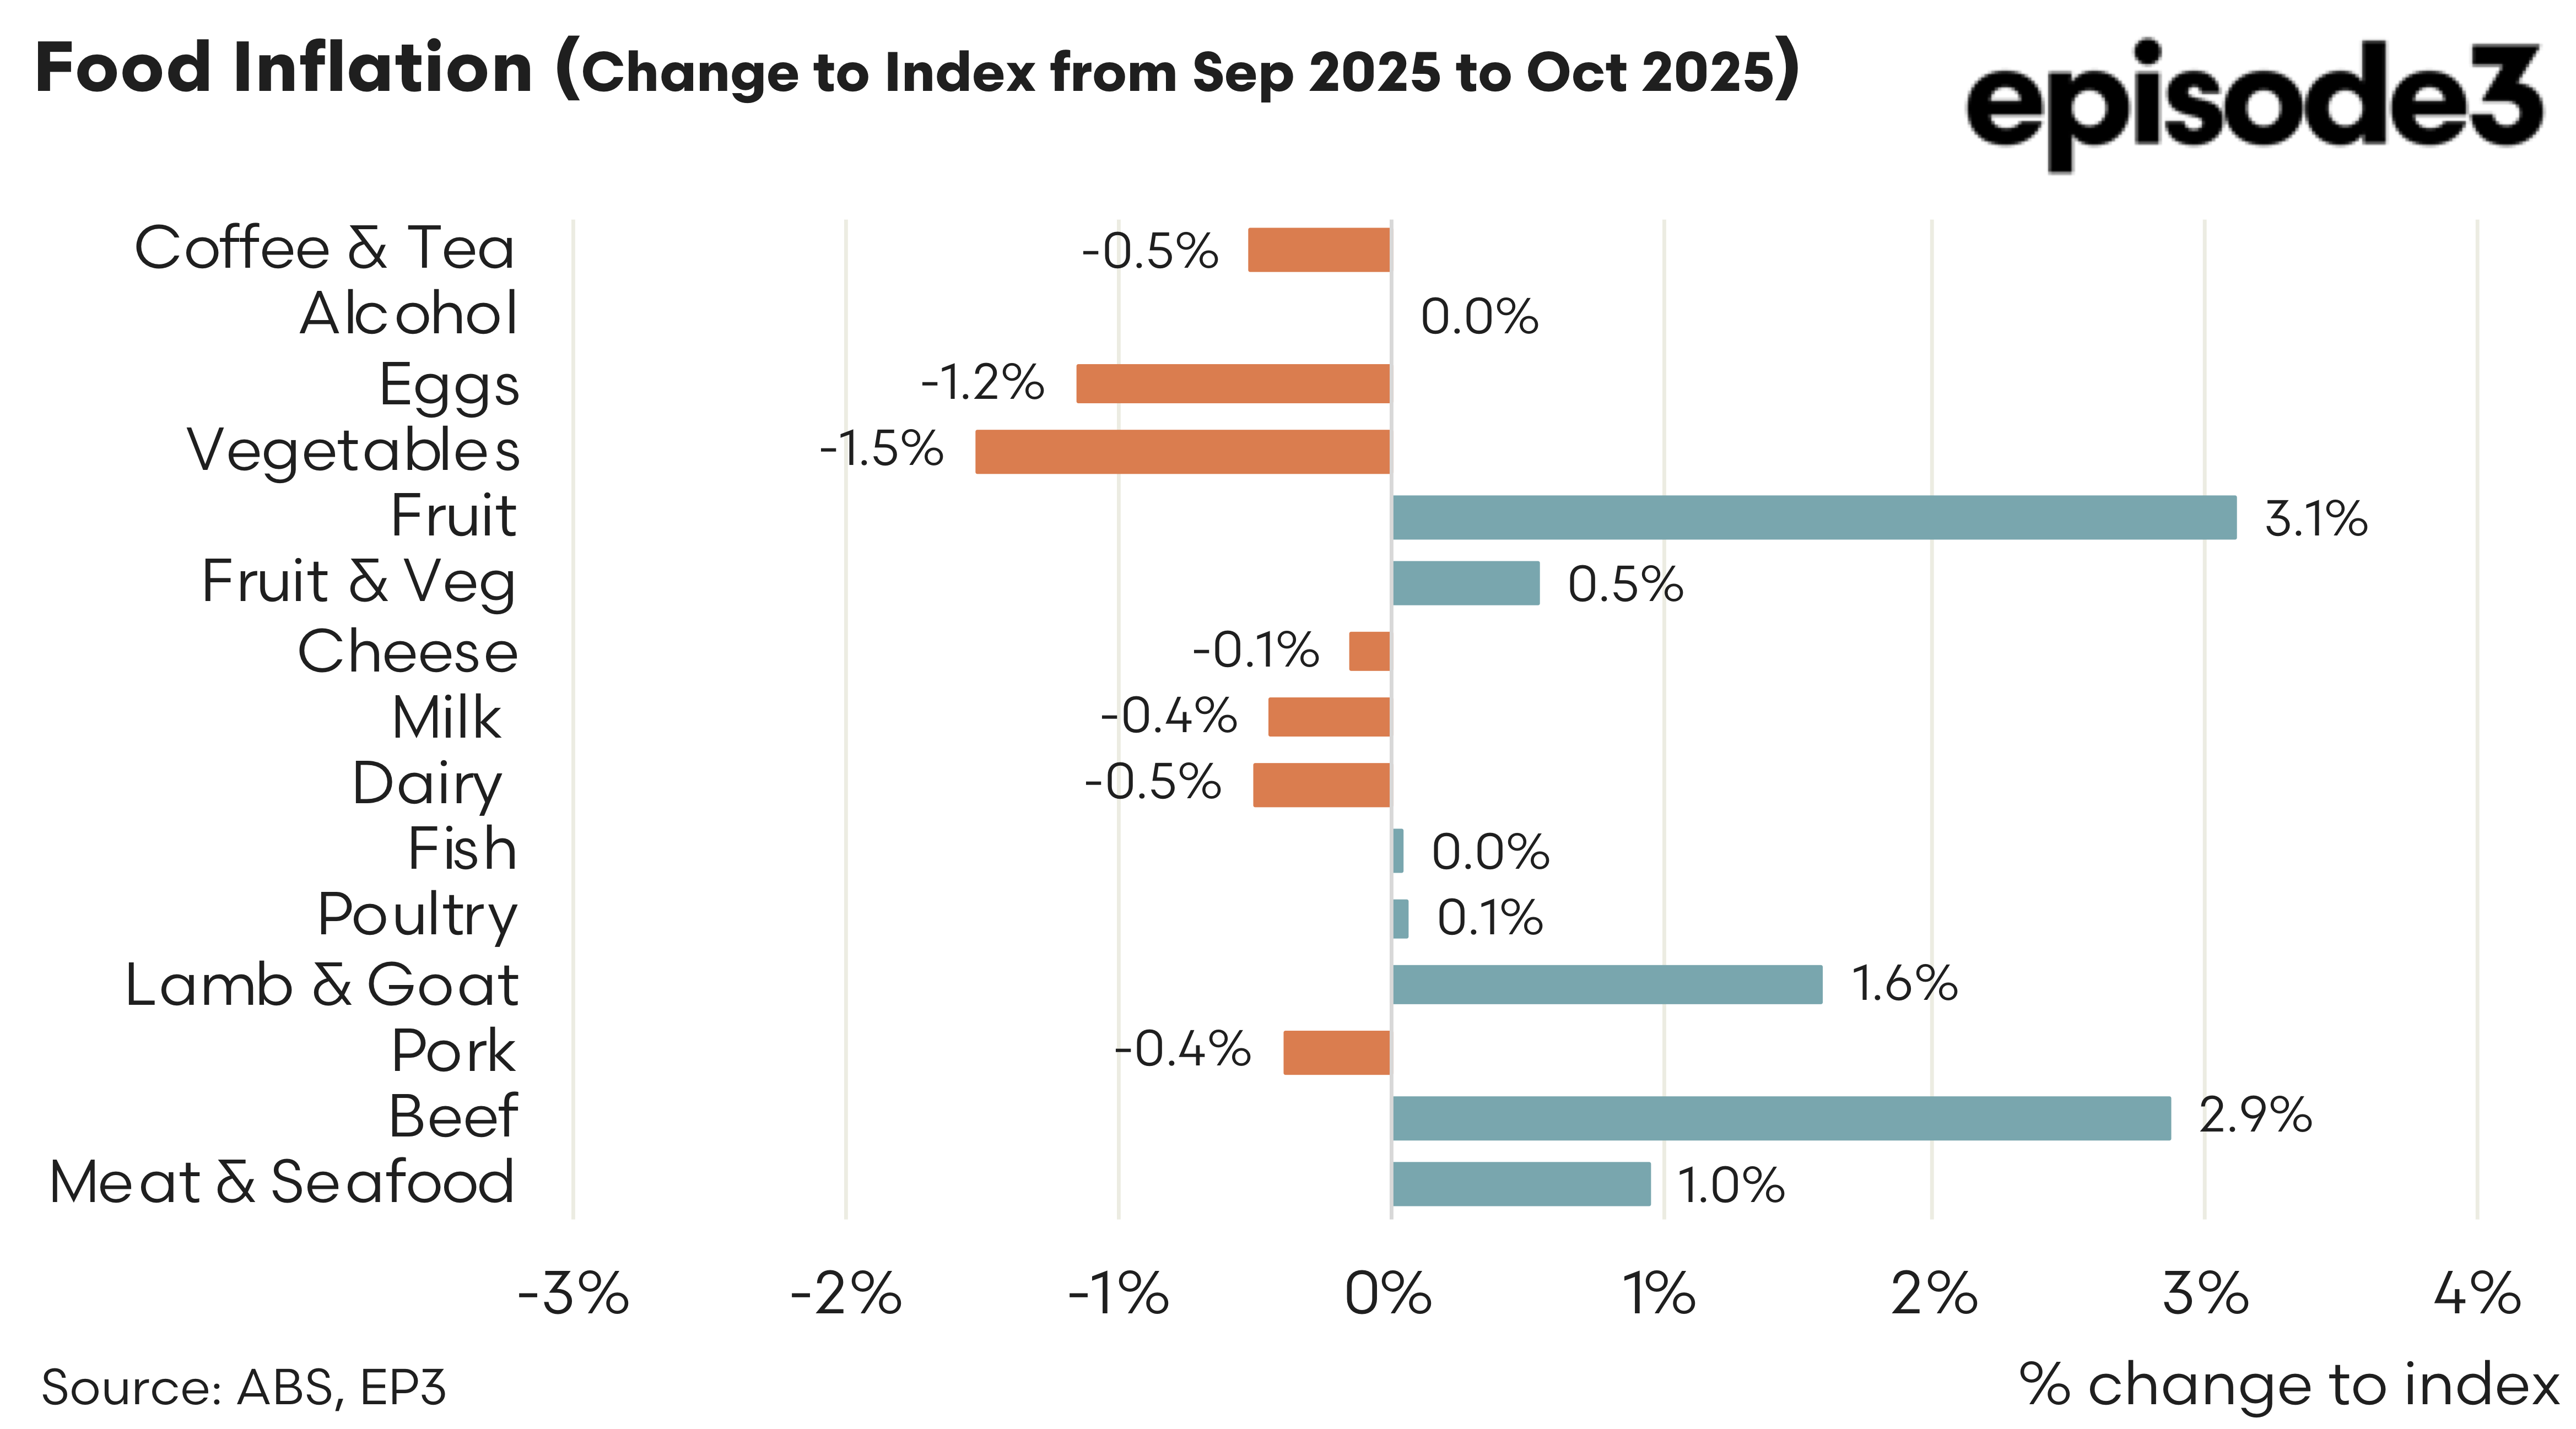
The expanded coverage shows that the food landscape remains mixed, even as price pressures have eased slightly in several staples. Vegetables fell by one and a half percent from September to October, while fruit declined by a little over one percent. Combined, the fruit and vegetable category recorded a fall of half a percent for the month. Warmer conditions and improved supply pipelines appear to be providing some relief after a year in which fresh produce had been a significant contributor to grocery bills. Eggs also moved lower, falling by 1.2 per cent for the month, which stands in contrast to their position as the strongest source of annual food inflation over the past year.
The dairy aisle largely shifted sideways, with milk down by four-tenths of a percent and cheese slipping by a negligible one-tenth. These movements are small in isolation, but they point to a period of relative stability for dairy after a long stretch of elevated production costs. Fish also eased slightly, falling by half a percent, while poultry registered only a marginal rise of 0.1 percent.
The protein complex, however, told a different story. Beef rose by 2.9 percent from September to October, while lamb and goat lifted by 1.6 percent. Meat and seafood as a broad category increased by 1 percent. These increases follow a winter period marked by tighter availability and stronger saleyard values, particularly for lamb, and indicate that the flow-through into retail shelves has not yet run its course. The new monthly data makes it clearer that meat inflation is not moving in lockstep across species; rather, each component reflects its own supply dynamics and the degree of downstream pricing power.
Beverage categories showed the most noticeable shifts. Coffee and tea fell by half a percent after posting strong gains earlier in the year, while alcohol prices held steady at zero monthly movement. Given the elevated baseline in both categories over the past twelve months, any pause is likely to be welcomed by households who have seen discretionary food and drink costs move consistently higher.
The inclusion of the full food basket in the monthly release allows for a more immediate interpretation of inflation pressures. The contrast between falling prices in fresh produce and rising prices in meat is far more visible now that these categories are published together each month. Similarly, the mild softening in dairy and beverages stands out more sharply against the strength in proteins and the stubborn resilience of some packaged food lines. These nuances were previously blurred within the older, narrower monthly indicator, which captured only a limited subset of food items.

Although the month-to-month changes are modest, they continue to highlight the differing rhythms within the food supply chain. Weather and seasonal patterns are still steering fresh produce, while livestock markets and processor margins underpin protein movements. Imported input costs, freight, and currency effects remain relevant for coffee, tea, alcohol, and packaged food more broadly. The expanded CPI coverage offers a clearer window into each of these drivers by presenting the full set of categories side by side.
The October numbers reinforce that the inflation story is no longer one of broad-based rises across the supermarket but is instead defined by sharp contrasts between groups. Fresh produce is easing, dairy is steady, beverages are stabilising, and meats are rising again. With monthly reporting now aligned with the detail historically available quarterly, these shifts will be easier to track, interpret, and communicate. For households trying to understand what is pushing or easing their grocery bills, and for industry watching the movement of retail margins, the additional clarity is overdue.
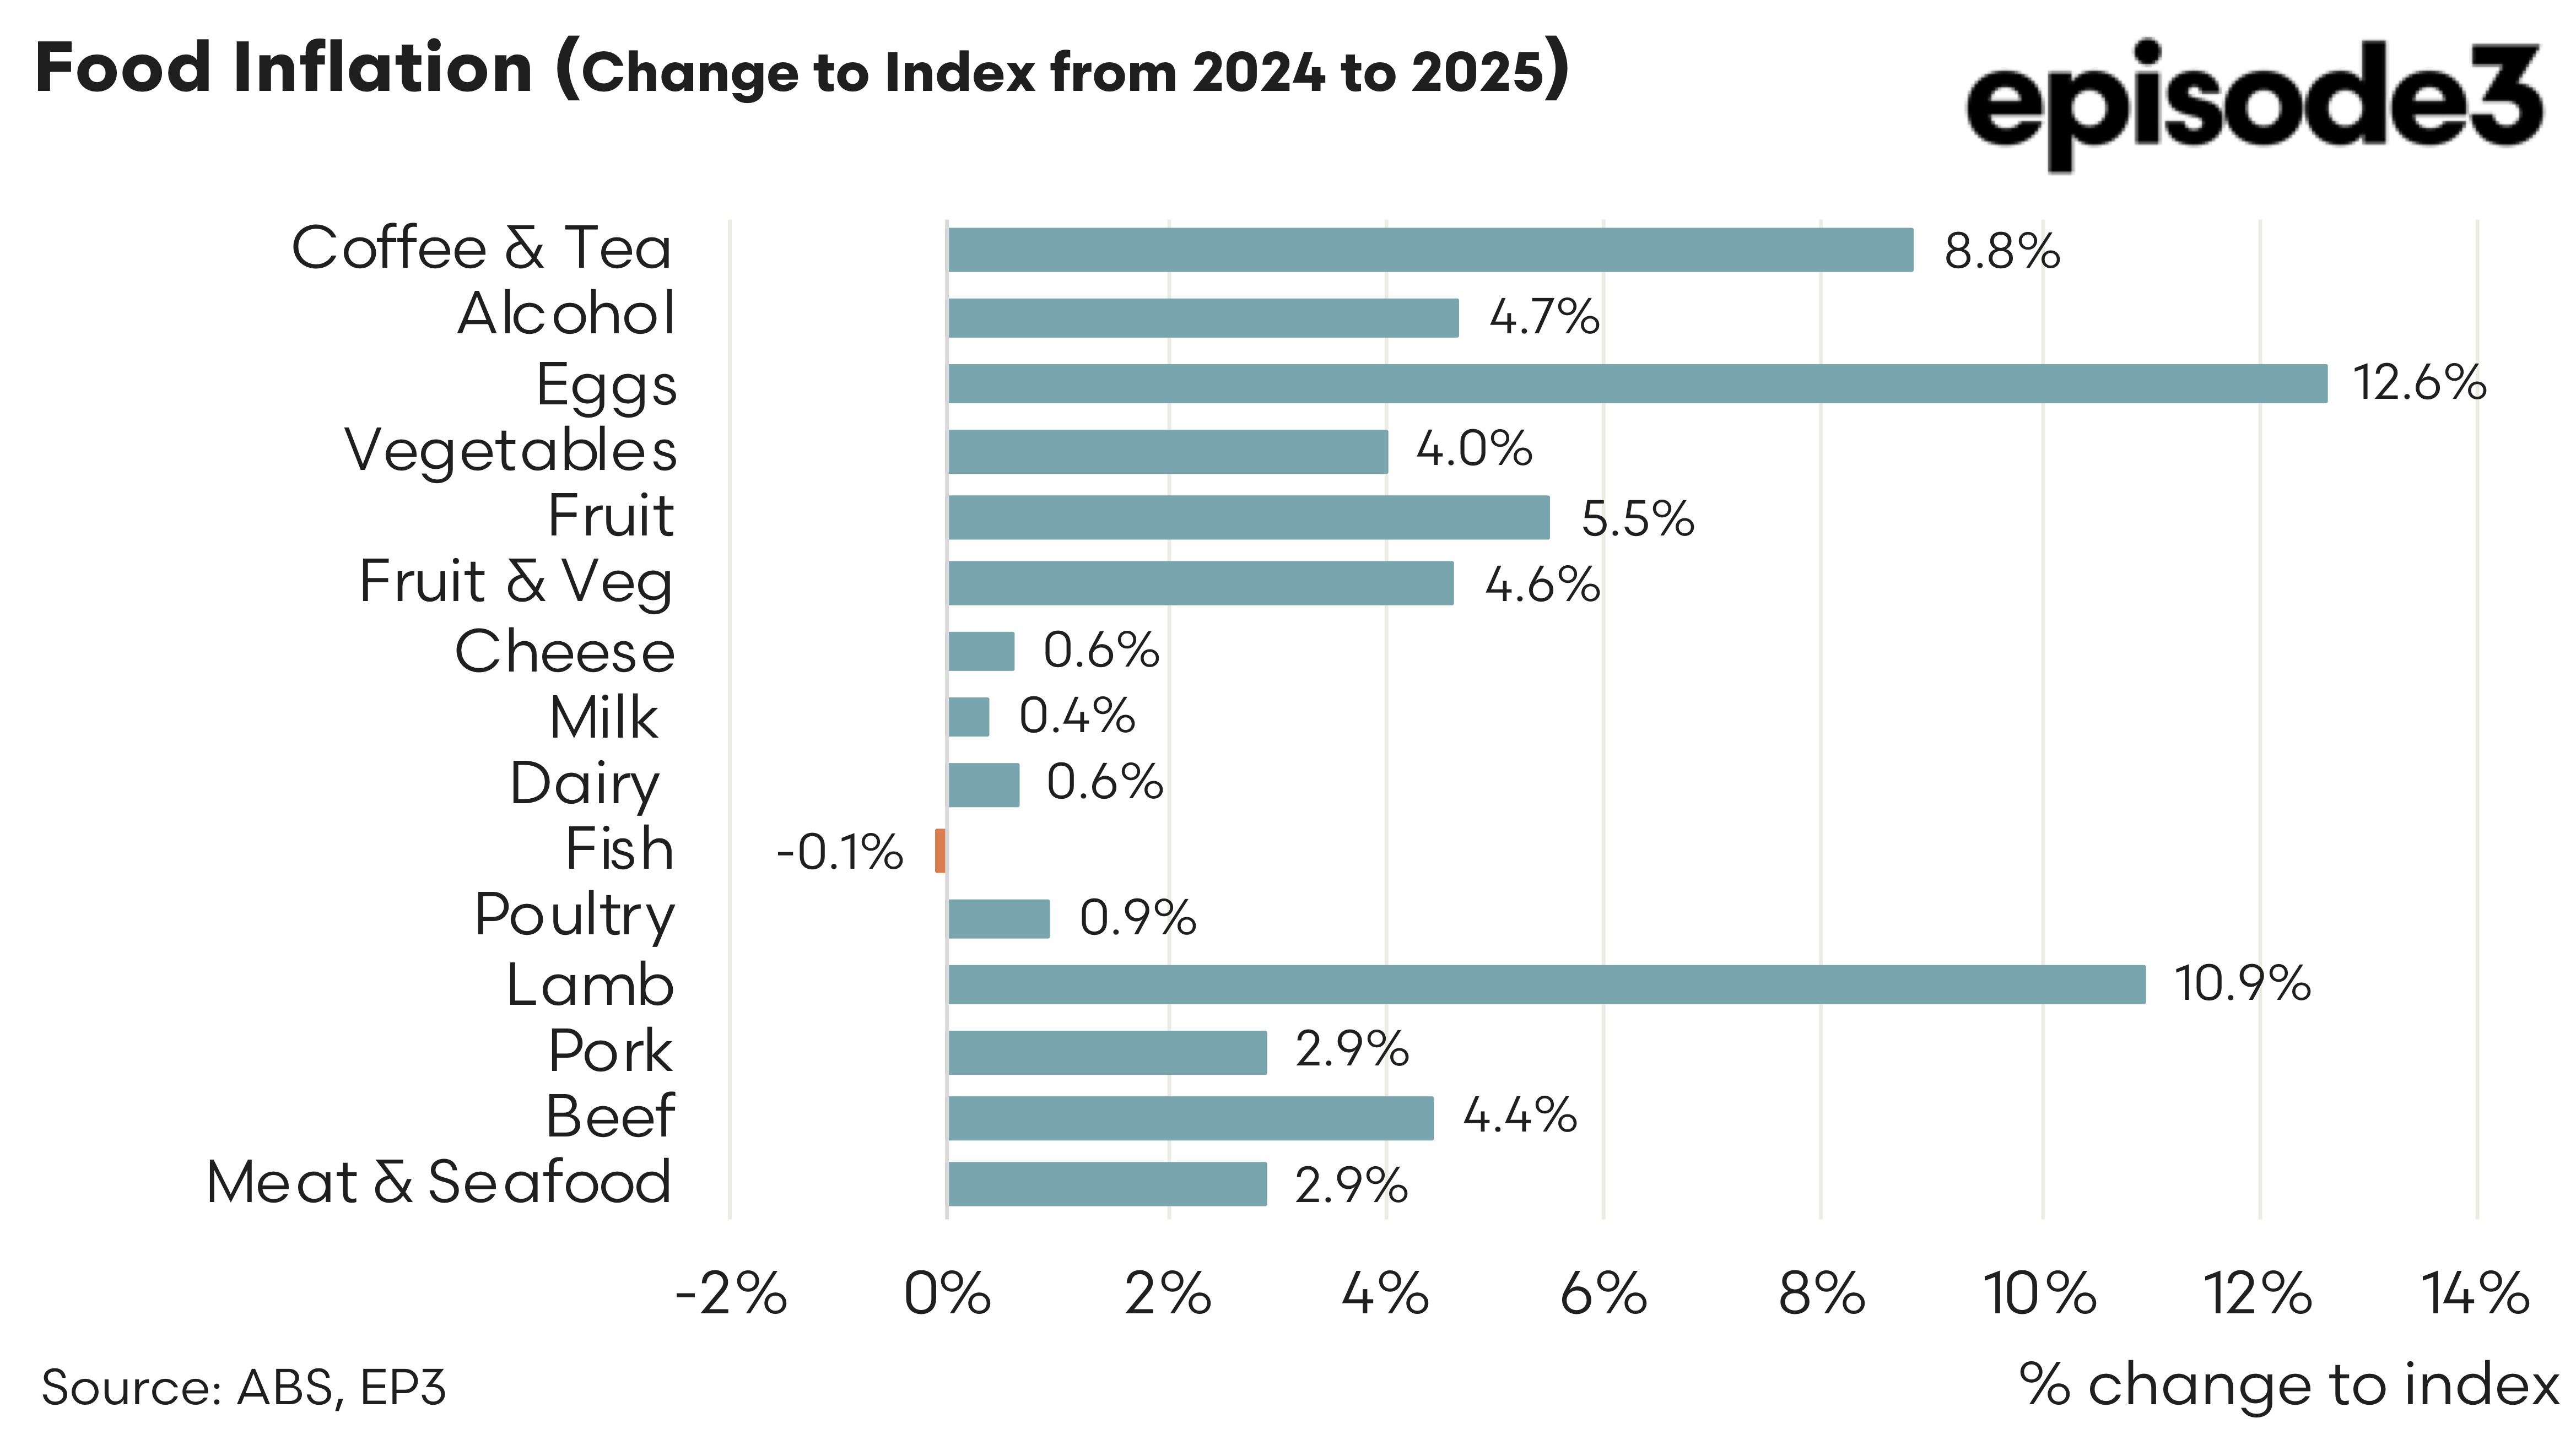
While the month-to-month shifts offer a sharper, real-time view of household pressures, the expanded dataset also allows for a more confident reading of the annual picture. The twelve-month changes continue to show food inflation running at different speeds depending on the category, with some items still carrying the legacy of earlier cost shocks while others have settled into more predictable patterns. Eggs remain the standout, climbing by 12.6 percent over the year and reinforcing their position as the most inflation-heavy component of the basket. Tight supply, higher feed costs, and structural adjustments within the poultry industry have all contributed to this prolonged elevation. Coffee and tea also sit high on the annual leaderboard at 9.5 percent, reflecting global commodity price movements and the same freight and currency pressures that have periodically resurfaced over the past two years.
Fresh produce tells a more balanced story. Fruit is up by 5.5 percent and vegetables by 3.5 percent across the year, with the combined category rising by 4.4 percent. These increases are material, yet they represent a calmer inflation environment than the extreme swings seen during earlier weather-affected periods. The annual numbers suggest that while supply disruptions have eased, underlying costs such as labour, freight, packaging, and energy continue to anchor prices at a higher base than before. This pattern of moderated but persistent inflation is also evident in dairy, where milk and cheese each increased by around half a percent over the year, signalling an industry moving out of its cost-pressure peak but not yet returning to outright deflation.
Meat categories continue to define the middle ground of annual food inflation. Beef rose by 5.1 percent, pork by 2.9 percent, and the broader meat and seafood group by 3.1 percent. Lamb and goat sit far above the other proteins, increasing by 12.1 percent over the year, which links directly to the winter saleyard peaks. With processors facing higher procurement costs and limited ability to absorb them, the retail channel has had little choice but to pass some of these increases through. The annual data makes it clear that, despite a short-term easing in some categories, consumers continue to pay noticeably more for red meat than they did a year ago.
Across the full basket, the annual inflation profile illustrates the unevenness of the grocery environment. Categories that once led the inflation cycle, such as dairy, are now largely stable. Others, like fresh produce, have normalised but remain elevated compared with long-term averages. Meanwhile, proteins and key discretionary items continue to drive much of the upward pressure. The expanded ABS monthly release brings these contrasts into sharper relief, offering a more transparent depiction of how each part of the food chain is behaving. For households and industry stakeholders alike, this enriched dataset provides the clearest read yet on the evolving cost structure of the Australian supermarket.