Driving Ms Wool Market

Market Morsel
In the lead up to Wool Poll 2024 there has been some interesting discussion on social media as to what factors drive the Australian wool price. The team at Episode 3 decided to take a quick look to see what some of the key influences could be since the closure of the Reserve Price Scheme in the early 1990s.
Like most commodity markets, supply and demand factors are key drivers and wool is no different. For individual wool auctions, price received by the grower can be influenced by the specific characteristics of the specific wool being sold, such as wool micron, vegetable matter, stain, sheep breed and wool type. However, moving beyond the sale of specific individual lots of wool, what factors underpin the trend of the broader wool market, such as the trend displayed by the Eastern market Indicator (EMI)?
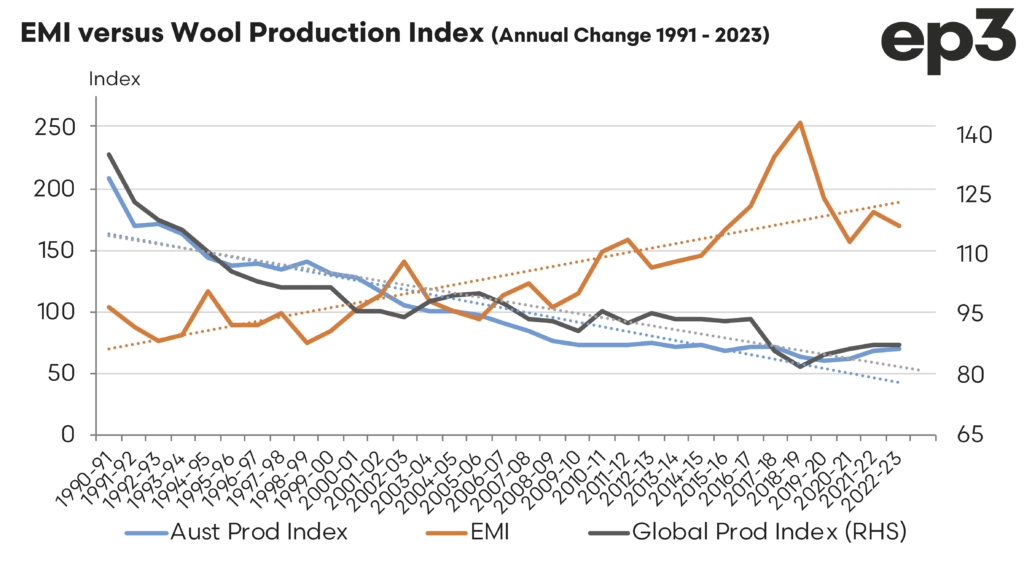
Supply is a relatively easy factor to measure, whether it is local annual wool production volumes or global wool production. The chart below converts the EMI and wool production levels into an index (base=100 in 2004/05). Since 1990 the EMI has demonstrated a rising price trend, albeit with annual fluctuations up & down depending upon the year. Over the period displayed, from 1990 to 2023, Australian wool production and global wool production has shown a clear declining trend. Rudimentary economics theory highlights, that as supply declines and wool production tightens this leads to rising prices. This appears to hold true for the EMI with the trend of reduced wool production over time leading to a rising price trend.
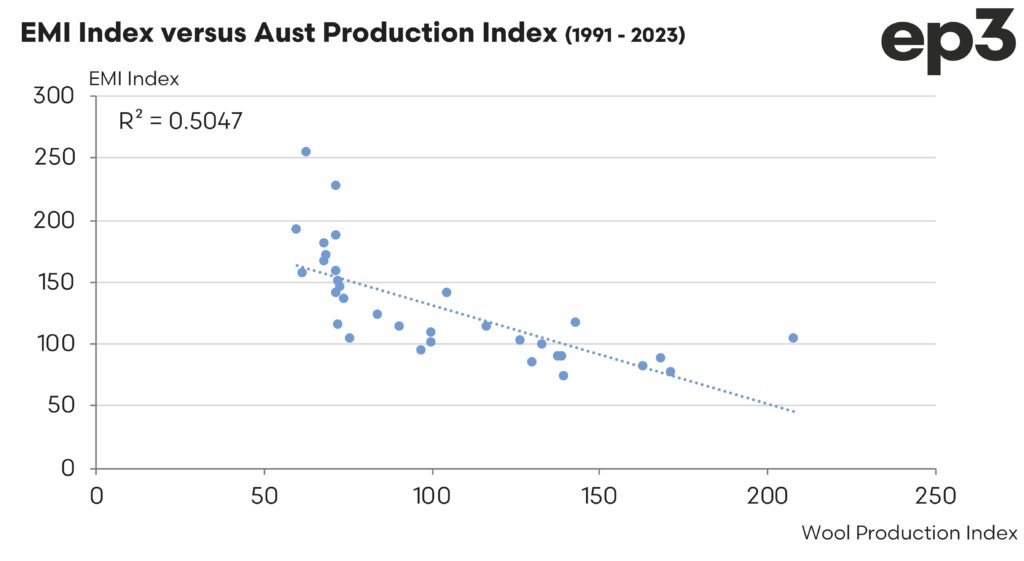
Comparing the annual EMI to annual Australian wool production as a scatter plot from 1990 to 2023 shows that there is an inverse relationship, signalling that lower supply tends to encourage higher pricing for the EMI. Indeed, a measure of the strength of the correlation between the two indicators shows that with an r-squared of 0.5047 that around 50% of the variance in the EMI can be explained by the domestic Australian wool production levels.
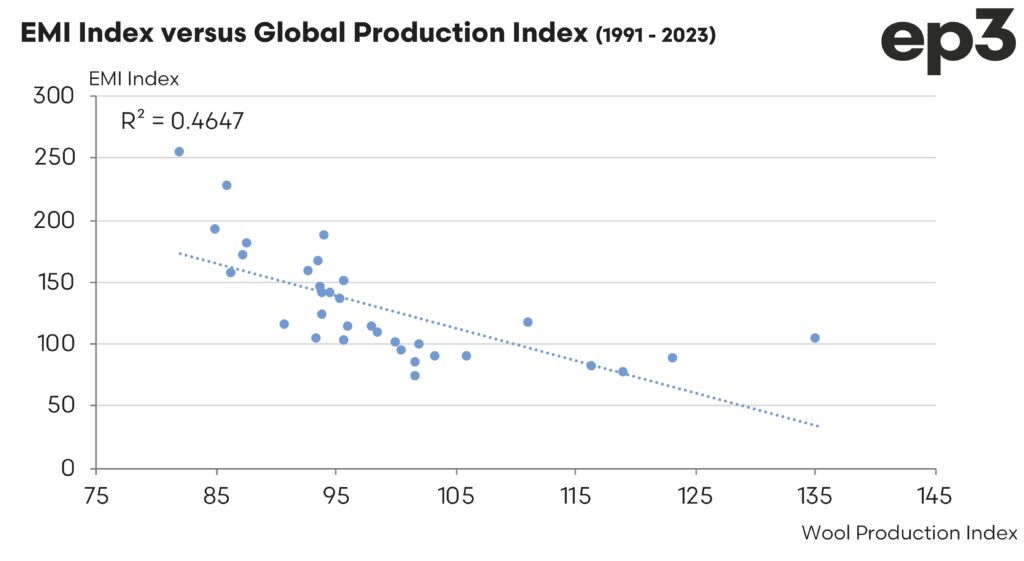
However, Australia doesn’t produce wool in isolation. A look at the comparison of the EMI to the global wool production levels shows a similar inverse relationship between wool production and the EMI, with higher levels of wool production leading to lower prices and lower levels of production being consistent with higher pricing. The strength of the correlation is relatively similar too, albeit slightly lower, with an r-squared of 0.4647.
Supply isn’t the only factor influencing the wool price. Demand also plays a key part, and demand is underpinned by global growth levels.
Global growth levels have a direct impact on the demand for wool, as economic expansion typically leads to increased consumer spending on clothing, textiles, and luxury goods, all of which can drive demand for wool. In periods of strong global growth, industries like fashion and home textiles tend to see higher sales, leading to greater demand for natural fibers like wool, which is often used in premium and sustainable products. As demand for wool rises, prices tend to increase due to the limited supply of high-quality wool.
Conversely, during periods of economic slowdown or recession, demand for wool can decline as consumers cut back on discretionary spending, particularly on luxury and non-essential items. In such scenarios, wool prices may fall as a result of reduced demand, leading to downward pressure on the market. Global growth trends, therefore, play a crucial role in shaping both the demand for and the pricing of wool in Australia and in international markets.
In order to demonstrate how global growth can influence the Australian wool price we constructed a global growth index using key economic indicators from a selection of major economic regions.
The three key economic indicators were chosen for the Global Growth Index are as follows:
- Chinese Purchasing Managers Manufacturing Index (PMI): This measures the health of China’s manufacturing sector by surveying businesses on production, orders, and employment. It’s important because China is a major global economy, and the PMI helps track its industrial performance.
- German IFO Business Climate Index: This index reflects the confidence of businesses in Germany, based on current business conditions. It is a strong predictor of Germany’s economic health and overall European growth.
- US Gross Domestic Product (GDP) per capita: This measures the economic output per person in the U.S., giving insight into the country’s economic health and living standards.
These indicators provide a snapshot of economic activity in key global regions.
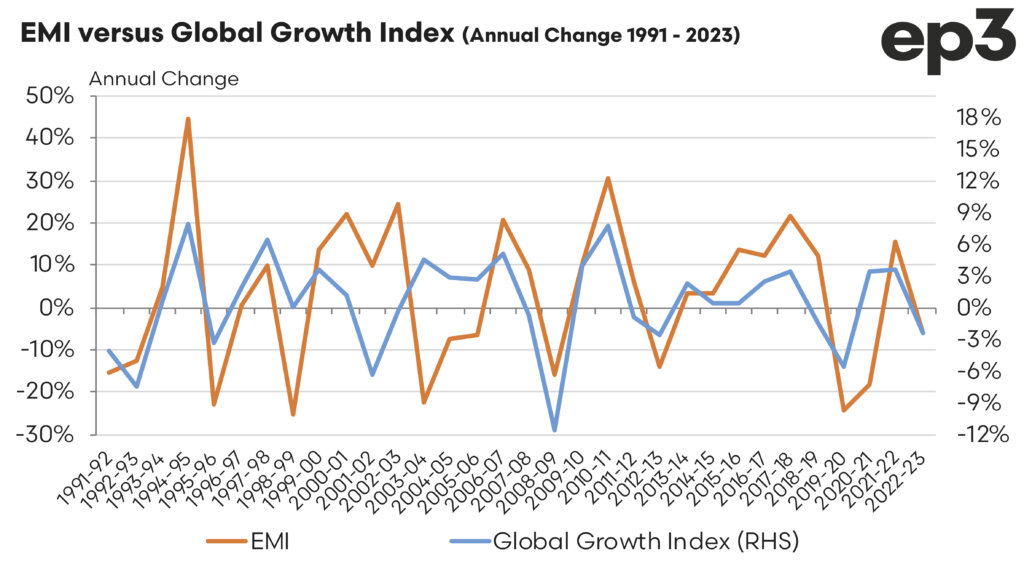
The chart below highlights the annual change in the Global Growth Index (GGI) versus the annual price change for the EMI. Expansionary phases in the GGI were often consistent with an increase in the wool price, similarly a contractionary phase in global growth saw wool prices decline.
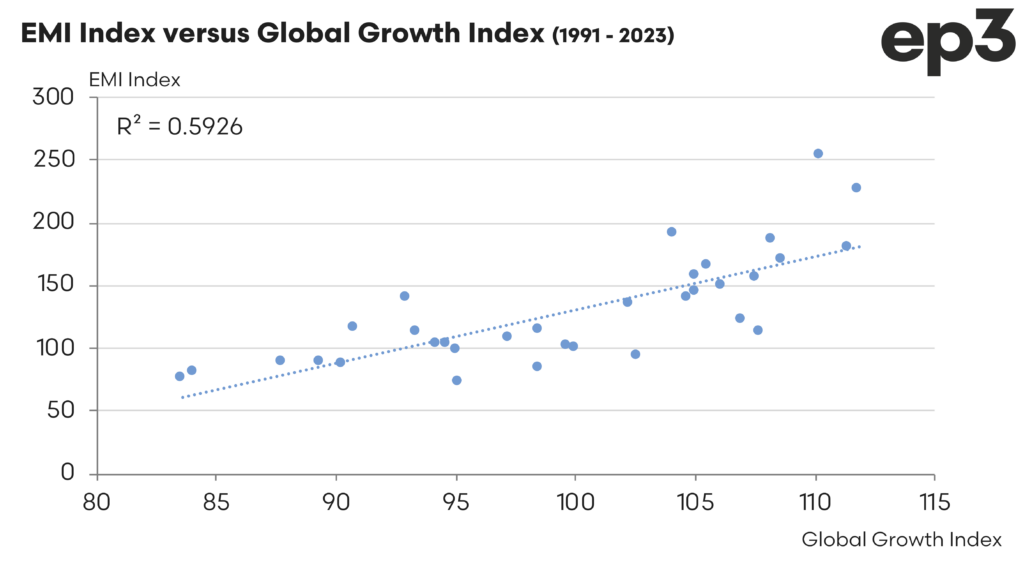
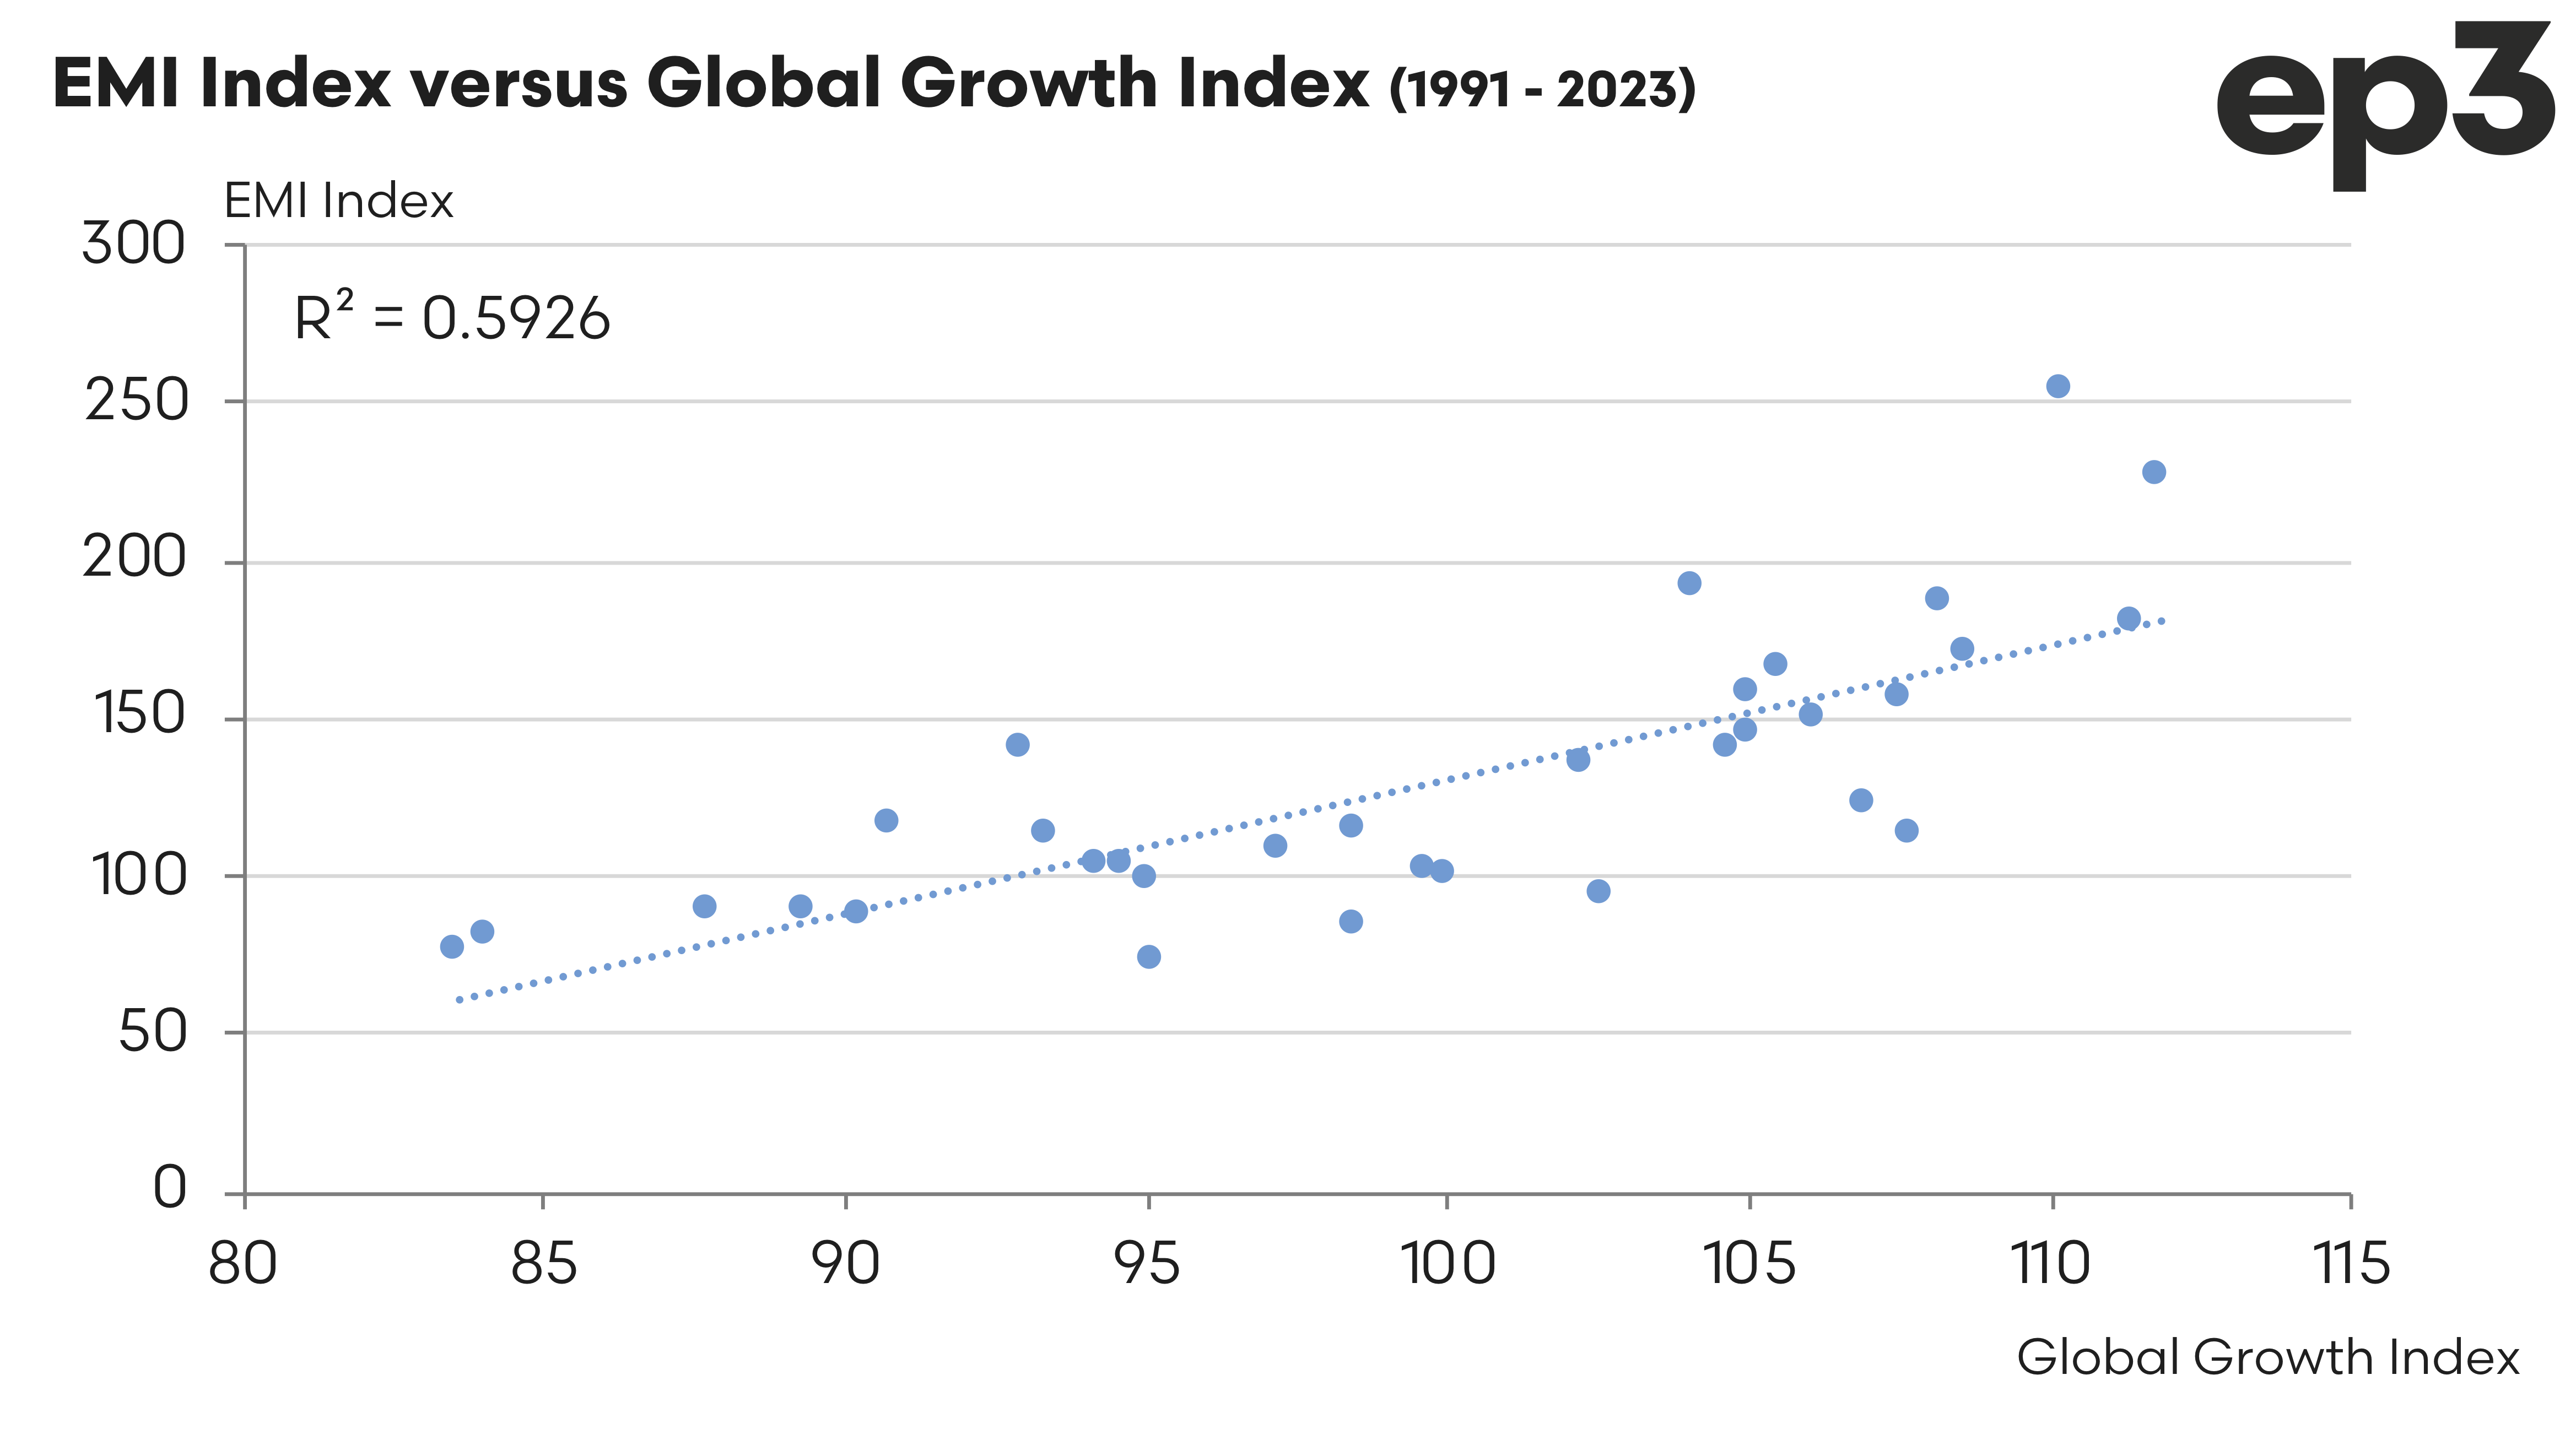
Analysis of the GGI versus the EMI as a scatter plot confirms the strong correlation between the two indicators with higher global growth (economic expansion) consistent with a higher EMI and lower global growth (economic contraction) consistent with lower EMI levels. Indeed, the strength of this relationship was even stronger than displayed by wool production with an r-squared measure of 0.5926, suggesting that nearly 60% of the EMI trend can be explained by changes in the global growth level of the key economies of China, Europe and the USA.
The simple regression analysis performed in this article highlights two key drivers of the EMI. However, there are likely to be more factors than these two that also influence the broad trend in Australian wool pricing. A more detailed assessment could be undertaken to demonstrate what other factors help drive the direction of the EMI, including more complex economic and statistical modelling methodology. If there are industry participants keen to discuss further modelling opportunities on the main drivers of the Australian wool price trend make sure to reach out to the team at Episode 3 via our contact us page.

