Market Morsel: Friendly fibres – cotton & wool
Market Morsel
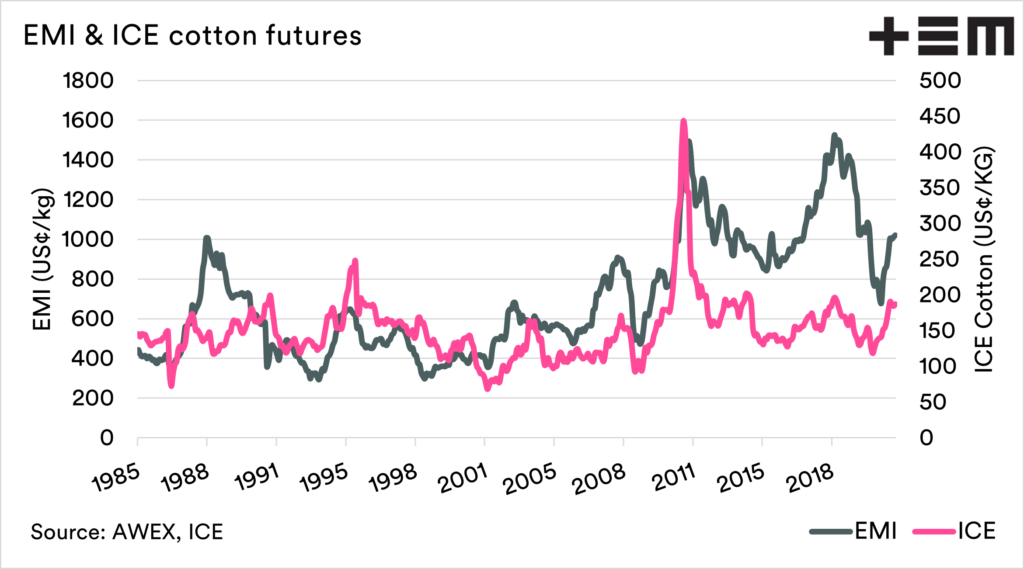
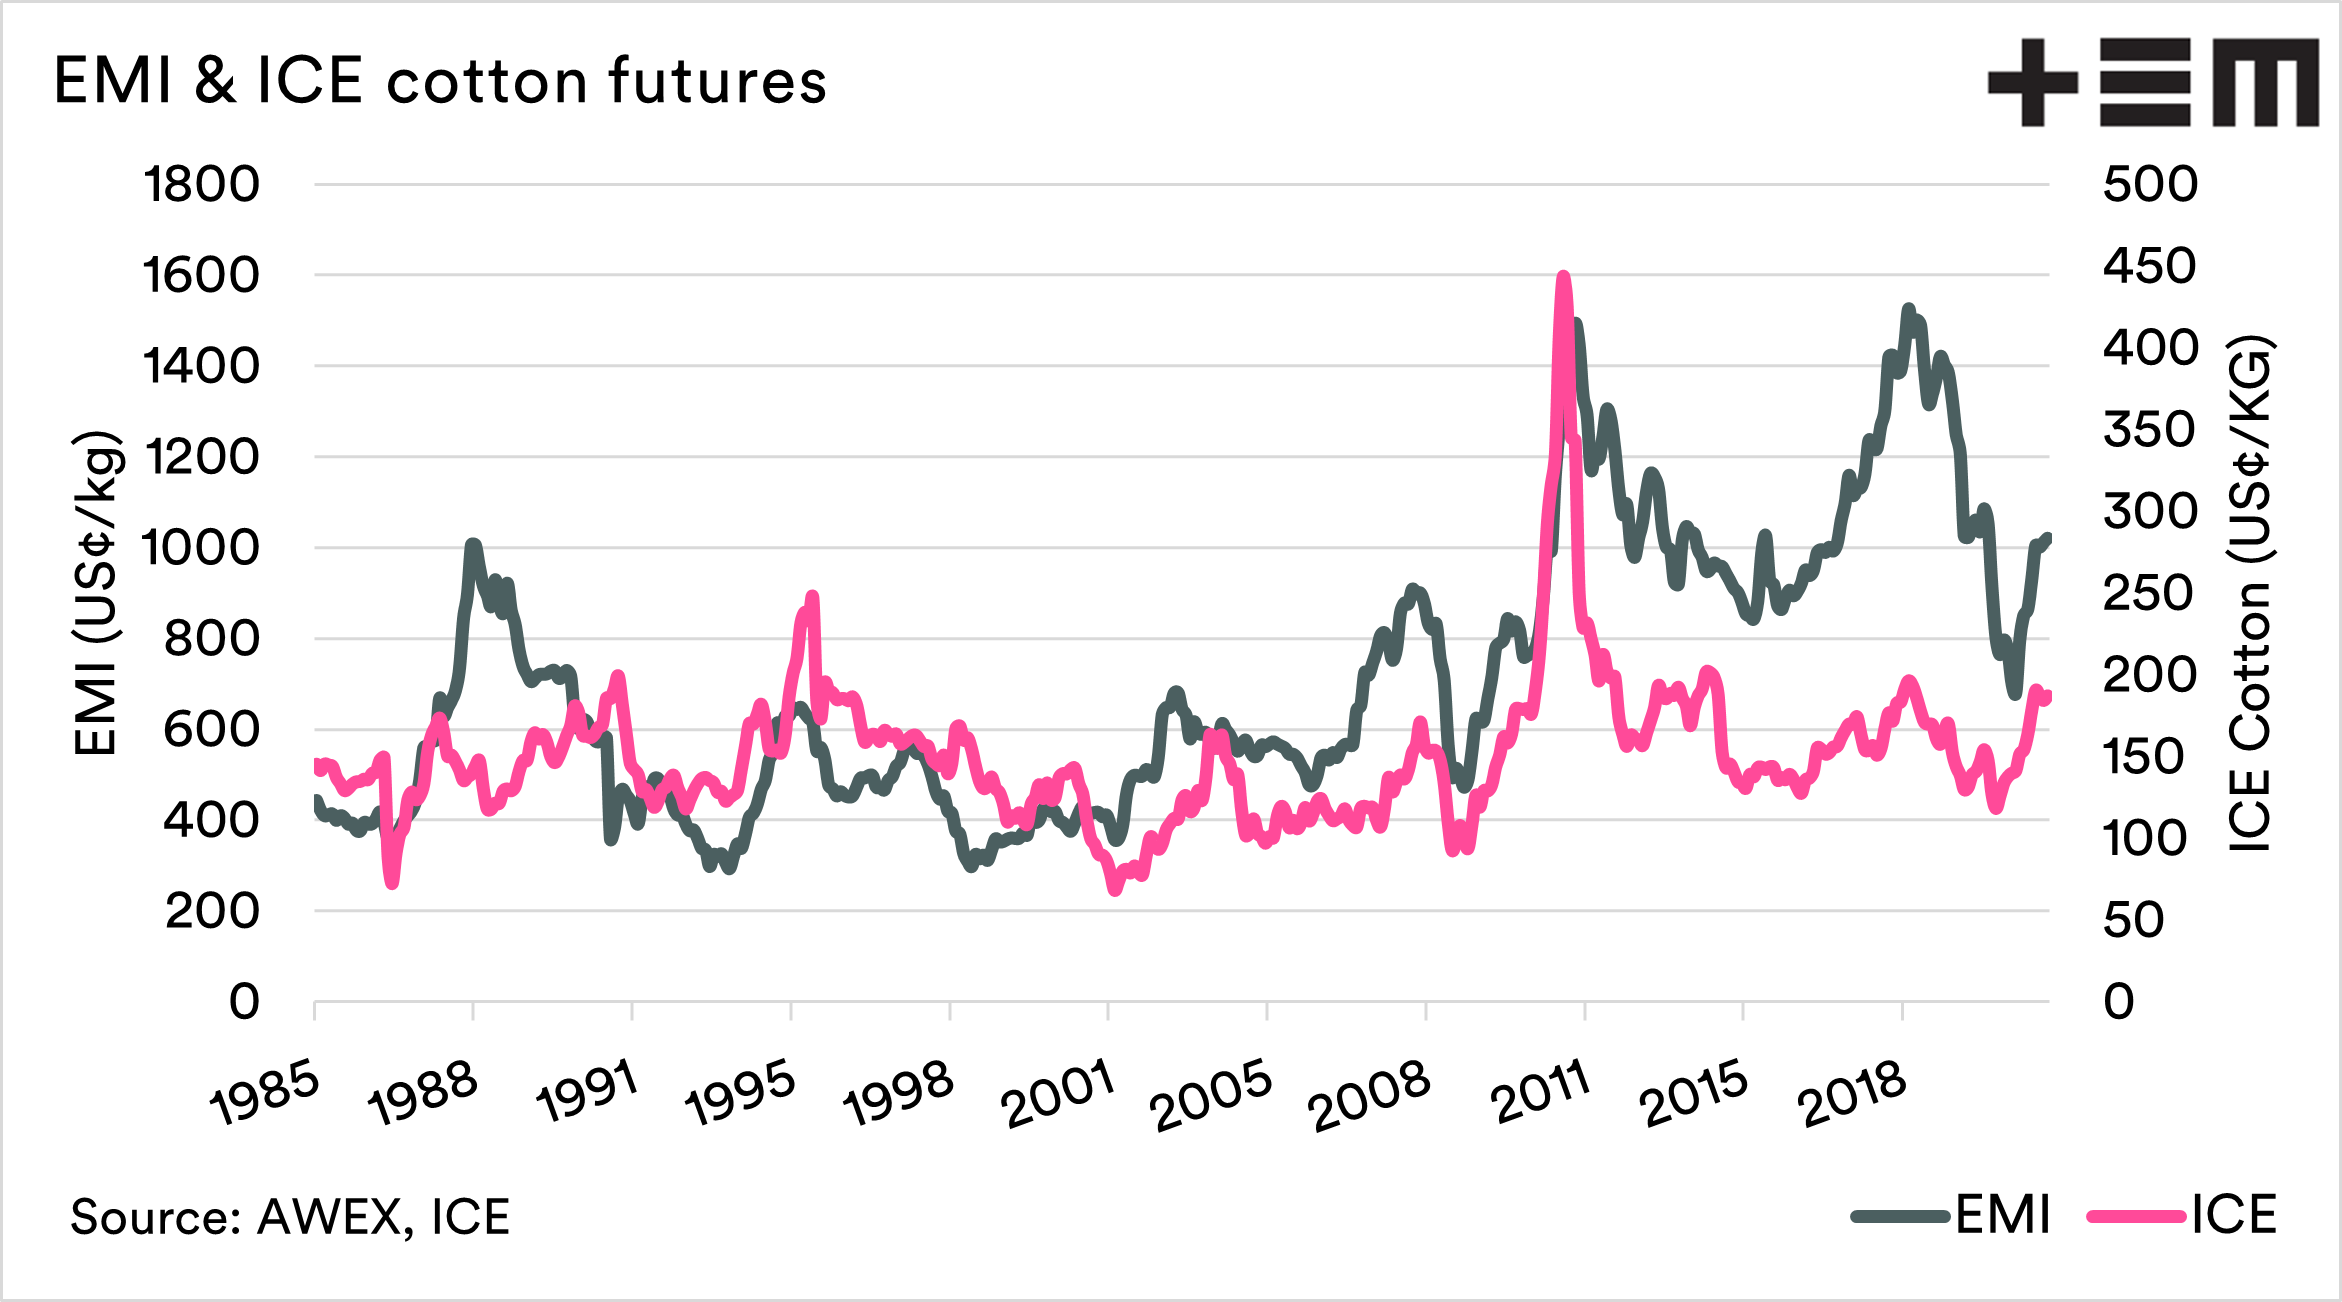
Wool and cotton are both natural fibres and obviously have similar end-uses. Clothing for the most part. It makes sense that they tend to follow quite similar movement trends.
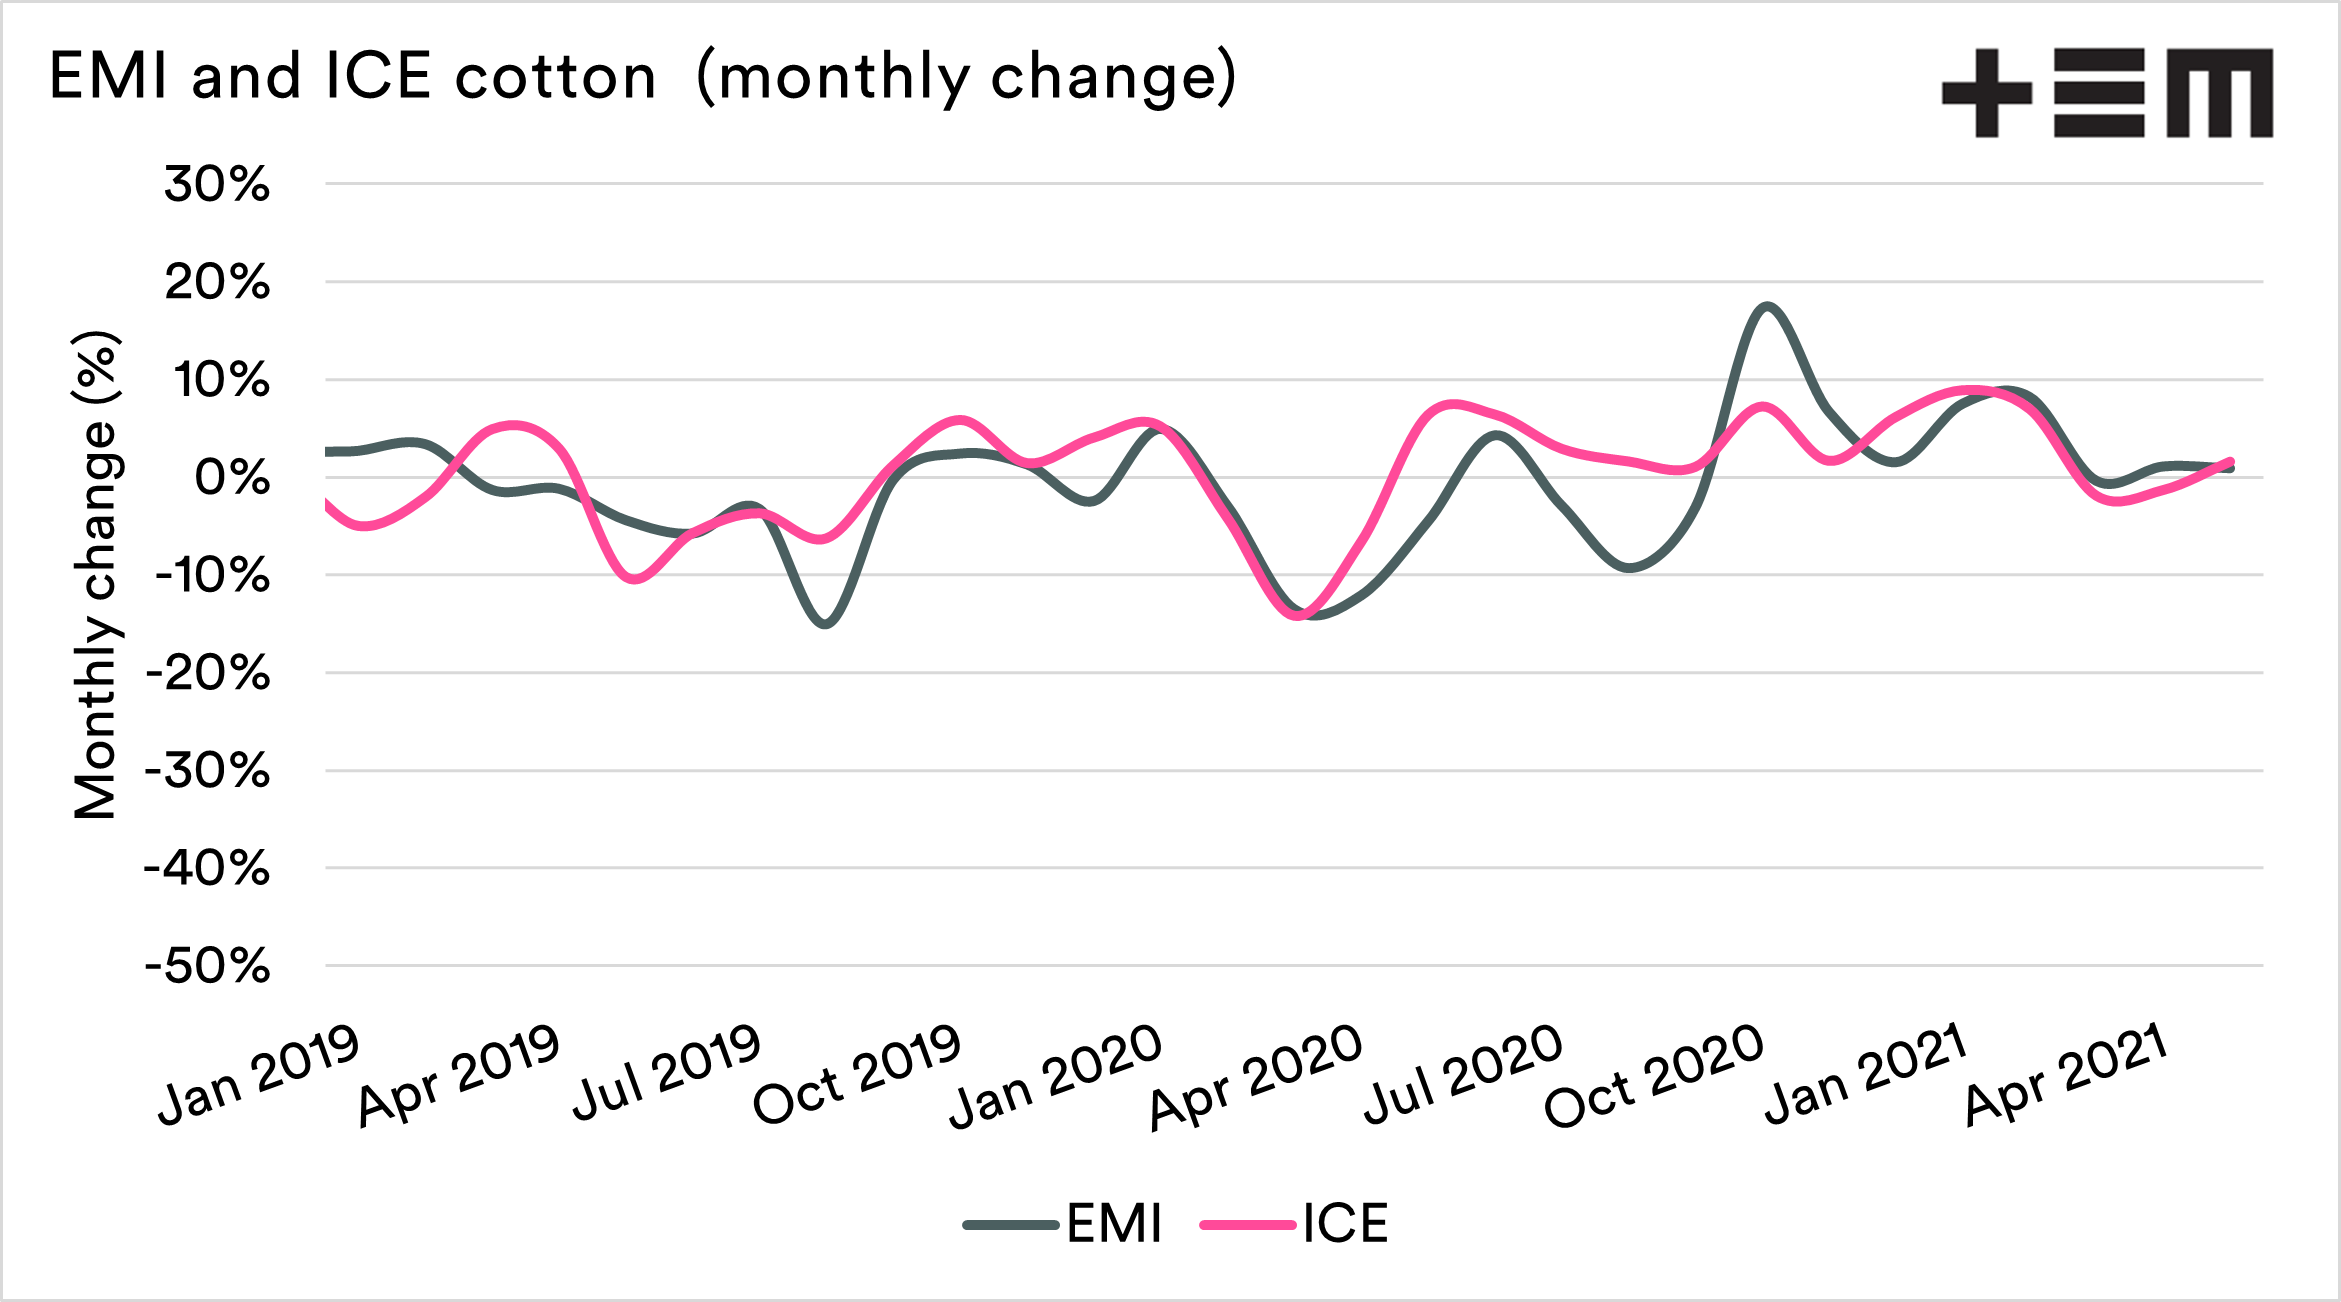
This is especially so during the past couple of years. Cotton and wool monthly movements in price have had a strong correlation.
During the latter half of 2010’s wool pricing really broke away from cotton and traded at very strong premiums.
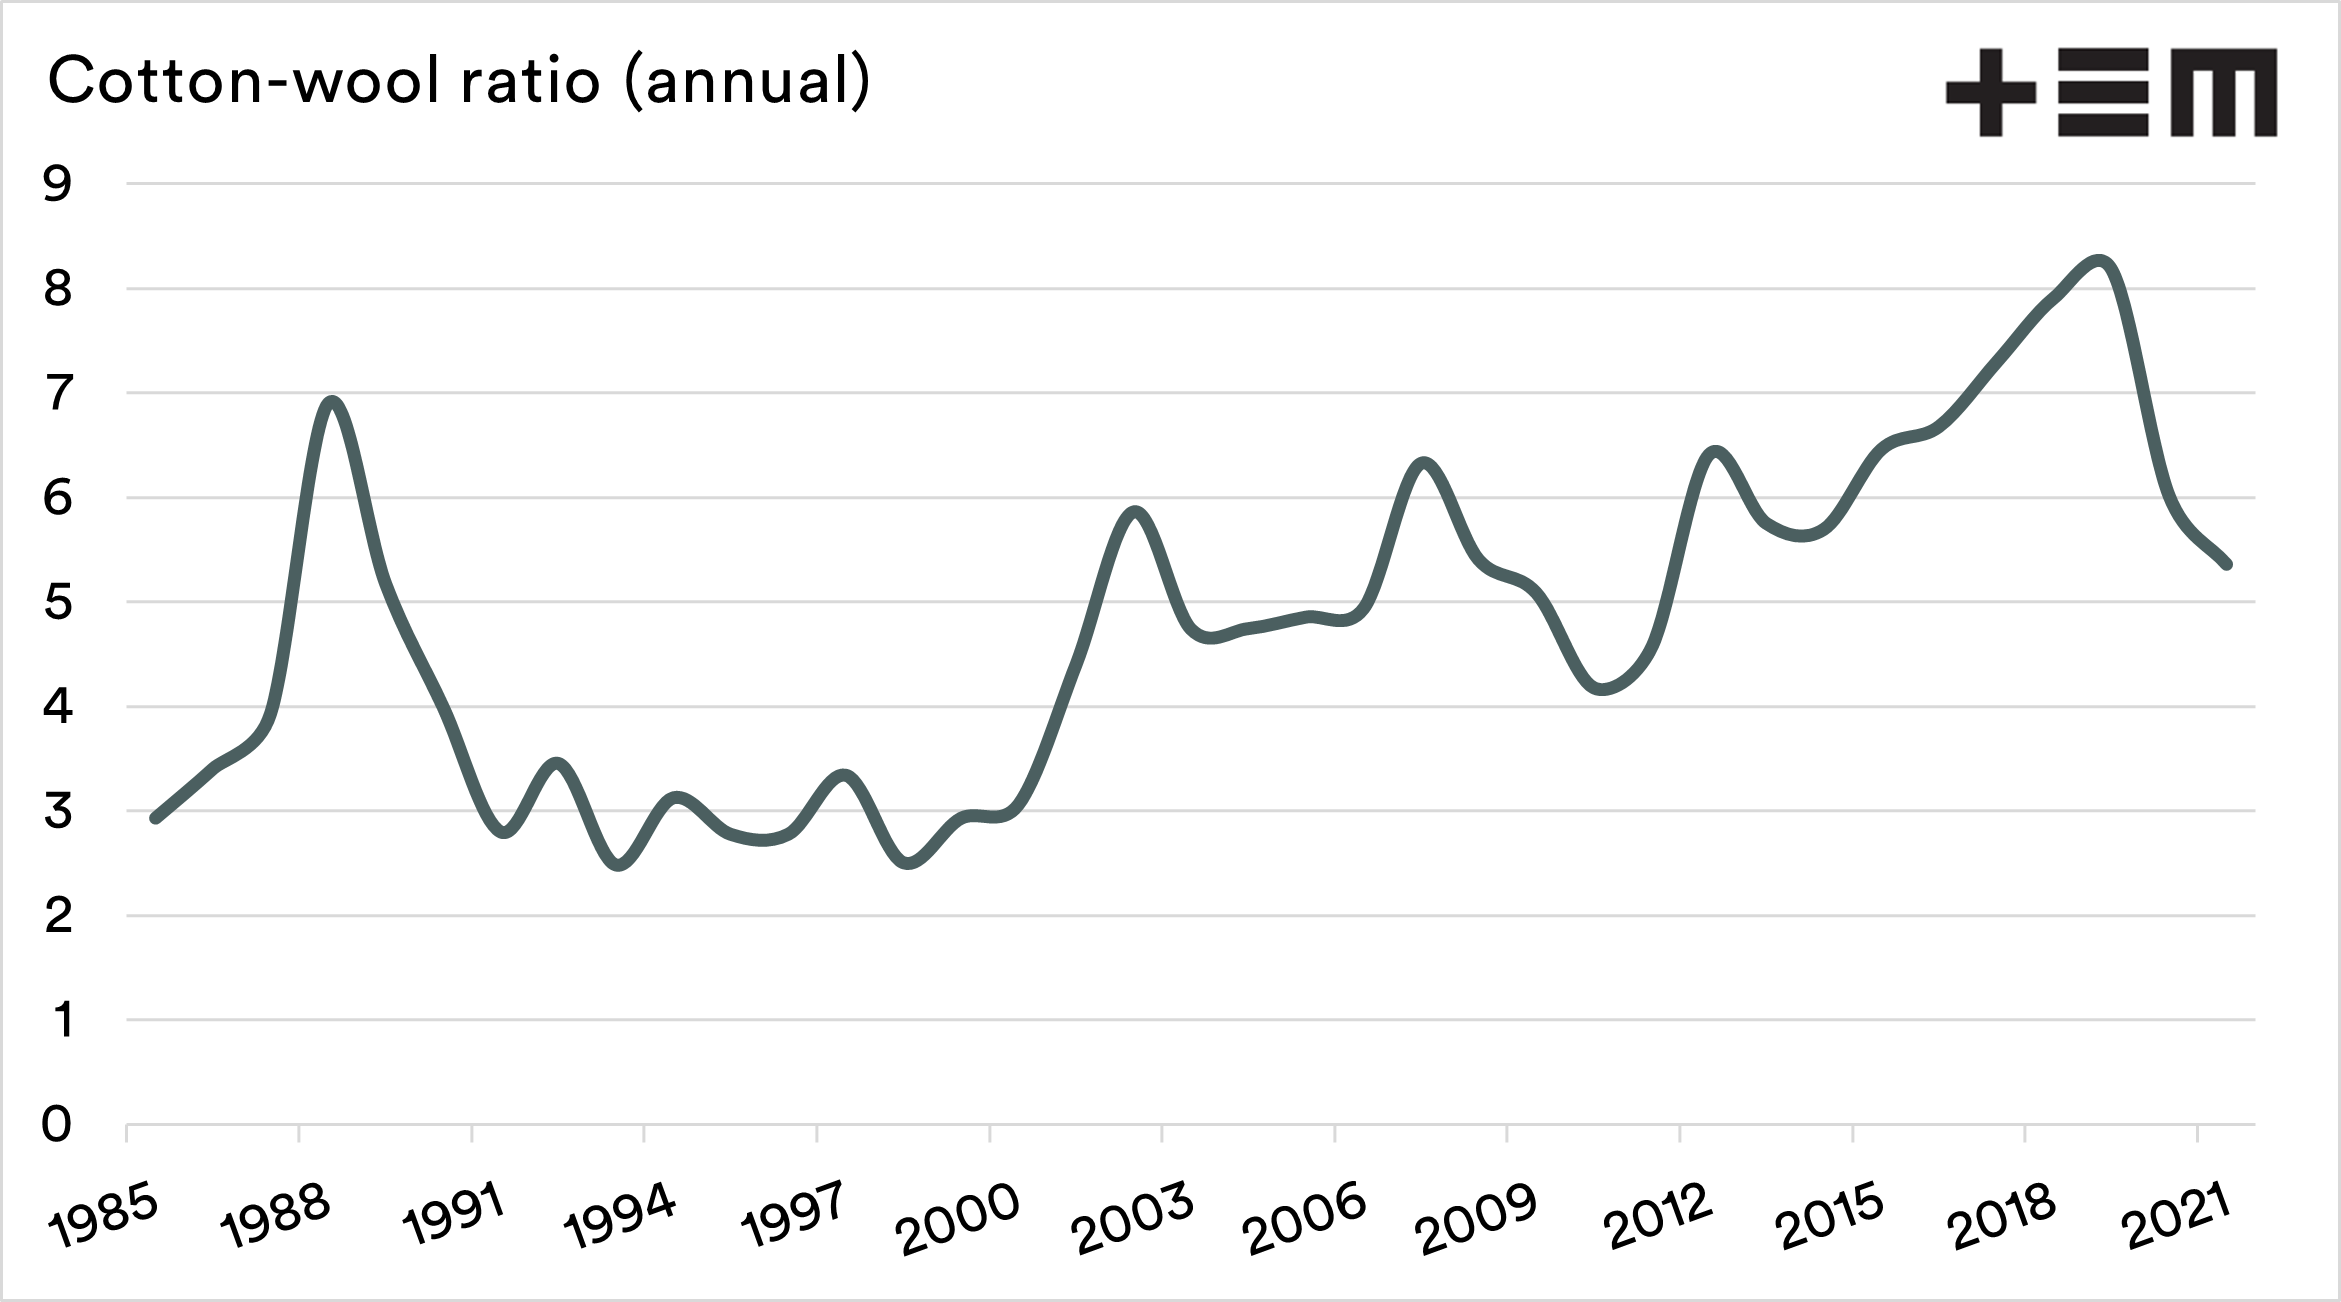
The last chart below shows the annual ICE-EMI ratio for the past 35 years. To provide some guidance, a ratio of 9 means that wool is 9x more expensive than cotton.
The chart shows an interesting timeline. There were two periods of stability and two large peaks (1988 & 2018/19).
The period 1991-2000 saw a ratio average of 2.9. This was the period immediately after the end of the reserve price scheme, which led to a period of sustained low wool prices. The period 2001-2016 saw wool prices gradually rise. The rise resulted in an average ratio of 5.4 for that timeframe.
The recent period of high wool prices since 2016 has seen the ratio rise to an average of 7.3 and an annual peak of 8.18 in 2019.
In 2020 the ratio dropped to 6, and so far in 2021 has averaged 5.3. Whilst we still have more than half a year left in 2021, the ratio is the lowest since 2011.
The question is whether a recovering economy will increase demand for high-quality wool, and therefore help boost back that ratio to recent highs.