Market Morsel: Getting cheap

Market Morsel
The Eastern Market Indicator (EMI) began to falter in late June 2022, easing by around 17% through to early October. At the same time the Australian dollar came off by around 11% creating some good value buying opportunities for offshore wool market participants.
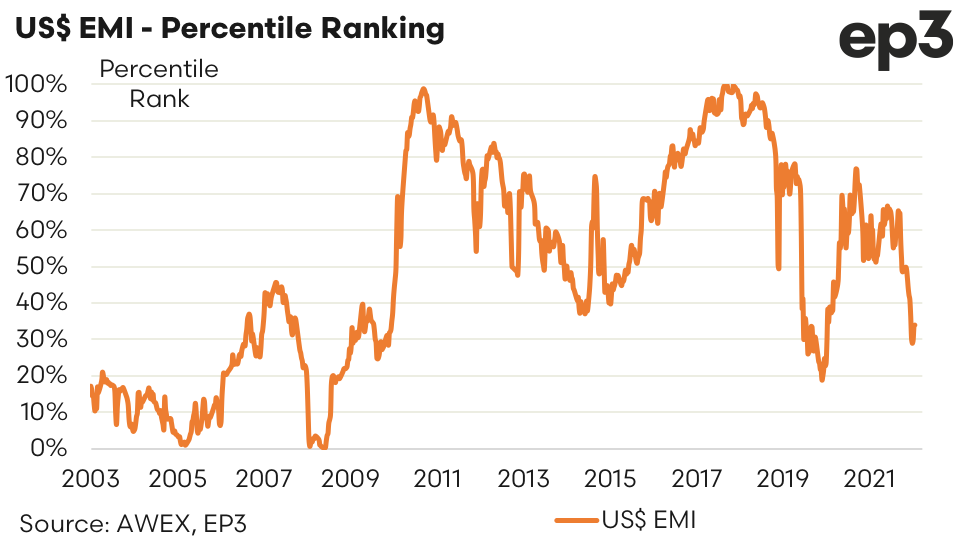
The percentile ranking chart for the EMI in US$ terms shows that in mid June 2022 Australian wool was sitting at the 64th percentile. A percentile ranking chart gives a quick visual representation of how expensive or cheap a commodity is relative to its historical price performance and a ranking at the 64th percentile means that since 2003 Australian wool prices in US$ terms have been more expensive 36% of the time and cheaper 64% of the time.
A combination of falling domestic wool prices and a weaker A$ from June 2022 to early October 2022 saw the US$ EMI percentile ranking dip under the 30th percentile. At these levels, Australia wool had been more expensive 70% of the time since 2003. During October Australian wool prices found a base ahead of 1200Ac/kg cln, rebounding to a high of 1323Ac/kg a fortnight ago. This week saw the A$ recover around 2US cents, dragging the EMI in A$ terms back to 1300Ac/kg.
For offshore wool buyers a ranking under the 30th percentile for the EMI in US$ terms provides some cheap purchasing opportunities not often seen. The wool price dipped toward the 20th percentile during 2020, but you would have to do back to before 2010 to see cheaper buying opportunities in USD terms.

