Market Morsel: I CU wool

Market Morsel
Last week before the Easter break up, we were asked by a client about alternate hedging options for wool and/or looking into other commodities as a lead indicator of wool.
At EP3, we are always happy to test ideas, so we thought it was worthwhile examining against a couple of commodities.
We discussed the close relationship between Chinese bonds and wool pricing (see here). It’s, therefore, worthwhile looking at commodities that have a close link with economic prosperity. Wool is a niche, expensive product compared to competitors like cotton or man-made substitutes. Therefore economic prosperity will have an impact on the capacity to pay.
One of the commodities thought of as a lead economic indicator is copper. It has long been established that copper performance provides an insight into the performance of the general economy. This is due to its use in many industrial and electrical processes.
If the copper market is rallying (increasing), it points to an improving economy and, hopefully, more disposable income.
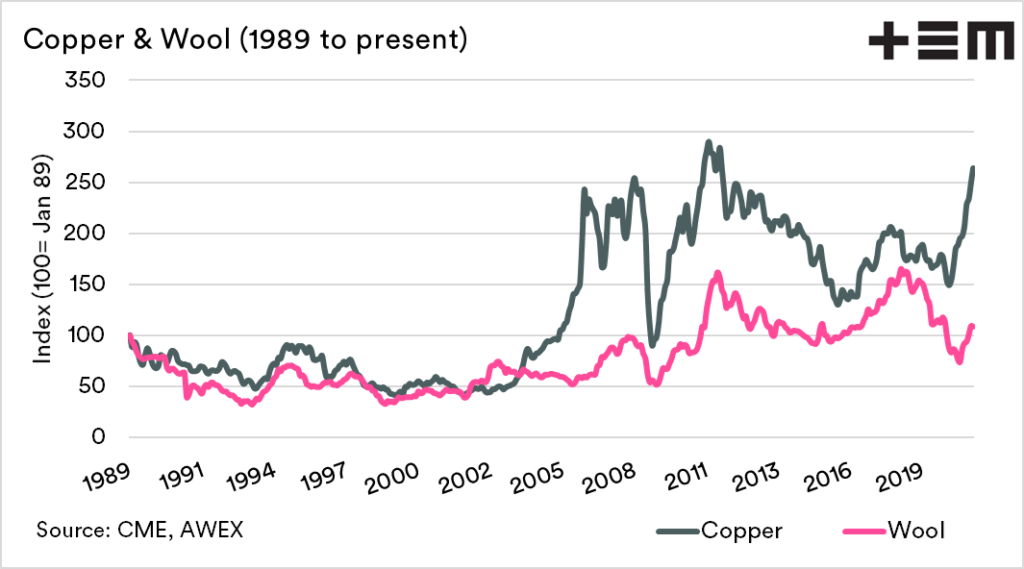
The first chart below shows copper and wool as an index (100= Jan 1989). As we can see, they both followed one another very closely until the GFC, when copper prices moved through the roof, wool did not have quite the same upwards trajectory.
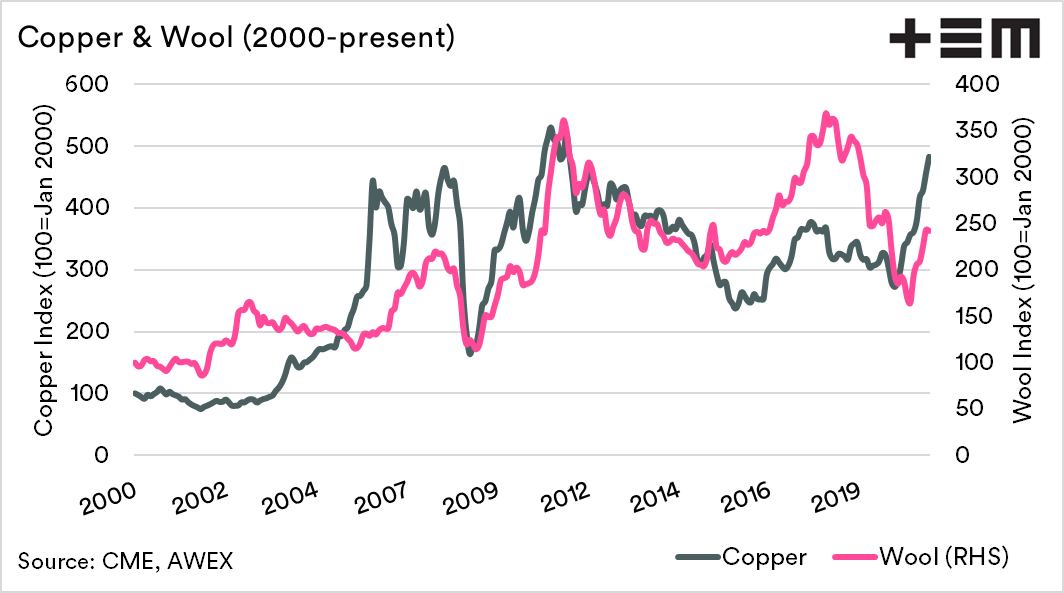
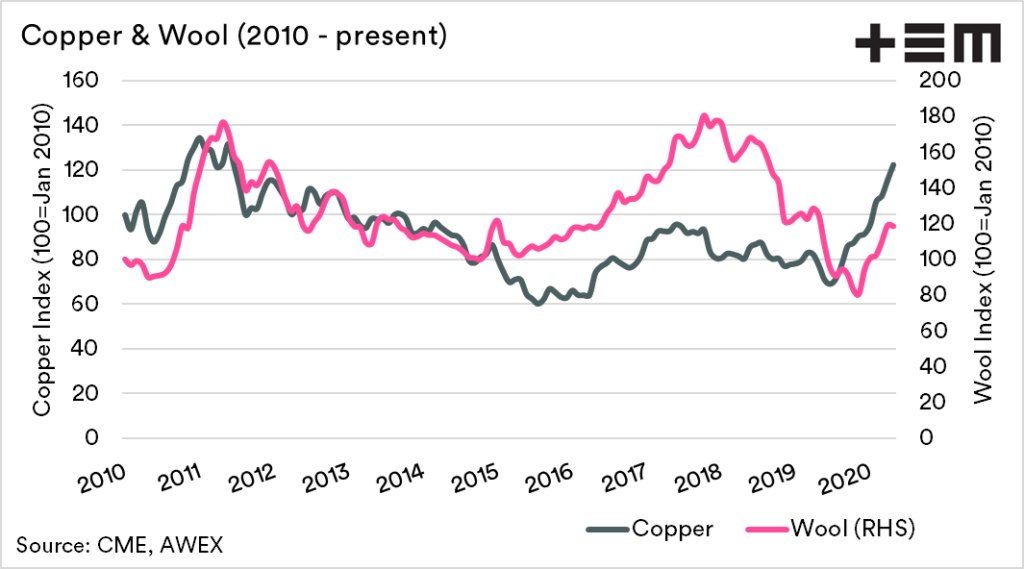
The second and third charts show the indexes both created at different timeframes (2000 & 2010). The wool market tends to follow similar patterns of rises and falls as the copper market.
The correlation on a monthly price basis between copper and wool since the 2000s has been 0.7, with 1 being perfect and 0 being no correlation. During the same period, wool and crude oil had a correlation of 0.52, and copper to crude was 0.82.
An improving copper market is a good sign for the wool market, and many other commodities.