The real story of wool

The Snapshot
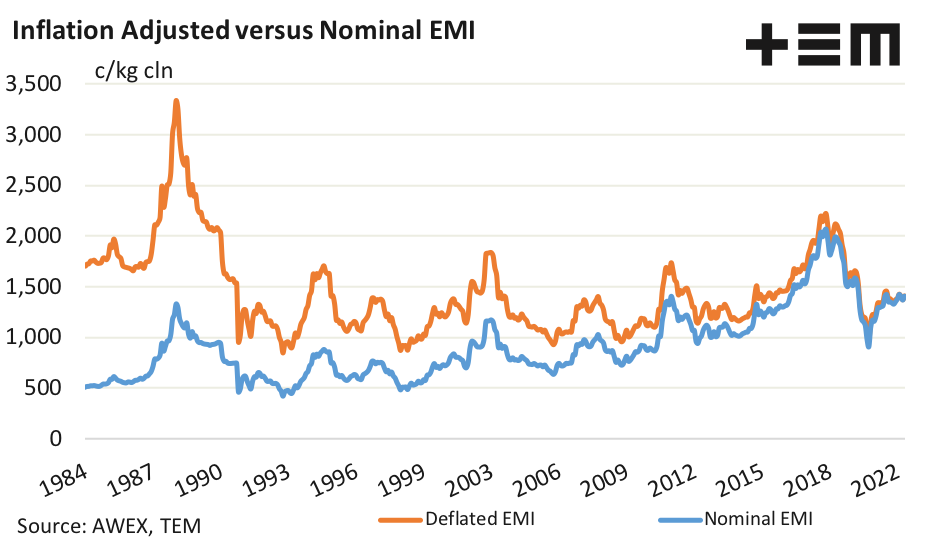
- In April 1988 the EMI reached a peak of 3337c/kg cln, once nominal prices are adjusted into 2022 dollar values.
- The current EMI of 1409c/kg cln is nearly 58% under the deflated peak from 1988.
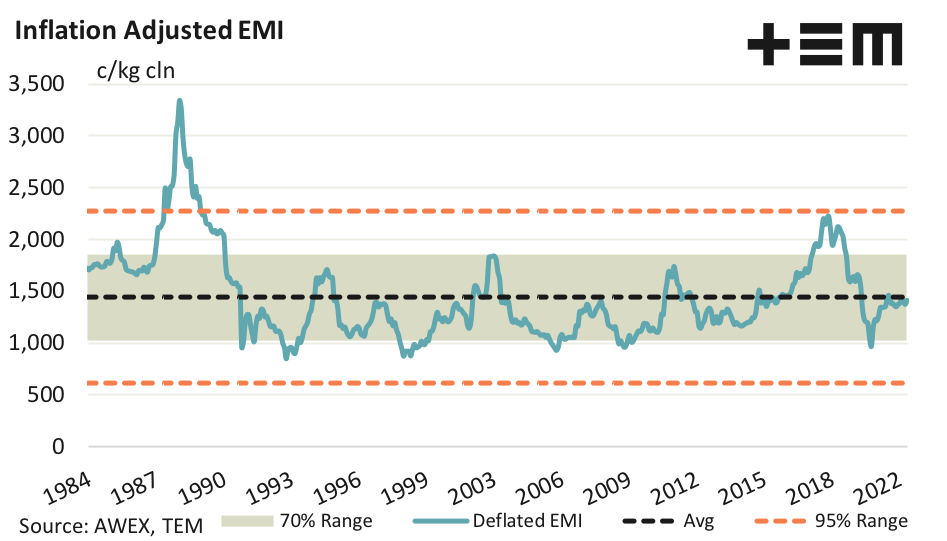
- Since 1983, the long-term average deflated EMI sits at 1444c/kg cln, so current values are just 2.4% below the long-term deflated level.
- Over the last four decades the inflation adjusted EMI has spent 70% of the time trading within a range of 1030c/kg to 1860c/kg cln, in 2022 dollar values.
The Detail
After publishing some updated deflated cattle and lamb/sheep analysis the requests for more historic inflation adjusted prices came in from our subscribers, so we’ve added a few more upon request.
The Eastern Market Indicator (EMI) made nominal highs during the 2018 season, rising to a high of 2068c/kg cln on an average monthly price basis in September of 2018. In 2022 dollar values, this high translates to 2220c/kg cln, so the current EMI of 1409c/kg is 36% off the most recent deflated high.
However, back in April 1988 the EMI reached a deflated peak of 3337c/kg cln, or in 1998 (nominal) dollar values it was at 1331c/kg cln. The current EMI is nearly 58% below the 1988 deflated peak.
Statistical analysis of the deflated EMI since 1983 highlights the long-term average deflated EMI sits at 1444c/kg cln, so current values are just 2.4% below the long-term deflated level. Over the last four decades the inflation adjusted EMI has spent 70% of the time trading within a range of 1030c/kg to 1860c/kg cln, so this could be considered it’s “normal range”.
Movements in the EMI above 2273c/kg or below 615c/kg would be considered extreme, having occurred less than 5% of the time in the last forty years.