
A chart for all seasons

The Snapshot
- Seasonality charts provide an indication of current pricing versus the same period in previous years.
- It is sometimes possible to see patterns emerge, to assist in future planning.
- Agricultural commodities due to their production cycles have quite clear seasonality.
- Examining seasonal patterns can assist in formulating a risk management / marketing plan.
The Detail
Examining the seasonality of a commodity indicates the performance of a commodity compared to past periods. These charts are a valuable tool to use in conjunction with others, for instance, deciles. They can be used to determine whether commodities have a seasonal pattern. This seasonal pattern can then be used to assess trading opportunities.
In these charts, a 70% or 1 standard deviation is used to show the seasonal pattern for pricing.
The 70% banding removes the extremes in pricing, which provides a better indication of the seasonality, as opposed to a min/max, which can be extremely volatile.
First of all, it is essential to note that charts show the history of a price, and that adage ‘past performance is not an indicator of future performance’ must be remembered. The seasonality charts provide an indicator of where the current price compares to the same period during past seasons. Through examining seasonality, we can determine whether there is a part of the year when pricing grain tends to be higher (or lower).
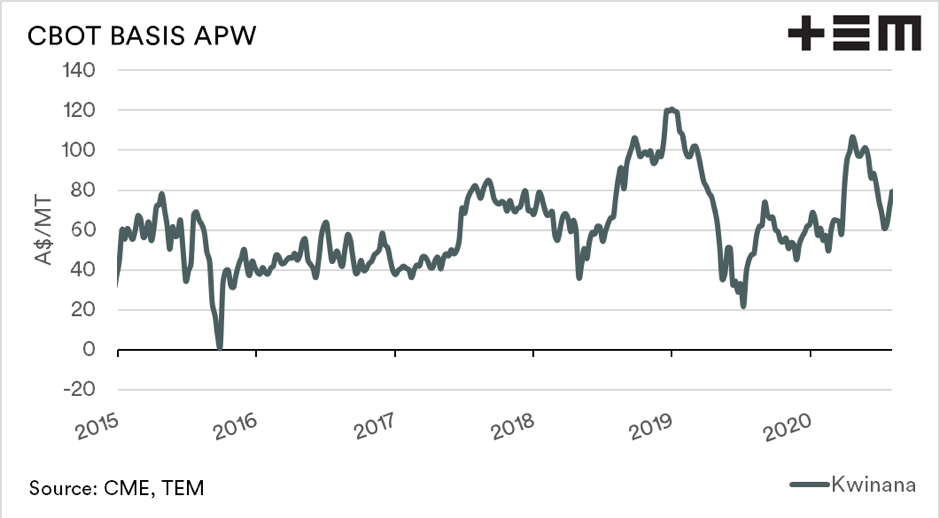
In the chart below, the basis level from 2015 to present in the Kwinana port zone is displayed. This chart provides some value as it shows us the peaks and troughs; however, in reality, it is quite hard to see whether there is any solid pattern.
In the seasonality chart below, the same data from above is shown. However the banding and average line provides an indication of when prices have increased (or decreased) during the season. In this example, there is a pattern of basis levels increasing slightly during the middle of the year and remaining higher through to harvest.
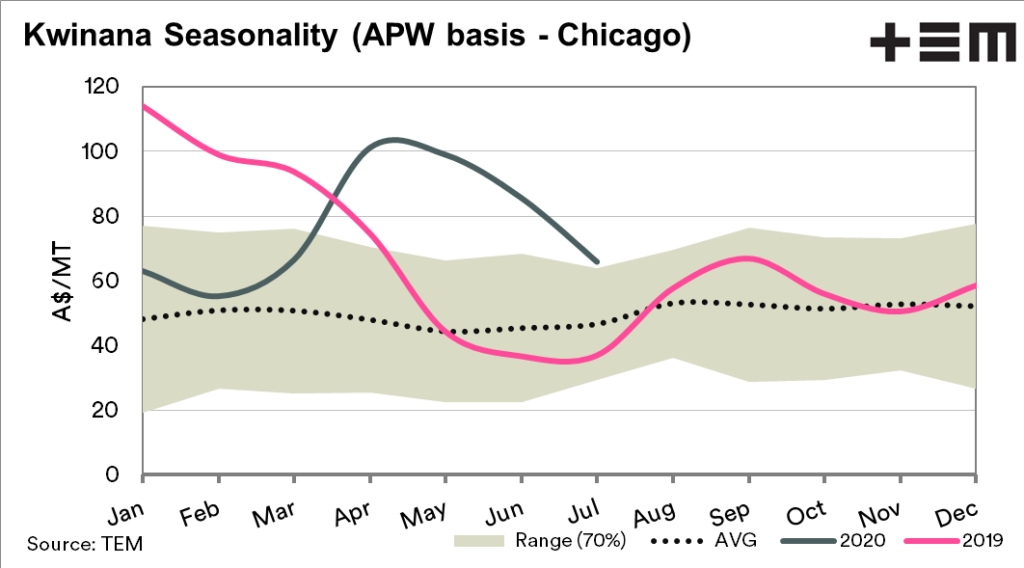
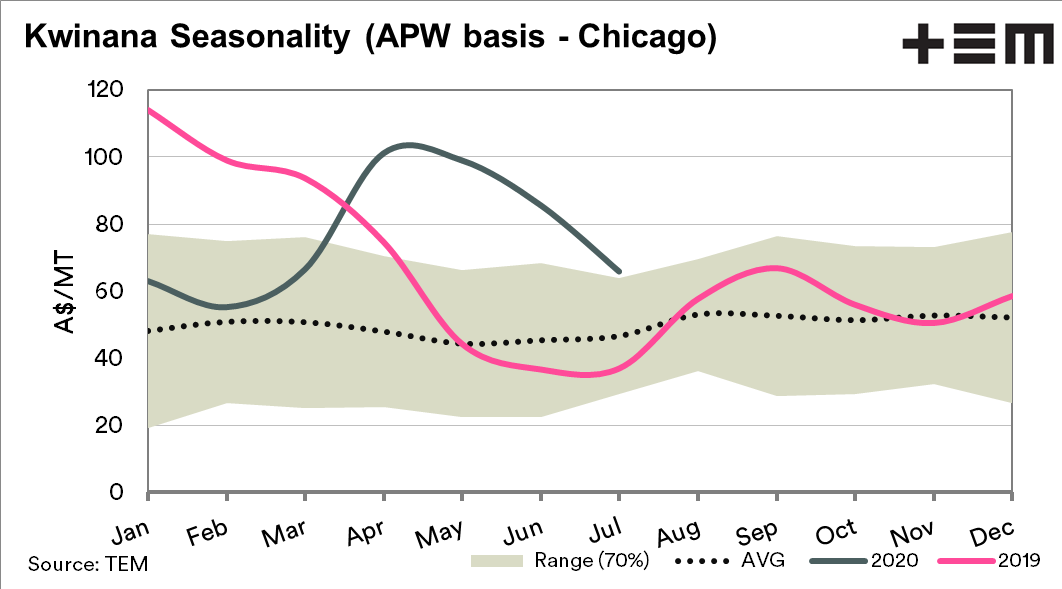
The rise in basis level makes logical sense. Basis levels in Australia are determined by local production. If we have poor production, the basis level will rise sharply. Conversely, if production becomes more assured, then the basis level will decline.
At EP3 we are building our datasets with the help of our partners and will be regularly publishing analysis of seasonality in order to assist in the decision making process.