Are deciles useless when marketing grain?

The Snapshot
- Deciles (or percentiles) are useful for getting a quick view of the market.
- The current extremes in pricing levels are making them less useful as a decision-making tool.
- The difference between the 90th and 100th decile is huge.
- A 100th decile price would traditionally be considered a sell signal.
- When the market is rallying, the 100th decile in the space of a week can change dramatically.
- Deciles should never be used in isolation, they should be used with other tools to form a view of the market.
- Never rely on deciles for decision making, especially in the current market.
The Detail
Decile tables are a helpful tool for getting a swift view of the market but are they losing their value as a tool for decision making during these extreme times?
Let’s start with an explanation of a decile table and how to use them.
The decile table below has a selection of futures contracts for the period 2010 to the present. The minimum and maximum are the highest and lowest prices experienced during the period.
In normal times, this is quite a helpful tool for making decisions. If it is high 90%+ then that is a clear sign to sell; when it is low, it is a clear signal to buy.
Quite helpful, as a quick tool – but they have lost their usefulness at the moment. Why?
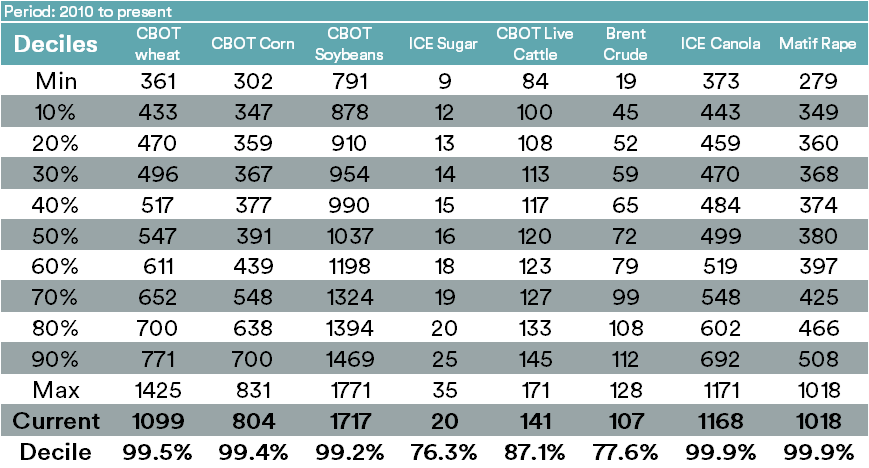
If we look at the difference between the 90th decile and max in wheat, there is a huge range. The 90th decile is at 771¢/bu whilst the 100th decile is at 1425¢/bu. It is the extremes at present that are reducing the efficacy of deciles.
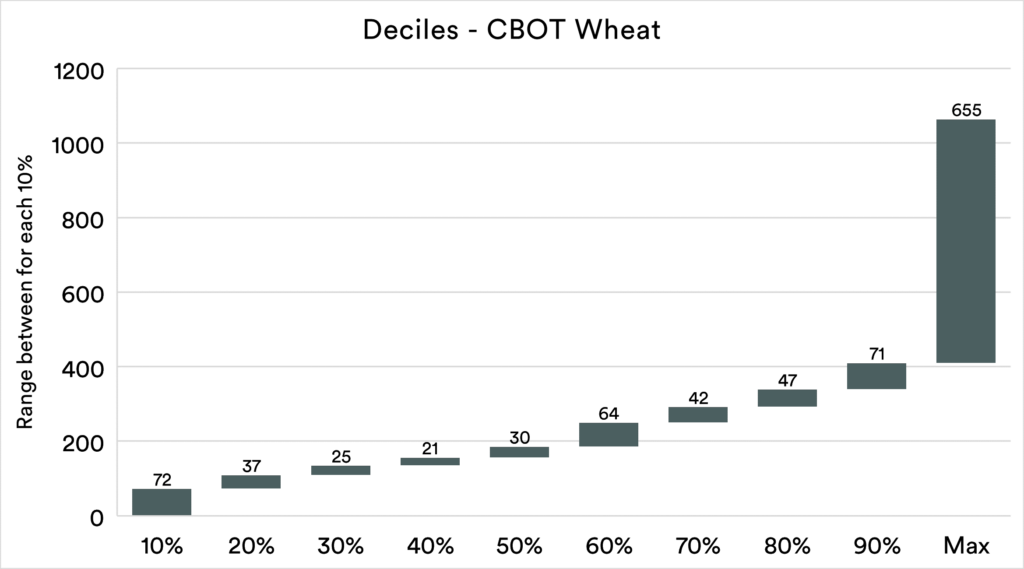
The chart below shows just how large the difference (in ¢/bu) is between the 90th and 100th decile.
Technically the 90th decile is a great price historically, but not when the market is at extremes like the present.
When the market is rallying hard, the 100th decile one day could be a poor price a few days later and lead to selling regret.

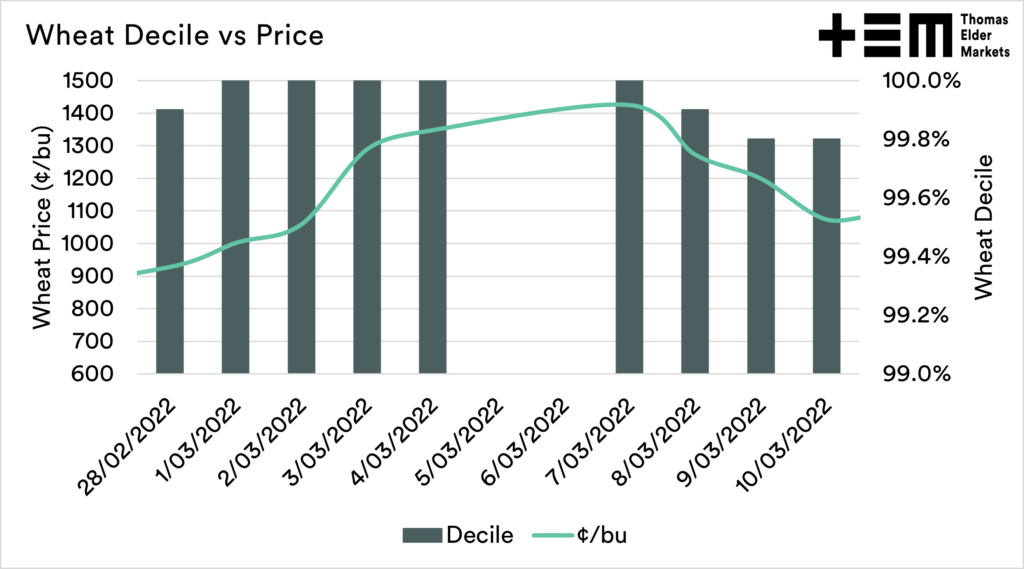
100th percentile is a clear sign to sell, right? Let’s look at the chart below, which shows the trading of wheat from the 28th of February to the 10th of March.
The decile bar is the level it was at on the day compared to the period 2010 to the present. So each day, it recalculates.
On the 1st of March, the price was 1001¢/bu, and the 100th decile. The next day the market was 1058¢/bu and the new 100th decile. This continued for a number of days until the new 100th decile was 1425¢/bu on the 7th.
So suddenly, and in hindsight, the 100th decile wasn’t all that attractive on the 1st of March. Selling based on the 1st and the 100th decile alone would have led to sellers’ regret.
This means we cannot rely on deciles, at least not in isolation. The 100th decile would be considered to be a selling signal, but in this example, the price changed by 42% between the 1st and 7th of March, setting a new 100th decile each day.
It is too simple to use deciles on their own. They supply quick information but only tell you how the market is compared to the past.