Beans, beans, good for the heart.

The Snapshot
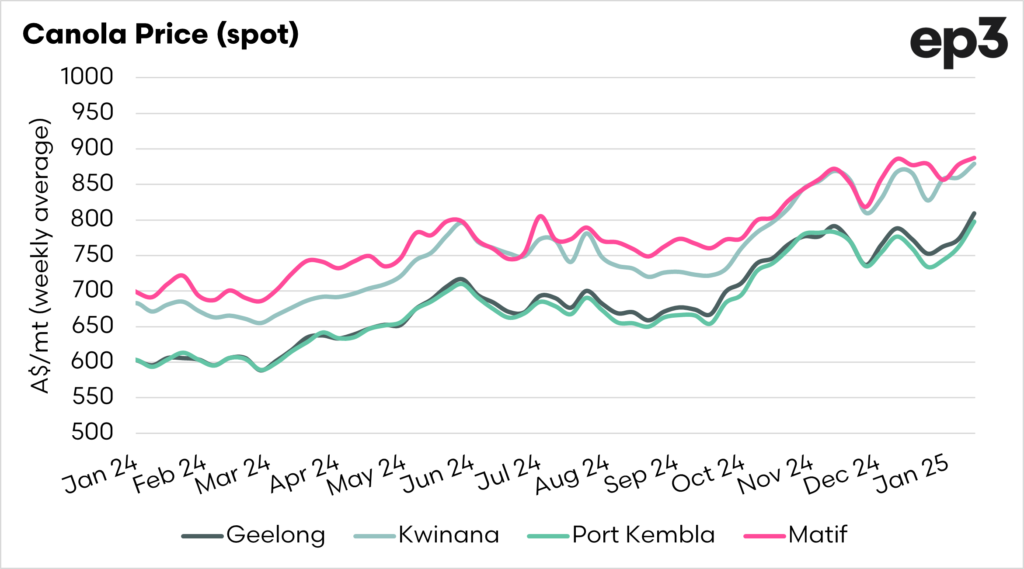
- Canola prices have risen in the past few months, which has been beneficial for Australian farmers.
- The USDA provided a big drop in US soybean production as a result in a 1bpa drop in yield.
- If we drill down, soybeans globally are telling a different story.
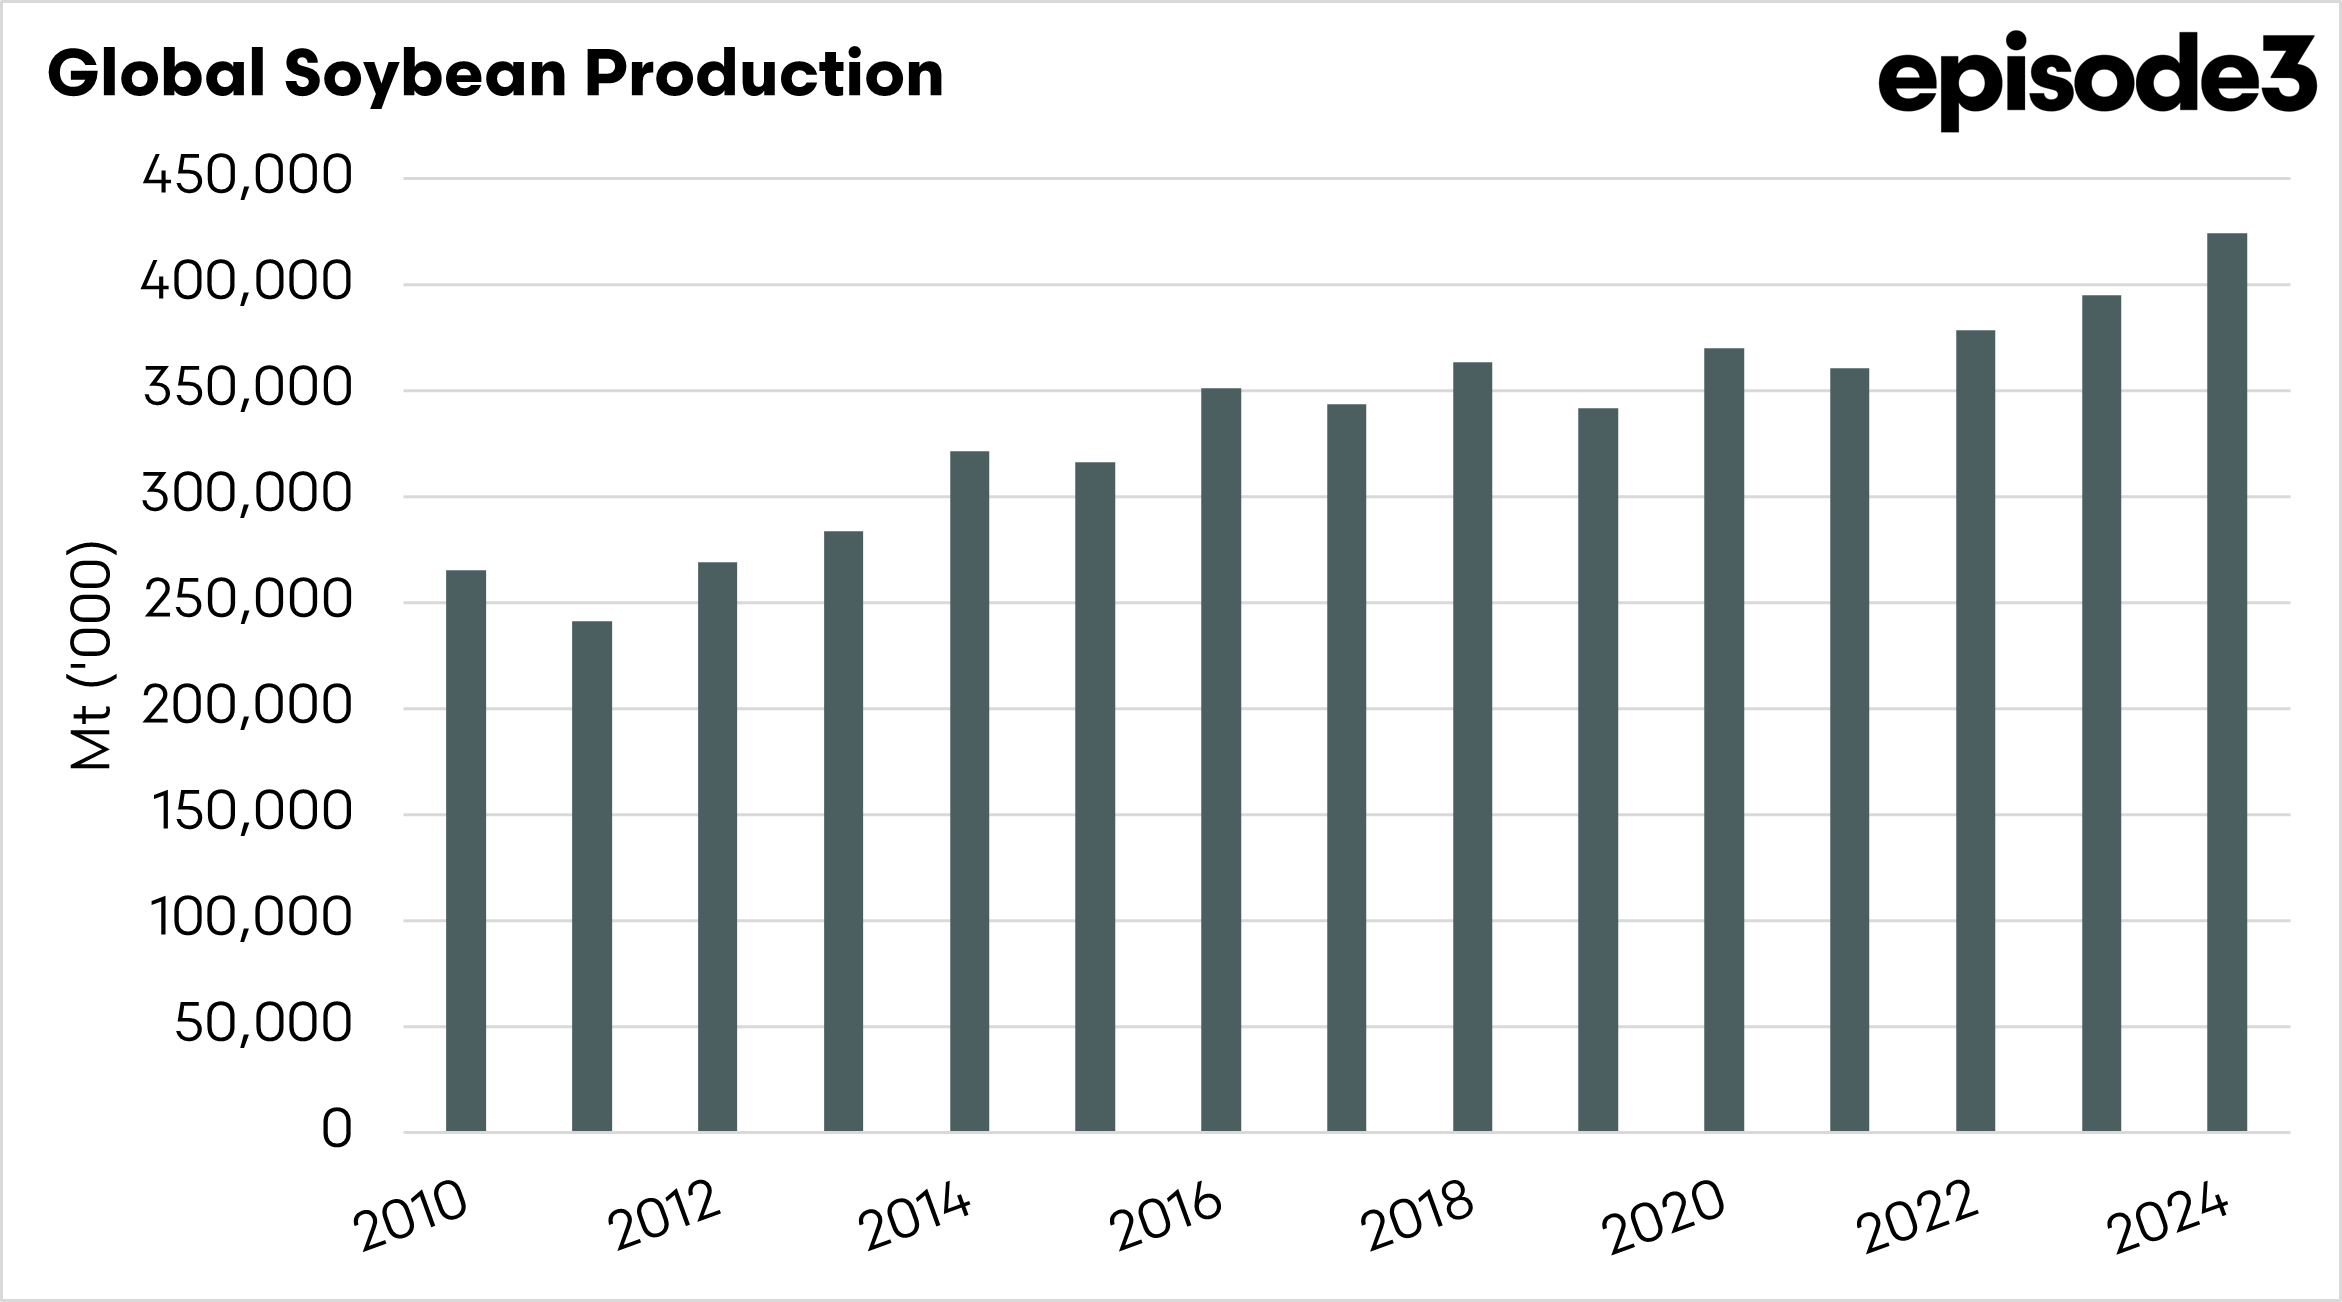
- The production and end stocks are at record levels.
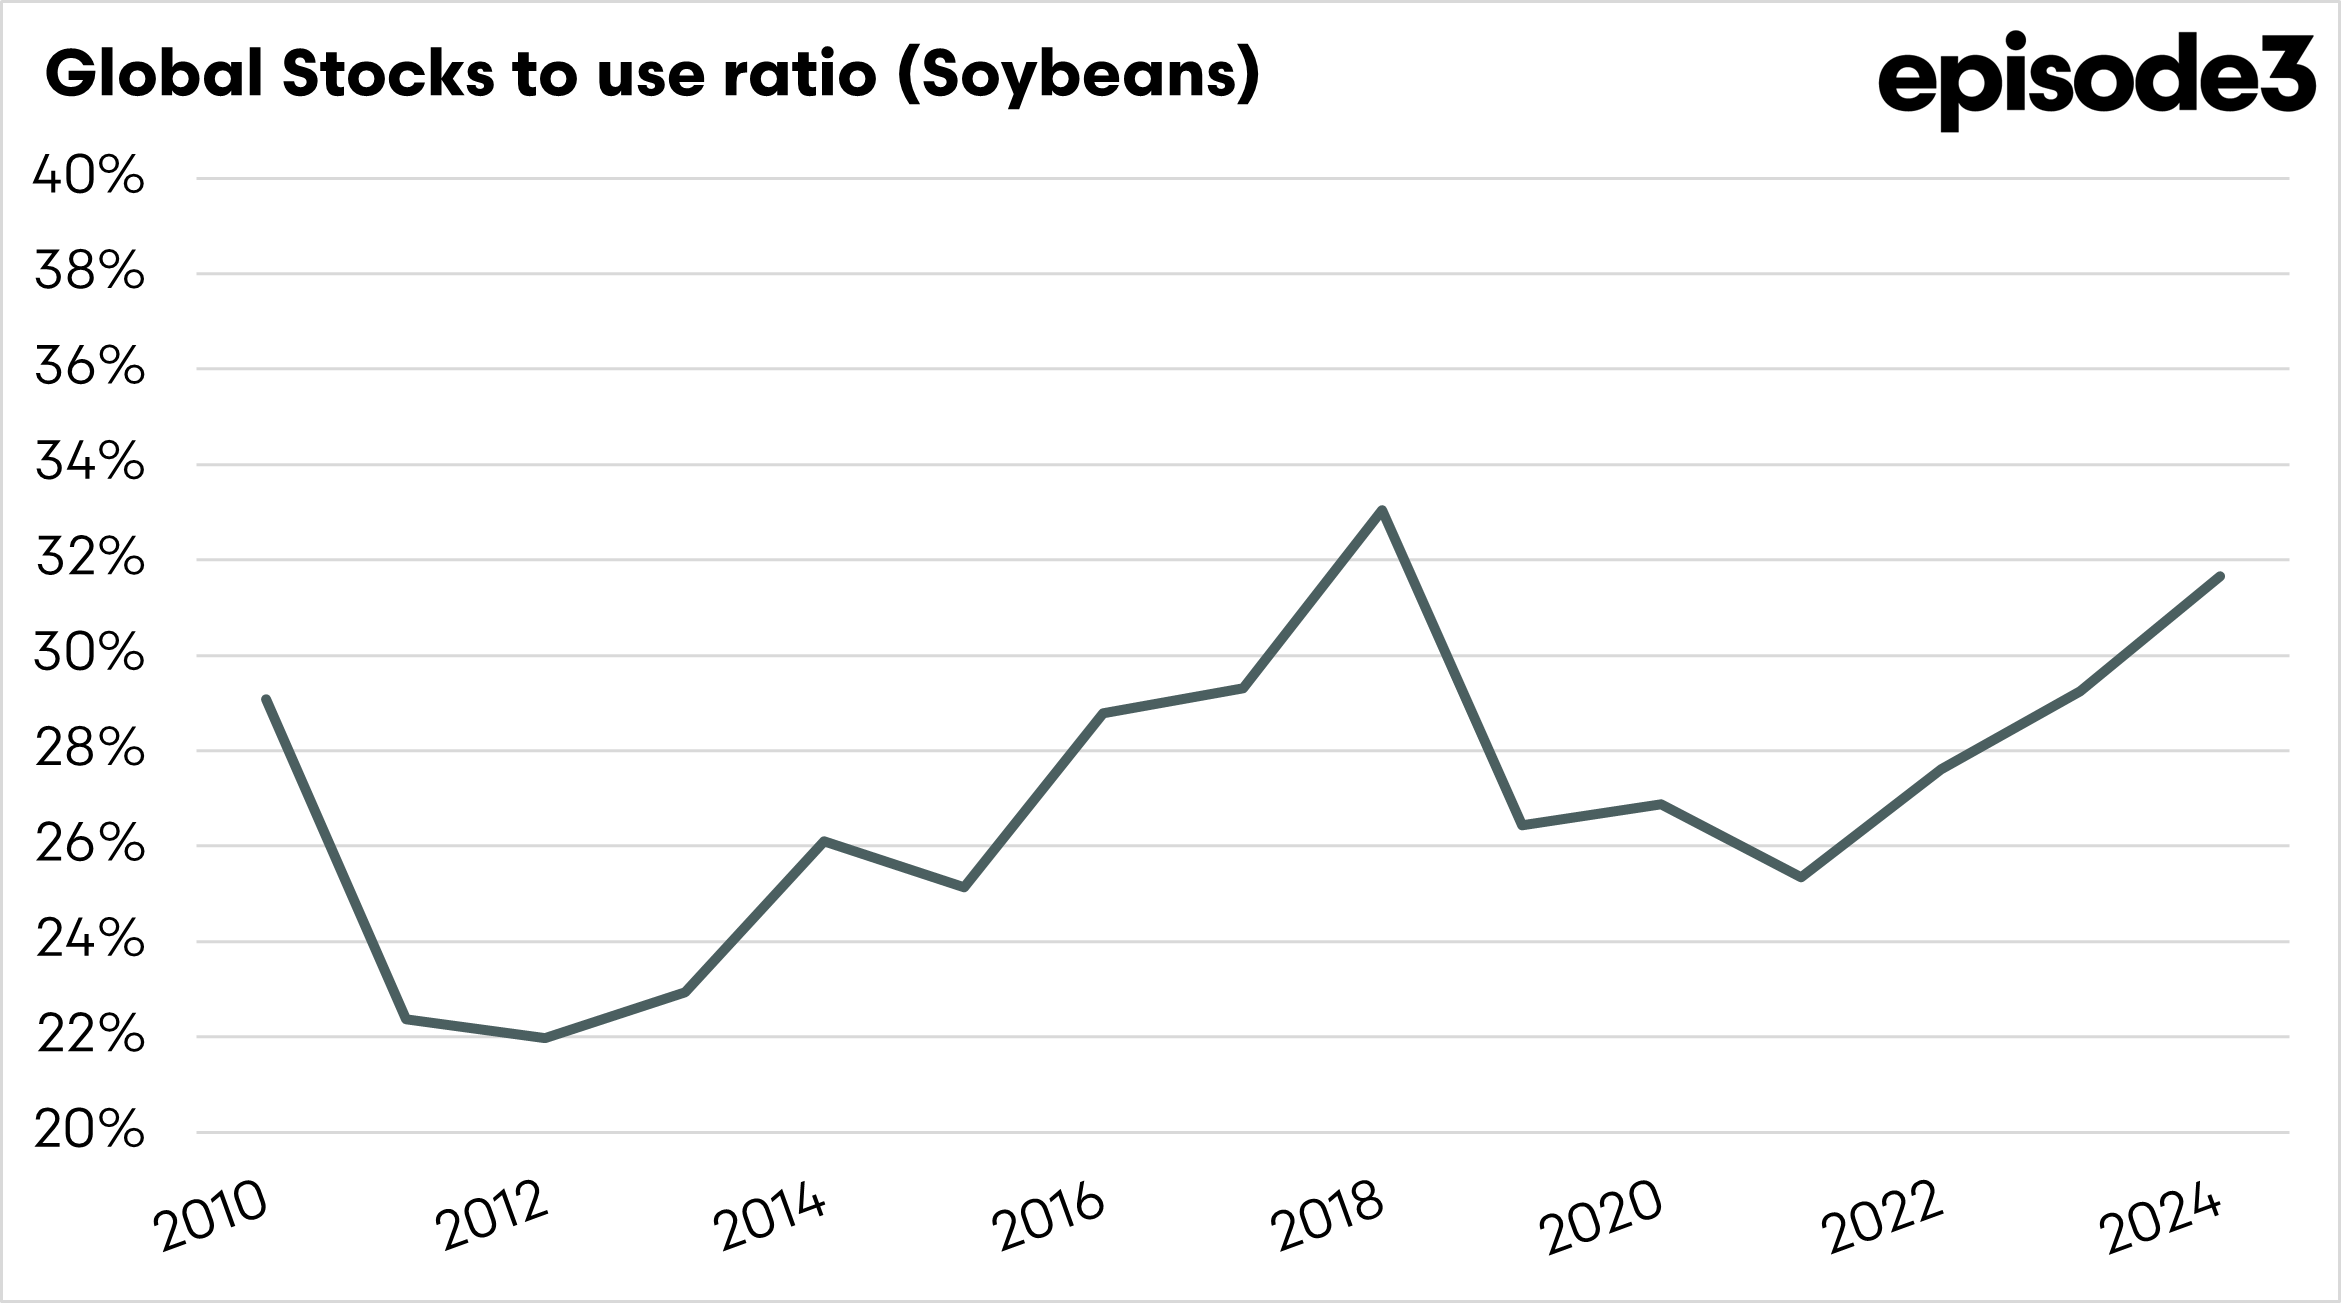
- The stock-to-use ratio, which measures both supply and demand, has had the highest level since 2018.
The Detail
Canola prices have improved significantly since October, which is good news for Australian farmers who sell most of their canola during harvest. One of the bullish factors in recent weeks has been the surprise change to forecasts for the soybean crop between December and January. Soybean futures rose after US yields were dropped by a higher rate than the trade expected.

I thought it was worthwhile looking a bit deeper into the numbers. In the chart below we can see the production of soybeans globally, and this year is set to be a record, far eclipsing last year, at a 7% increase.
This isn’t the whole story, as there is more to price direction than supply; demand also is a major component, and demand generally increases each year.

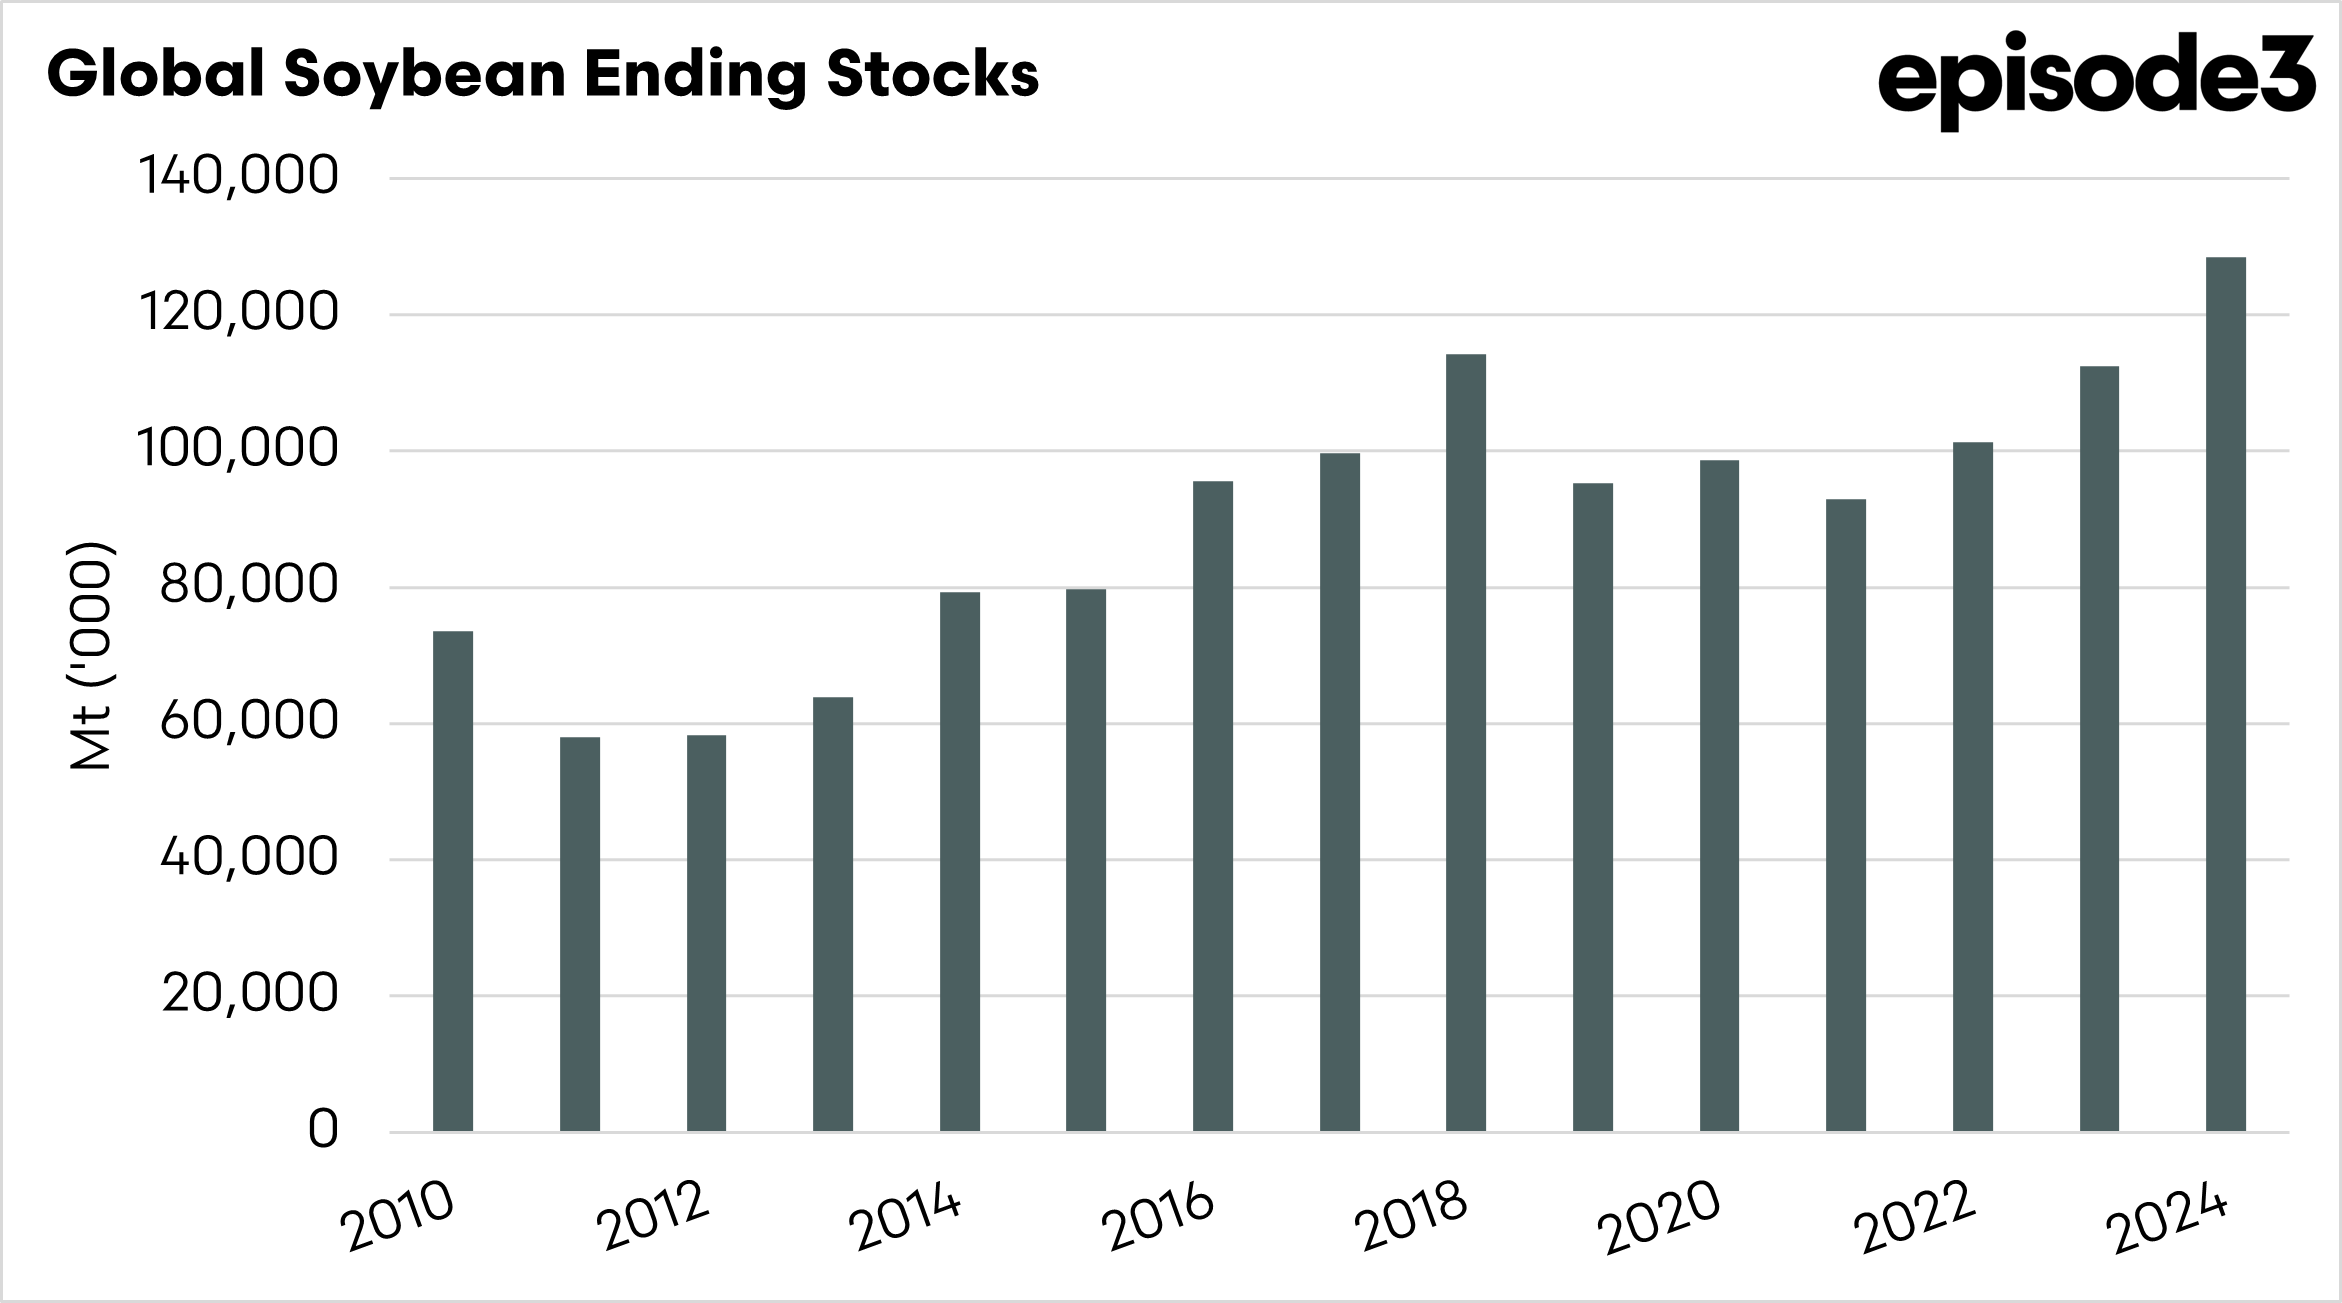
So let’s take a look at ending stocks and the demand side of the equation. In the chart below, we cans ee the global ending stocks.
This is a similar picture to the production record levels of ending stocks. The end stocks at the end of this marketing year are 128mmt. Last year they were 112mmt.
So this shows us that stockpiles are increasing, and consumption is not keeping up with production.

The stocks-to-use ratio is a simple tool that helps farmers understand the balance between how much of a crop (like oilseeds) is left over (stocks) and how much is being used (demand). It shows how tight or plentiful the supply is. A low ratio means there isn’t much supply compared to demand, which can lead to higher prices. A high ratio means there’s plenty of supply, which can cause prices to drop.
The chart below displays the global stocks to use for soybeans. The ratio is currently 32%, which is the highest ratio since 2018 when it was 33%.
On a global level, this ratio should point to lower pricing instead of higher pricing because there is a comfortable volume of soybeans.
We want to keep a close eye on this as we move into the year. As oilseeds operate in a complex of competing seeds, with soybeans having an extremely high influence on pricing direction.
In the coming days, I will delve a little further into this, focusing specifically on canola. Remember to sign up to keep getting access to this information.