China turns on the vacuum
The Snapshot
- China has to prioritise US agricultural commodities to meet its phase 1 obligations.
- Exports of many agricultural products are ramping up (more here)
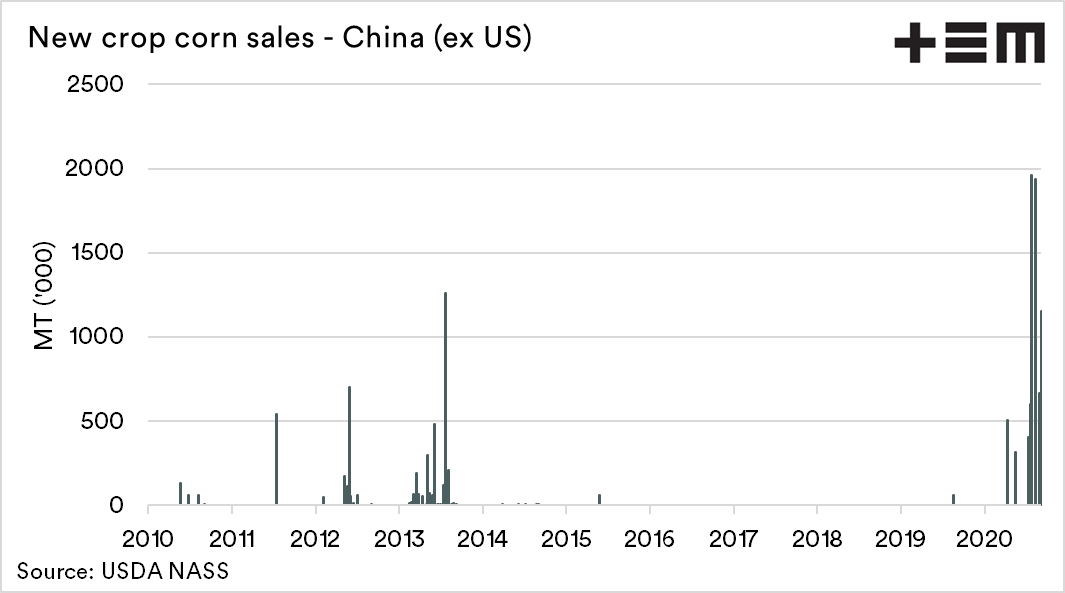
- 7mmt of new crop corn has been sold to China since July.
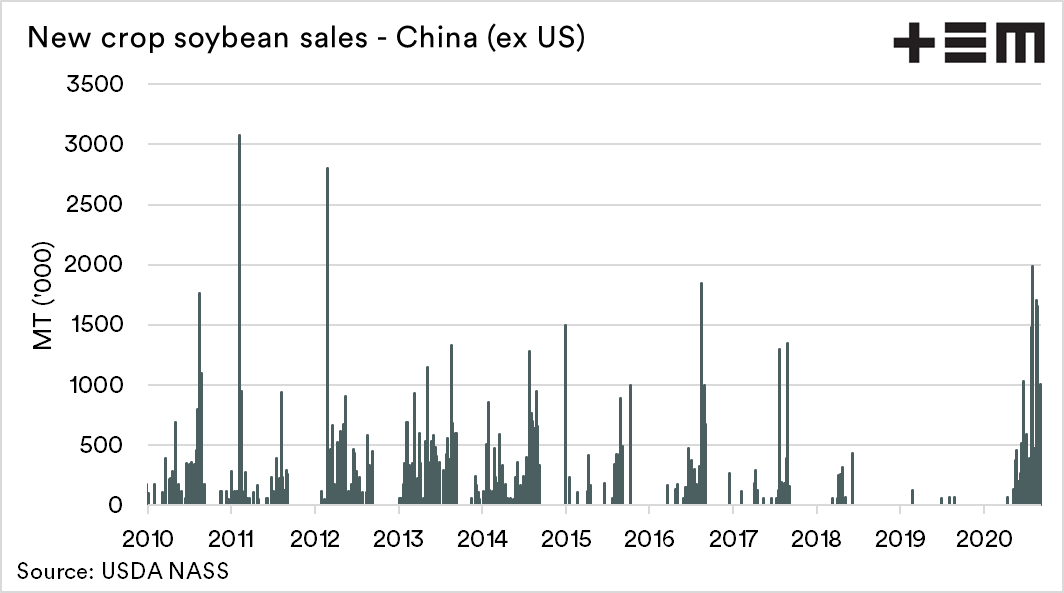
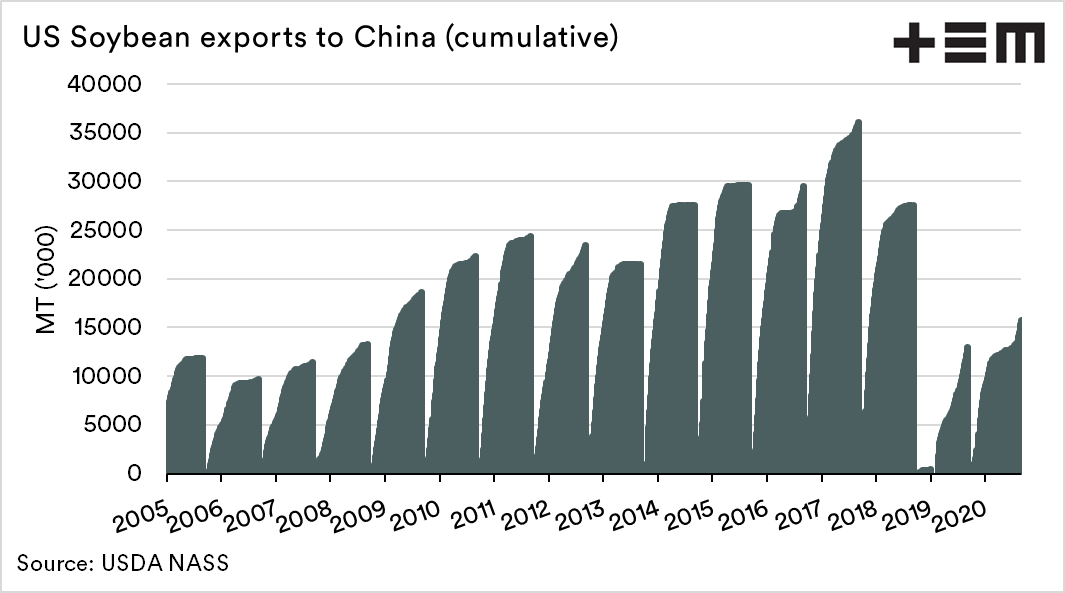
- 10mmt of new crop soybeans have been sold to China since July
- China is currently 44% behind the pace required to meet obligations.
- The movement of trade flows of soybeans from America to Brazil when tariffs hit makes for a lesson for Australian agricultural producers. Trade flows do change.
The Detail
It is only 8 weeks until the US election. It doesn’t seem that long since Donald won the election, and started the trade scuffle with China.
The back and forth action between the US and China lead to trade tariffs being applied to a large volume of US agricultural products. This was a good move by China, as it hurt large swathes of Trump’s voter base.
As the two giants came to the negotiation table. Although the relationship seems very far from happy matrimony, they arrived at an agreement.
In early 2020 China signed the ‘phase 1’ trade deal with the USA to purchase a target of US$40bn in agricultural produce during 2020, to bring a stalemate to the festering trade scuffle between the two giants. This target was an astronomical task considering that in 2017, US exports to China only reached US$23.8bn. If China was to achieve the objectives set, then US produce would have to be prioritised.
The outbreak of COVID hasn’t helped with meeting the levels set in the agreement. China is currently 44% behind the pace required to meet the requirement (here). They are however starting to vacuum up US agricultural products.
The USDA provides regular updates on export progress and export sales. This is a valuable service and one which would be appreciated if the Australian government provided the same. Let’s take a look at some of these numbers.
Corn
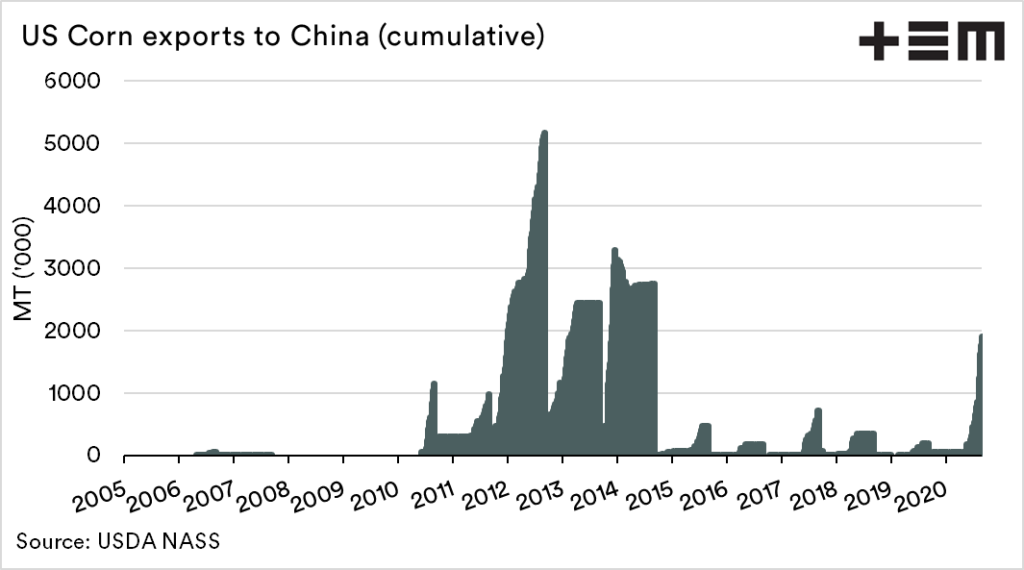
Corn exports to China from the United States have been moving at a solid pace this year. The chart below displays the cumulative export pace for each year since 2005.
This season’s exports have been the highest in recent years at a current level of 1.9mmt. This is surprising given the impact of African Swine Fever, reducing demand, and the relatively high local stocks. China does have the capacity to store, and at the current low pricing, this makes sense.

The new crop sales for corn have also been extremely strong since July, with two weeks adding 1.9mmt of sales for the new season. These are extreme levels and sets up a solid export program to China for the coming season.

Soybeans
Soybeans were the most affected commodity in the trade scuffle, with China moving imports to Brazil. In the chart below, we can see that generally, imports were increasing in quite a linear fashion from 2005 onwards. This stopped in 2018, and trade flows switched to Brazil. This is a good lesson for Australia when it comes to our trade with China, it can move to other origins easily.

If China is to meet its phase 1 obligations, soybeans are the key. We can now see a huge uplift in new crop sales versus the trade tariff years. On average in July and August, 1.1mmt has been sold to China. The same period last year was 134kmt – in total.