Corn on the cob.
The Snapshot
- Wheat and corn tend to follow one another due to their interchangeability.
- Global corn stocks hit their peak in 2016.
- Corn stocks in China are strong (on paper).
- At a time of high corn stocks China has ramped up its imports of corn.
- The US is the largest exporter corn.
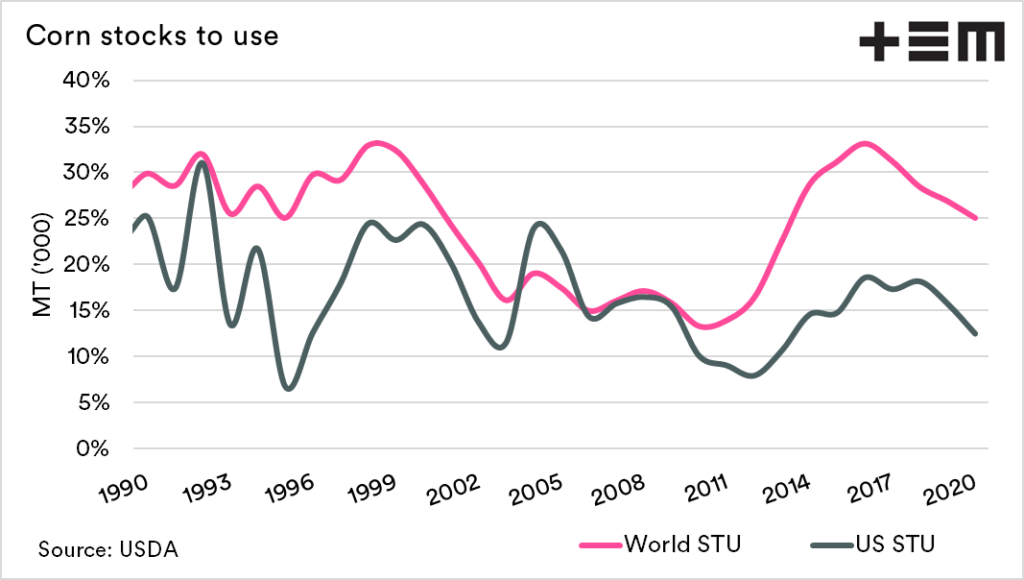
- The US stocks to use ratio has dropped to 2013 levels.
- The grounding is in place for the northern hemisphere risk period.
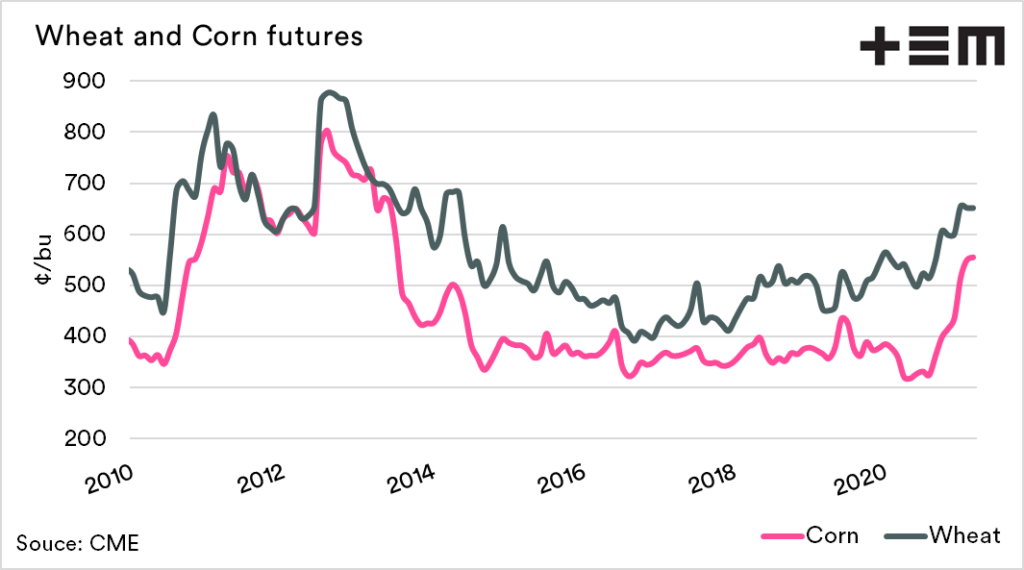
The wheat & corn market are both interrelated. When one moves, the other follows. They both have qualities that can be exchanged, i.e. use in animal feeds.
During the past year, the wheat market has been at the mercy of events in the corn market. This has been beneficial, as a rising tide lifts all boats.
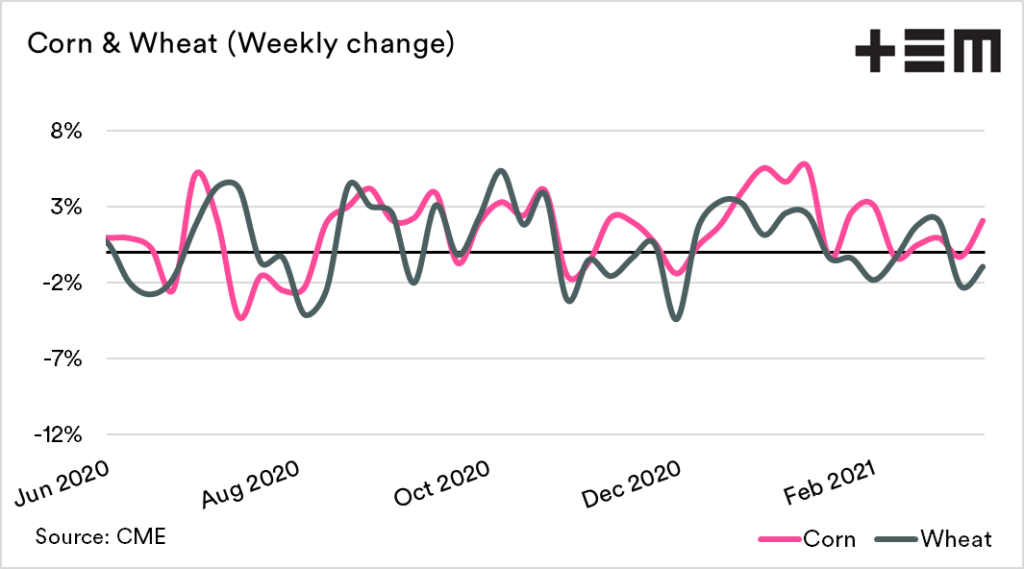
The first chart below shows the monthly average price for wheat and corn (CME futures) from 2010. As we can see, they tend to follow each other with a close relationship. The second chart shows the weekly change (as %) in the price for each since June last year.


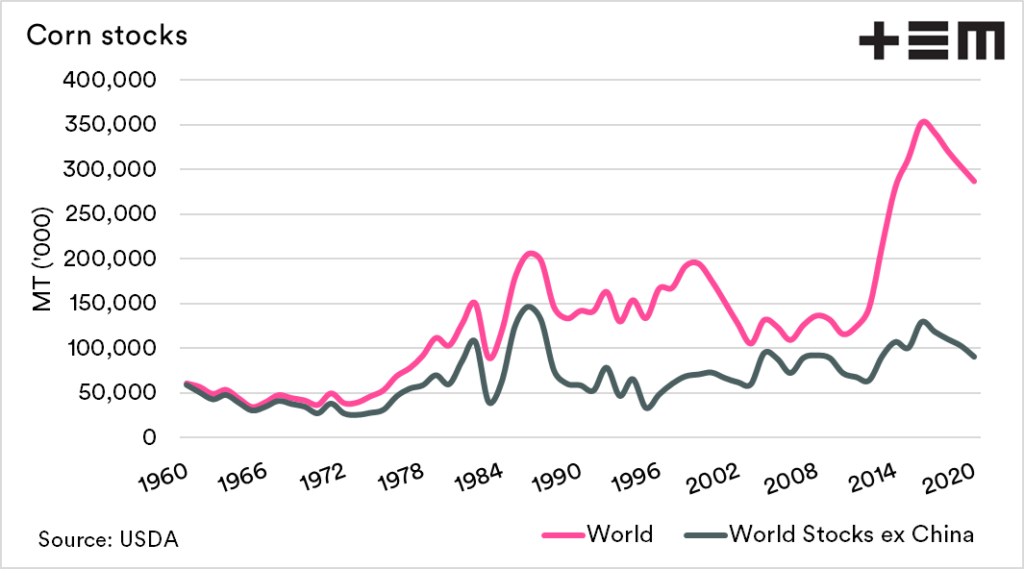
Corn stocks
Global corns stocks peaked in 2016, at 352mmt. However, since then, they have been in a gradual decline. As always, with analysing global grain stocks, we tend to remove China, as there are concerns about stocks’ actual state (or even their existence).
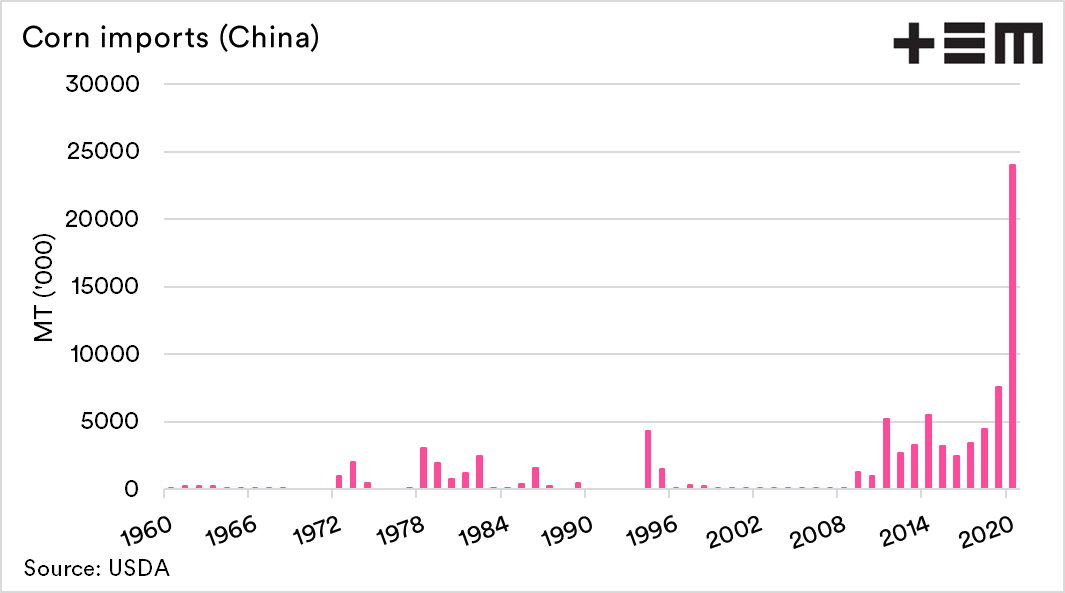
At the turn of the last decade, Chinese stocks of corn were are 43mmt. The most recent estimates from the USDA are 196mmt. Whilst these stocks are high (on paper), China continues to import corn at record levels.
The large imports points towards a situation where the stocks are not as large as estimated, and/or the crop hasn’t been all that good locally this year.


Stocks to use
The stocks to use (STU) ratio is a crucial barometer that is used to provide an insight into the relationship between supply and demand.
The STU ratio can is displayed as either a % or a number of days. I prefer using a ratio, but both are showing the same thing.
The higher the ratio, the better supplied the world is. At present, the stocks to use ratio has declined, with the US STU dropping to levels not seen since 2013.
The US is the worlds biggest exporter of corn. A declining STU ratio is supportive of corn pricing, which is beneficial to wheat (and barley) pricing.
If we see issues in the coming corn crop, then the grounding is there for fireworks. As we move forward into the northern hemisphere risk period, the framework is in place, and any issues are going to have a strong impact.