Corn could propel wheat price

The Snapshot
- Wheat and corn prices tend to follow similar trends.
- If corn rallies, then wheat will likely follow.
- The stocks-to-use ratio is a good measure of both supply and demand in commodity markets.
- A low stocks-to-use ratio generally points to higher prices and vice versa.
- The corn stocks to use ratio is at the lowest level since 2013.
- China stores 70% of all corn at present.
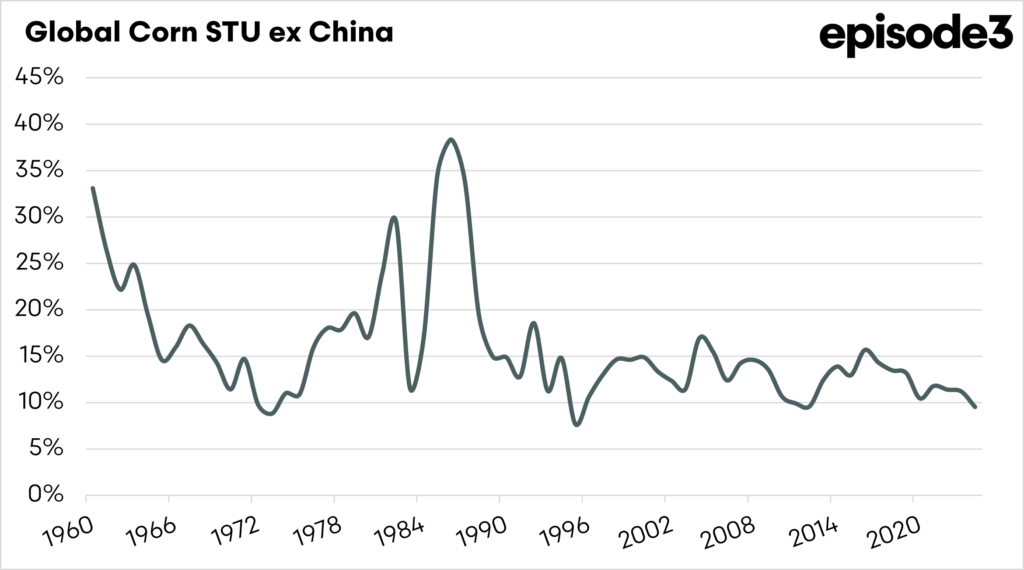
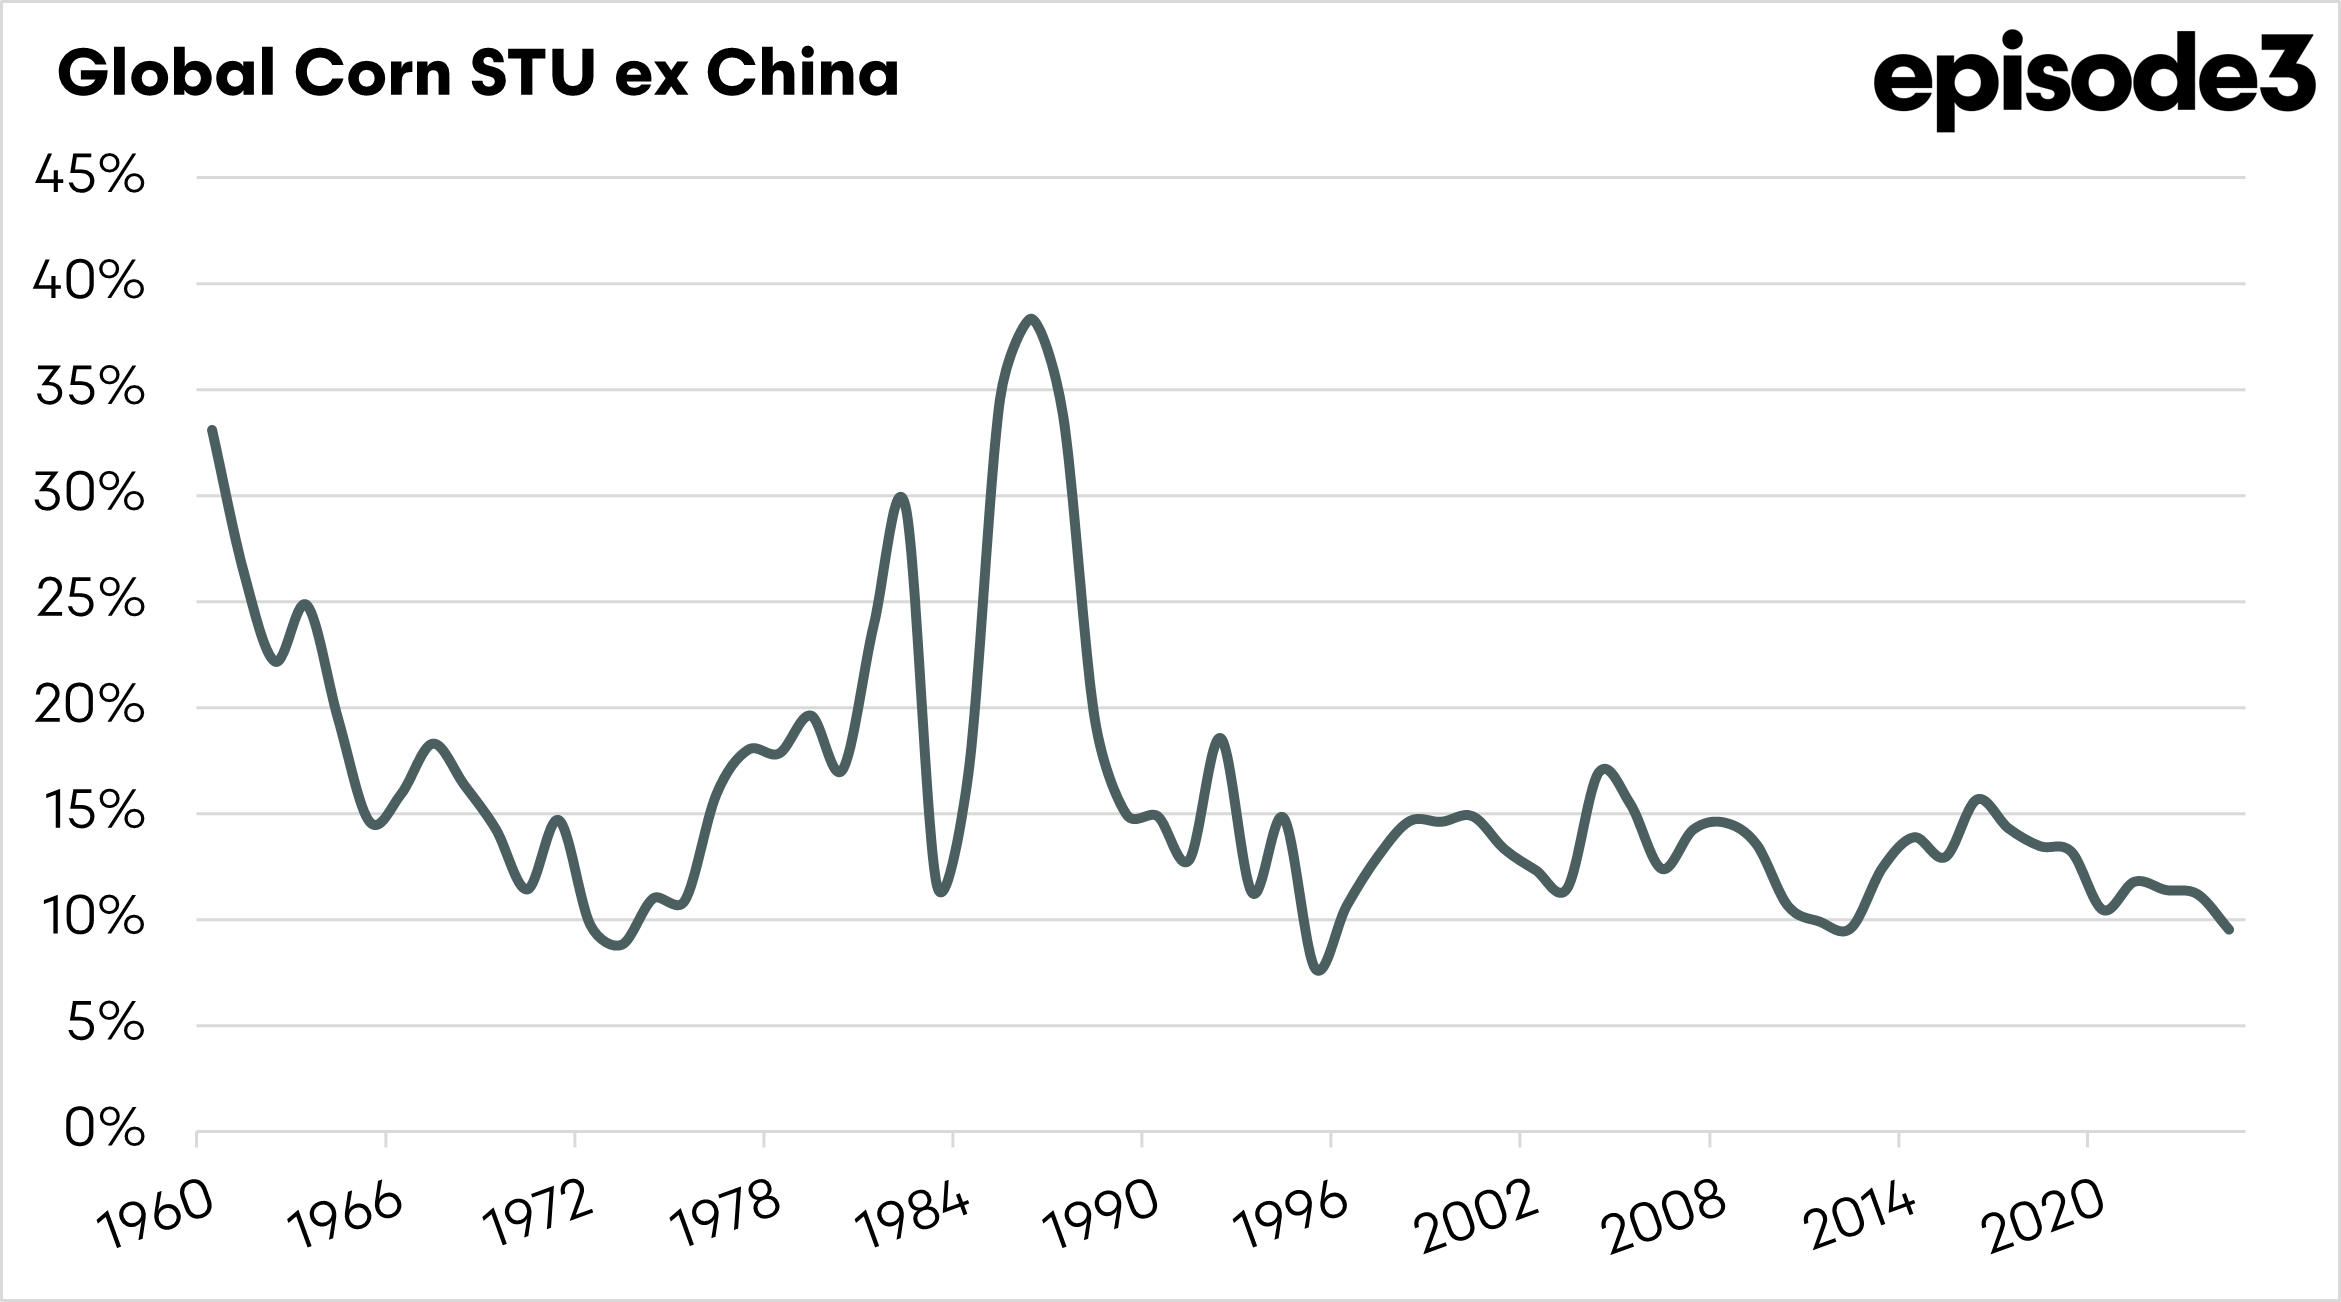
- If we exclude China from the stocks to use in the calculation, then it will sit at the lowest level since 1995.
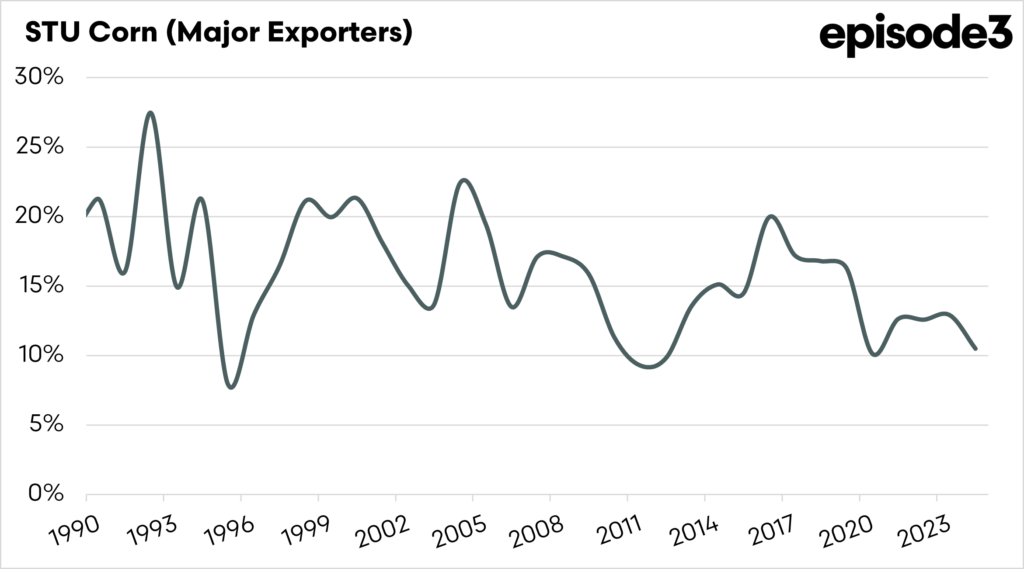
- If we examine the major exporters, the stocks-to-use ratio is the 6th lowest since 1960.
The Detail
It’s all been a little doom and gloom lately in markets, so I thought it was time to find some good news, and that is in the wheat market.
I have spoken a lot about how the global wheat balance sheet is very tight in many ways because the top 8 exporters have very small pantries. However, wheat does not operate in isolation – corn is often the driving force of the grain market.
The chart below shows the relationship between wheat and corn prices going back over twenty years; we can see that these two markets have a strong relationship with each other. `Corn and wheat are both replaceable with one and another, as they have similar uses such as livestock feeding.
So if corn suffers supply issues and prices rise, it will flow through to wheat pricing.


Let’s start by looking at the big picture. I’ll look at the stock-to-use ratio in this analysis, which is probably the most valid indicator when analysing supply and demand.
The stocks-to-use ratio for corn is a way to measure how much corn is available compared to how much people are using. It’s calculated by taking the total amount of corn left in storage (stocks) at the end of the season and dividing it by how much corn is used in a year (for food, animal feed, ethanol, exports, etc.). The result is a percentage that tells us how tight or loose the corn supply is. A high percentage means there’s plenty of corn available, while a low percentage means supplies are tight, which can lead to higher prices.
This ratio is important because it helps predict price movements. When the stocks-to-use ratio is low, buyers may worry about shortages, pushing prices up. When it’s high, meaning there’s a lot of corn left over, prices tend to stay lower. Traders, farmers, and buyers watch this number closely to understand supply and demand trends and make decisions about buying or selling corn.

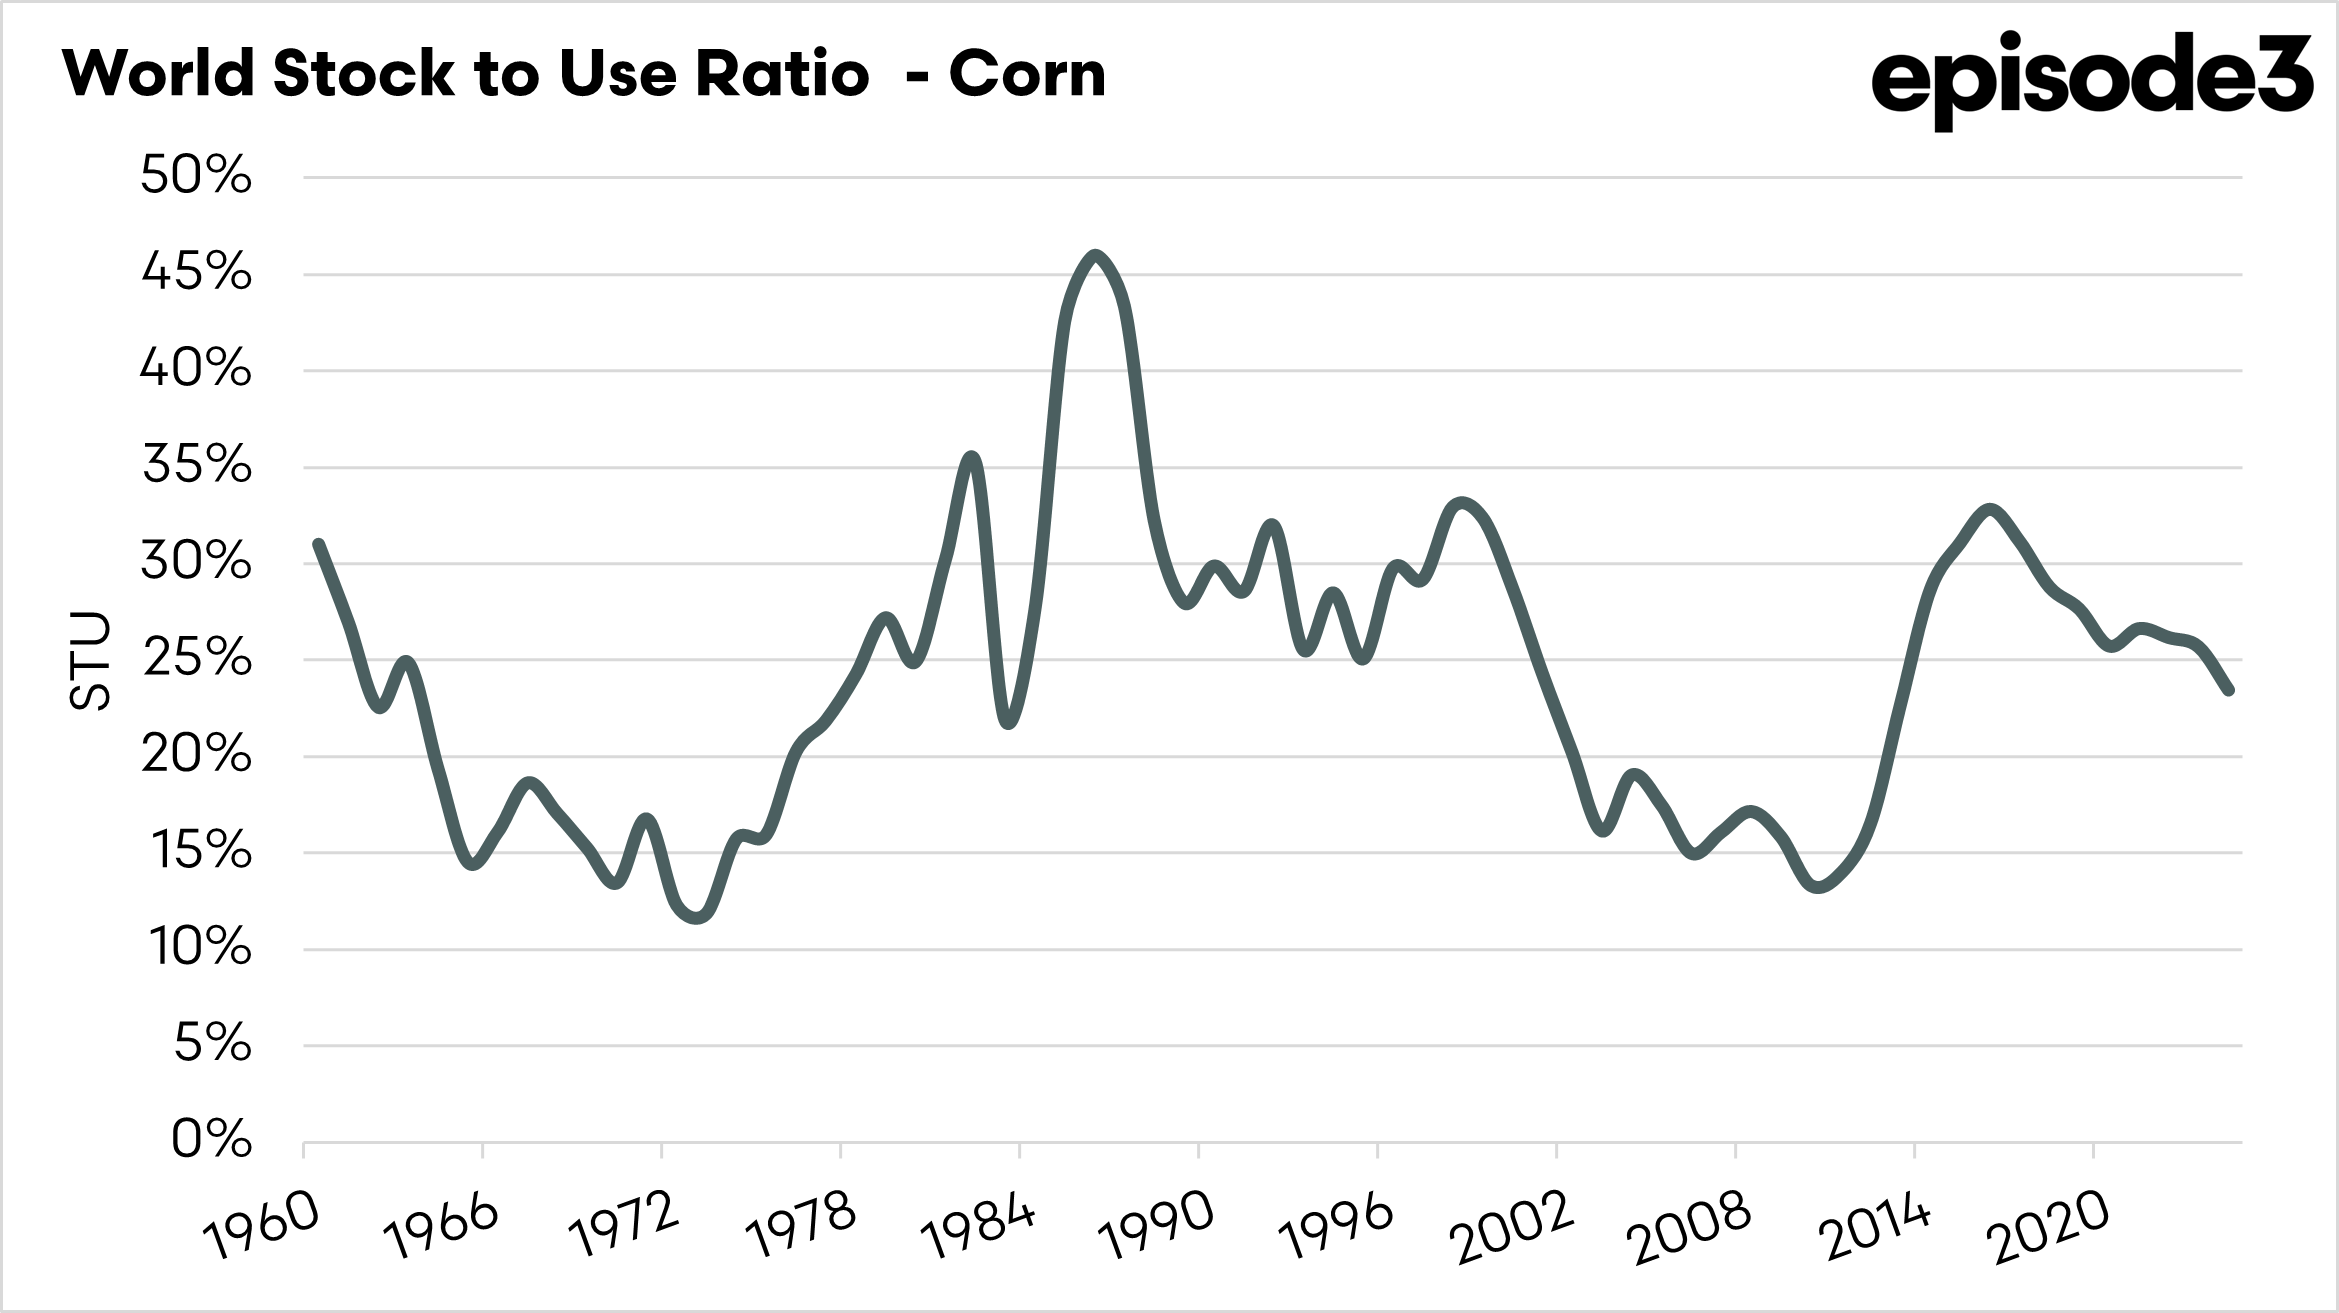
In the chart above the world stocks-to-use ratio is displayed. It has been at its lowest level since 2013. The global stocks-to-use ratio has been on a downward trend in recent years. So globally the stocks to use is the tightest in more than a decade. That is good news.
Let’s delve in a little bit deeper. China hoards a big chunk of the world’s corn, at the moment 70% of all the corn held in stocks is held in China. At least on paper.
The stocks to use of corn, excluding China, is displayed below. It is currently at 9.5%, which is the lowest level since 1995.
If we look at the stocks-to-use ratio of the major exporters, the ratio is currently at 10.48%. This is on the low end of the range and the sixth lowest since 1960.
This is another factor that points towards tightness in the marketplace. If we see disruption to supply in one of the major exporters or a change to their demand, such as increased biofuel production in Brazil, then we could see corn prices rally.
As shown in the first chart, a rally in corn will assist wheat pricing. So, there is some good news: both corn and wheat have some fundamental tightness.