Decile Drop: Wheat futures

Decile Drop
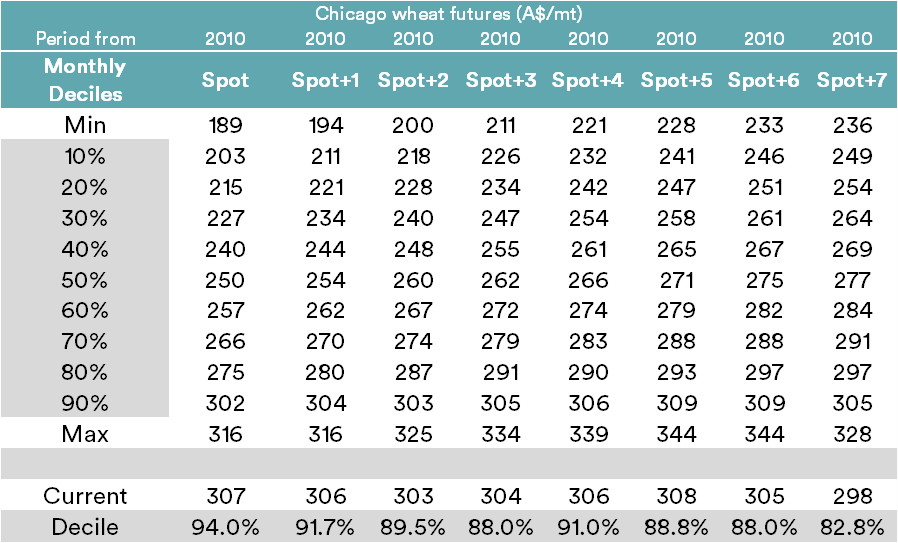
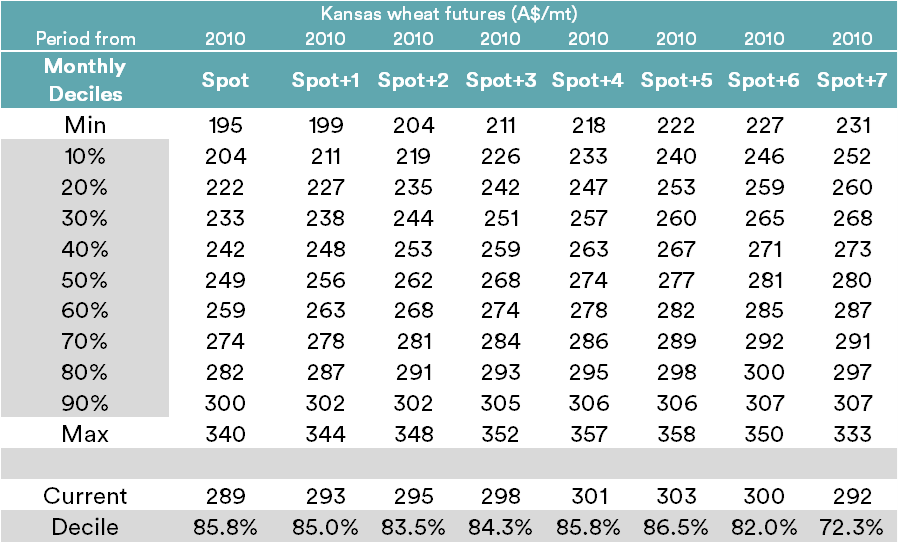
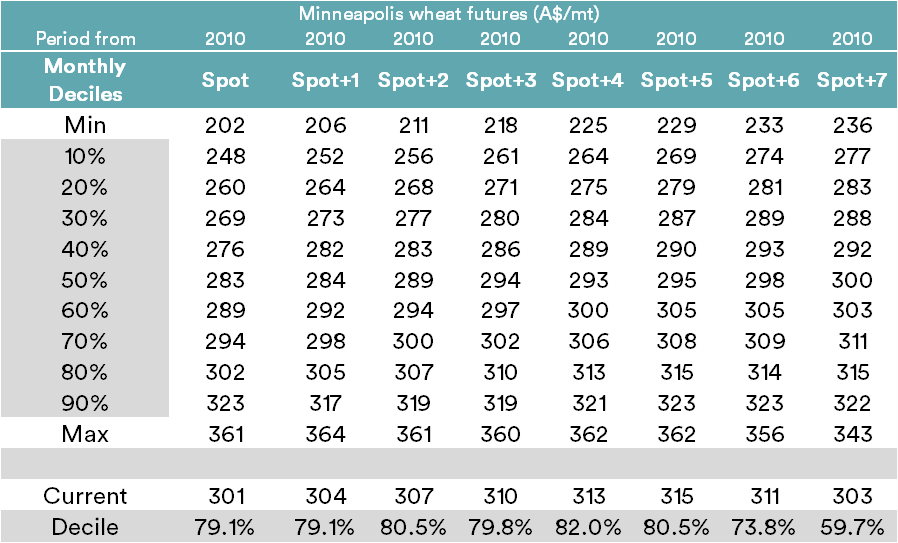
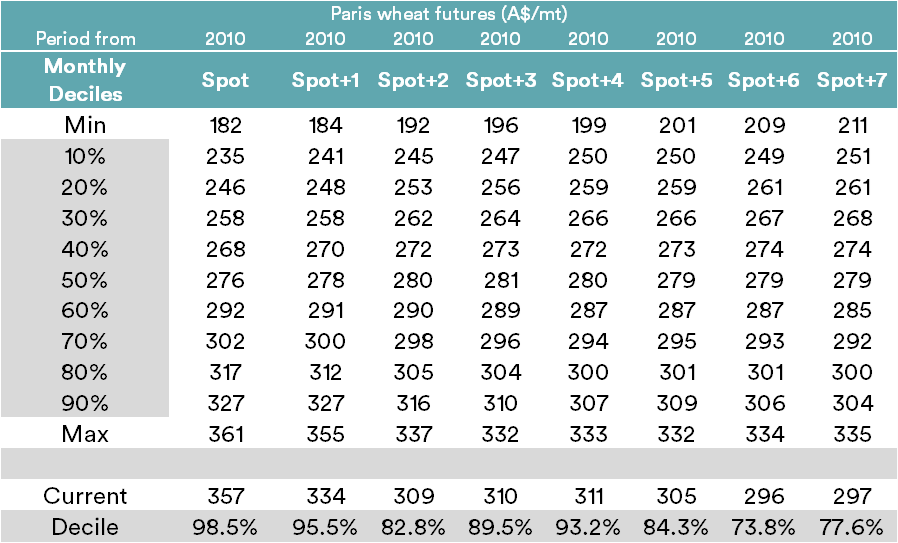
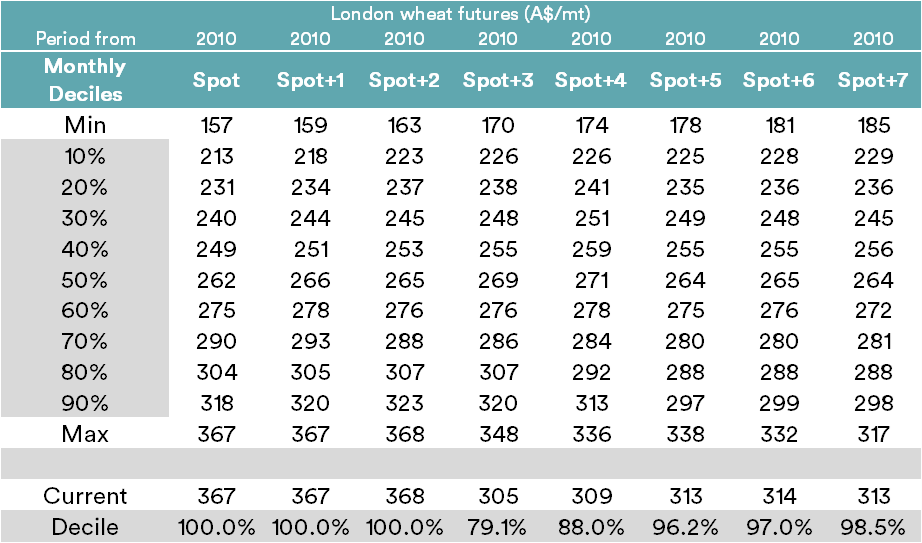
Decile tables for the monthly average price for various overseas futures values. These decile tables include the spot contract and the following 7 contracts. This gives an insight into the forward curve of the wheat markets.
Included tables:
- Chicago
- Kansas
- Minneapolis
- Paris
- London
The tables display nominal prices relevant to each decile range, which can be used to get an understanding of how high/low the current price is in relation to all historical prices. A decile table measures how often, historically, prices have fallen below (or below) a particular pricing point.
It gives a brief snapshot of whether a market has more upside or downside and how large this may be.
For example, if a price is at its 40% decile, this means that 40% of the time prices have been below that value and 60% of prices higher. Similarly, a 90% decile means that 90% of the time, prices have been lower and higher just 10% of the time.
At the bottom of each table is the current months average price and the percentage decile ranking for that price.