
Fear not volatility, it’s just the wheat’s wild side!

The Snapshot
- The middle of the year is when the majority (90%) of the world’s wheat is harvested.
- If there are any production issues with the major northern hemisphere producers, then this can lead to sharp movements in price
- Pricing volatility of CBOT wheat futures tends to reach its zenith during July.
- This year could be especially volatile if issues eventuate in the black sea nations.
The Detail
Seeding is in progress, and that is rightly where most concentration is on. However, we are coming into the middle of the most critical period for determining the pricing of grain for the next year.
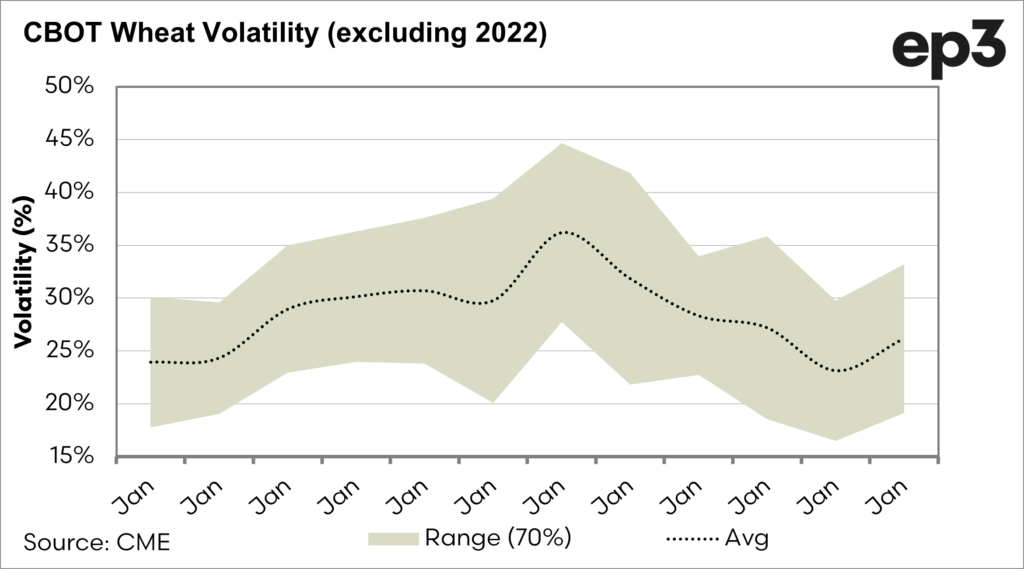
The middle of the year tends to be the most volatile. The chart below shows the seasonality of wheat volatility. This chart excludes last year, as the huge volatility this time last year was caused by the black swan event of the invasion of Ukraine.
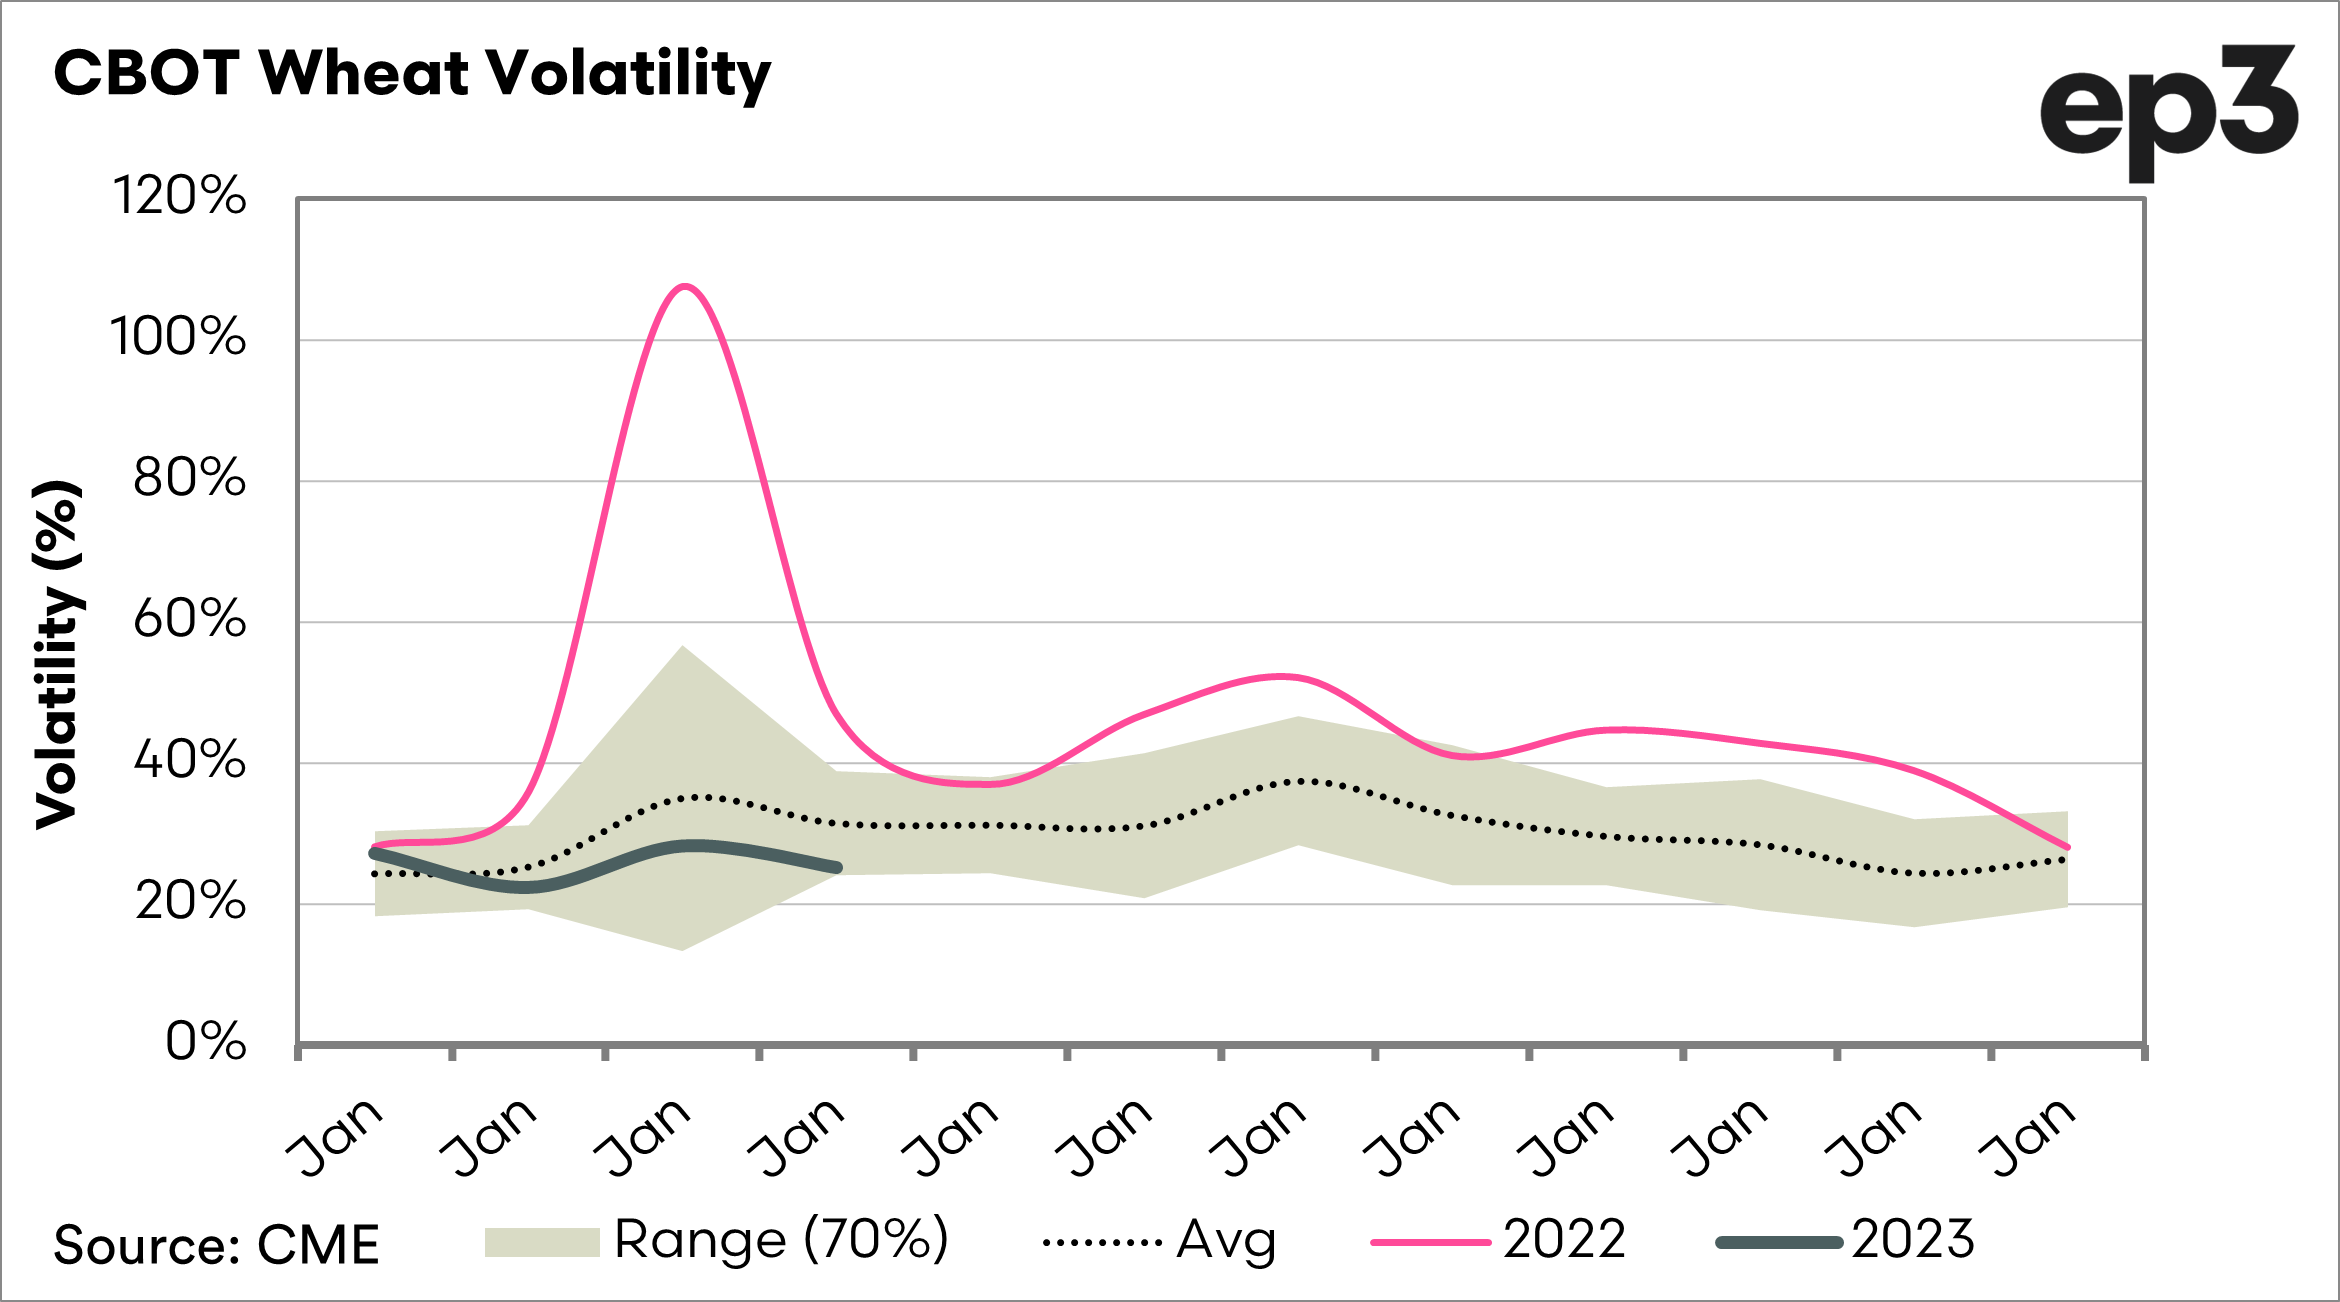
This would be considered typical volatility. The second chat shows the same chart with last year included. This highlights how volatility increased during the invasion.


On a per-capita basis, Australia produces the most significant volume of wheat in the world. At 1mt per person, we provide more than enough to meet demand. This is a considerable amount when you compare to the likes of the United States at 170kg per person.
Australia has a domestic demand for wheat averaging 7.2mmt, based on the average of the past decade. After this demand is met, the nation adds a significant volume onto the export market, the exception being during droughts. Even so, Australia is still a minnow producing only 3% of the world’s crop.
So with us only just in the early stages of the growing phase, why is the current period of paramount importance?

Approximately 90% of the world’s wheat crop is grown in the northern hemisphere and will be harvested between now and October. Due to the large volume of grain due to be harvested in the coming months, all eyes are on our northern cousins.
Suppose a disaster occurs, especially in one of the critical regions such as the black sea or North America. In that case, it will have a correspondingly significant impact upon prices.
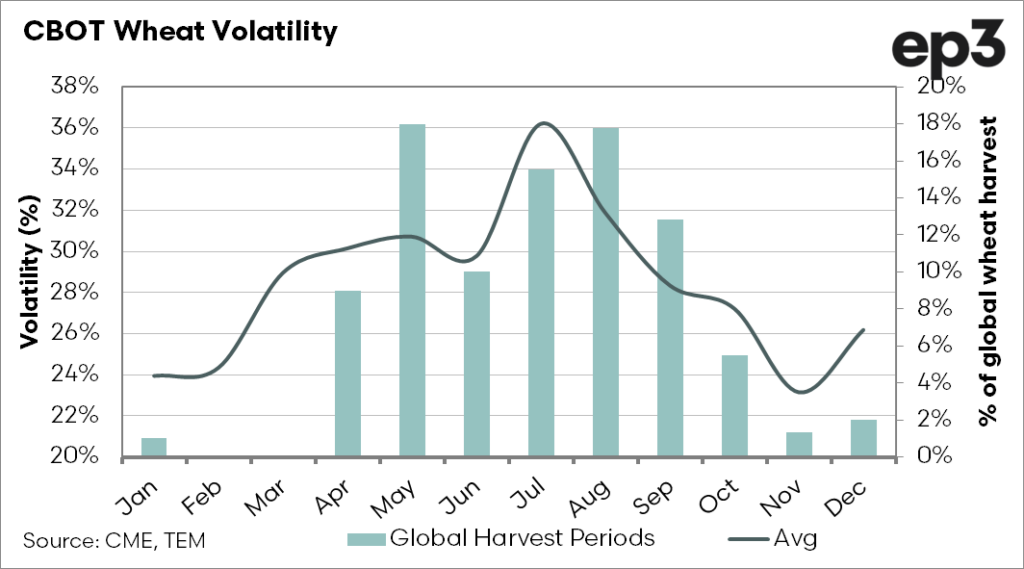
If we use CBOT as an indicator of global wheat markets, the volatility increases towards the middle of the year. The chart above displays the average monthly volatility (excluding 2022), against the world’s wheat harvest percentage.
This volatility occurs because any news report of worsening crop conditions (or improving) leads to movements in pricing. This movement can sometimes occur as speculators look to take profits, which can lead to short-term corrections.
It is important to note that volatility does not equal higher prices; it refers to the range of trading. If the market rallies, we want to ensure that we are positioned to take advantage of it.