Global Grain Export Seasonality
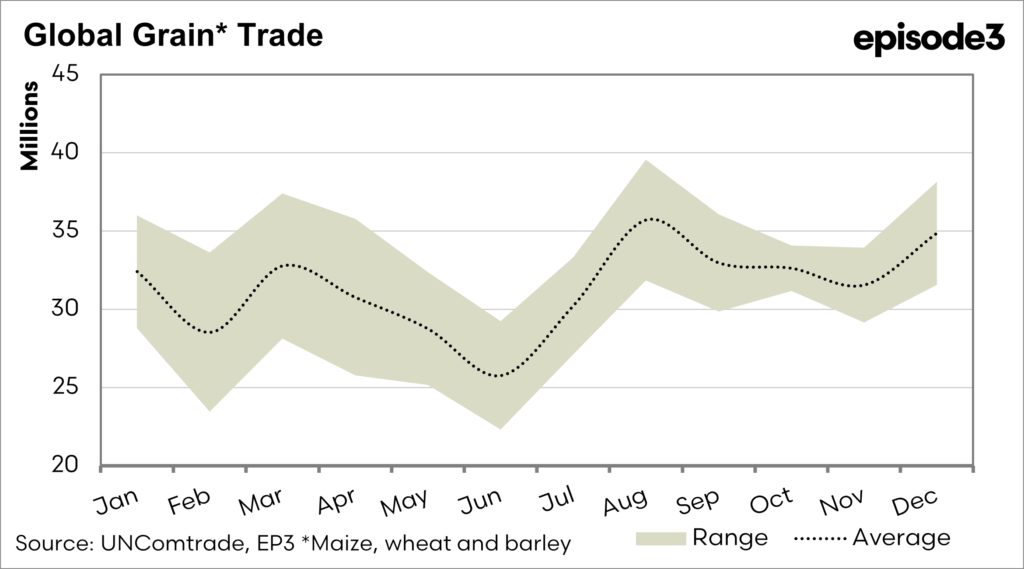
Global Grain Exports
Global grain exports follow a clear annual rhythm shaped by the harvest calendars of key producing regions and the timing of import demand. Data covering barley, maize, and wheat shipments from 2017 to mid-2025 shows that combined exports start the calendar year at moderate levels, then ease through late autumn and early winter before accelerating sharply from mid-year into the final quarter. March to June is typically the quietest period, when the previous Northern Hemisphere crop has been largely shipped and the next harvest is still developing. From July onwards, volumes begin to rise and reach their highest levels between August and December. During these months, global shipments can be double those of the low-season troughs. This late-year surge reflects the dominance of the Northern Hemisphere, where the United States, Russia, Europe, and Ukraine produce the majority of exportable grain. Southern Hemisphere producers, such as Australia and Argentina, help smooth the curve by shipping during the Northern Hemisphere’s off-season, but their output is not large enough to alter the overall global pattern. For farmers, understanding this seasonality is crucial because it affects price movements, freight demand, and storage requirements throughout the year.

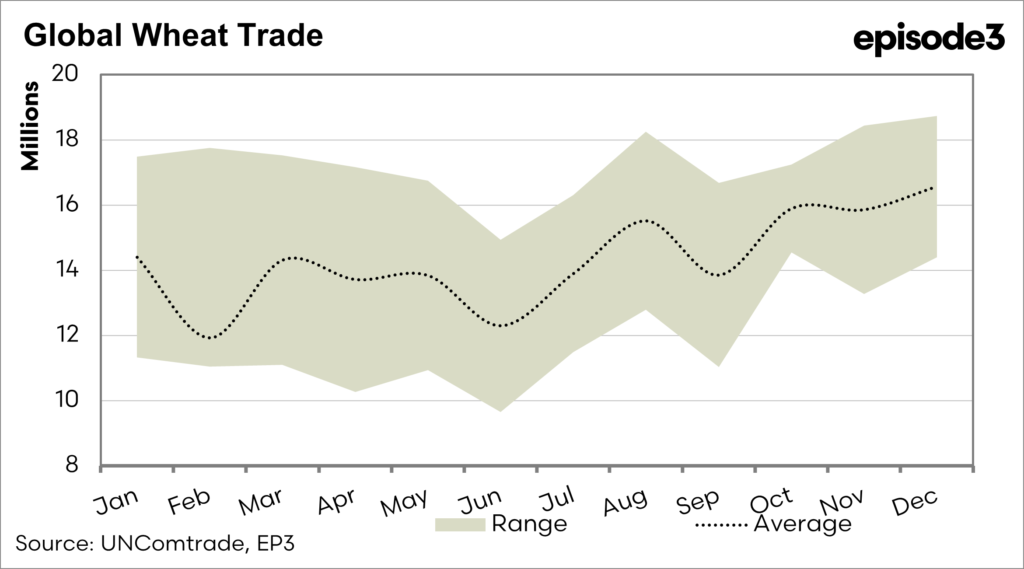
Wheat
Wheat is our most important crop in Australia. Globally production is concentrated in the Northern Hemisphere, with Russia, the European Union, the United States, and Canada providing the lion’s share of global exports. Their harvests occur from mid-year to early autumn, and exports begin to rise from August as new-crop wheat enters the supply chain. The surge in Northern Hemisphere shipments continues through December and often into the first quarter of the following year as contracts are executed and buyers secure supplies. Australia provides a crucial counter-seasonal pulse, shipping large volumes from November through June. This Southern Hemisphere flow softens the mid-year lull but cannot fully offset the seasonal dominance of northern producers. Prices often weaken when the Northern Hemisphere crop becomes available and freight markets typically tighten as the export program ramps up.

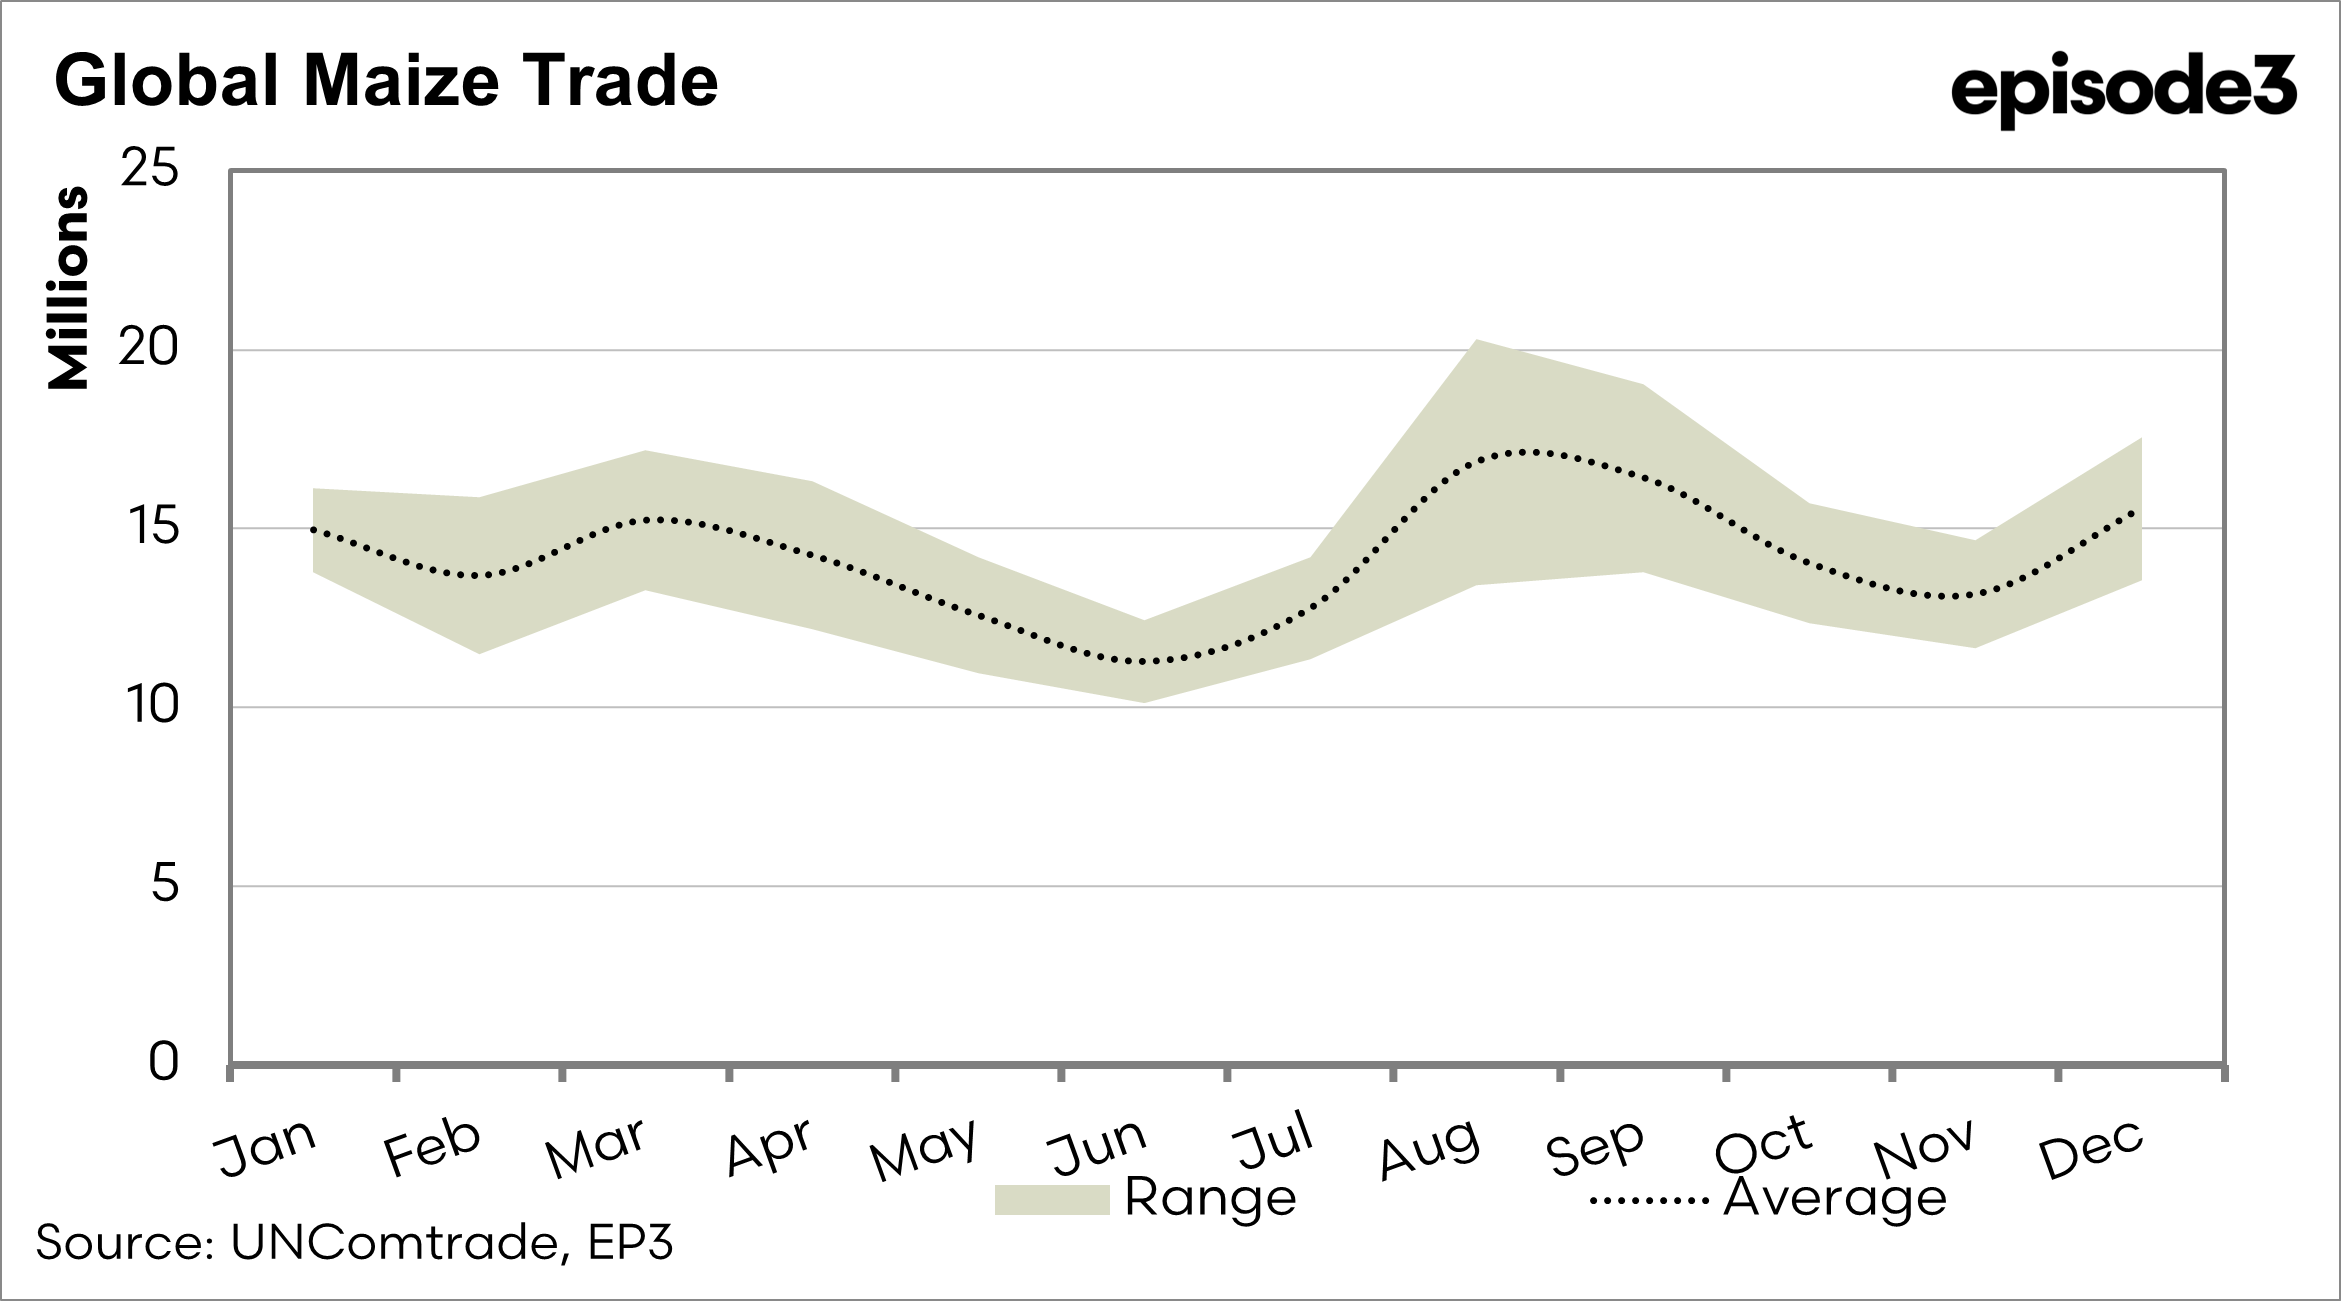
Maize
Maize follows a similar but slightly more extended pattern. The United States, the world’s largest maize exporter, harvests in September and October, driving a sharp increase in export flows from late summer through to the end of the year. Brazil adds a unique twist with its second crop, the safrinha, which is harvested in mid-year. Brazilian shipments begin to rise from July and feed into world markets before the US harvest arrives, creating an early uplift in mid-year volumes. This combination of Brazil’s safrinha crop and the US autumn harvest results in a long high season for maize that typically spans from July through December. Imports from Asia and the Middle East respond to these supply pulses, and global maize prices often reflect the timing and size of these two key crops.

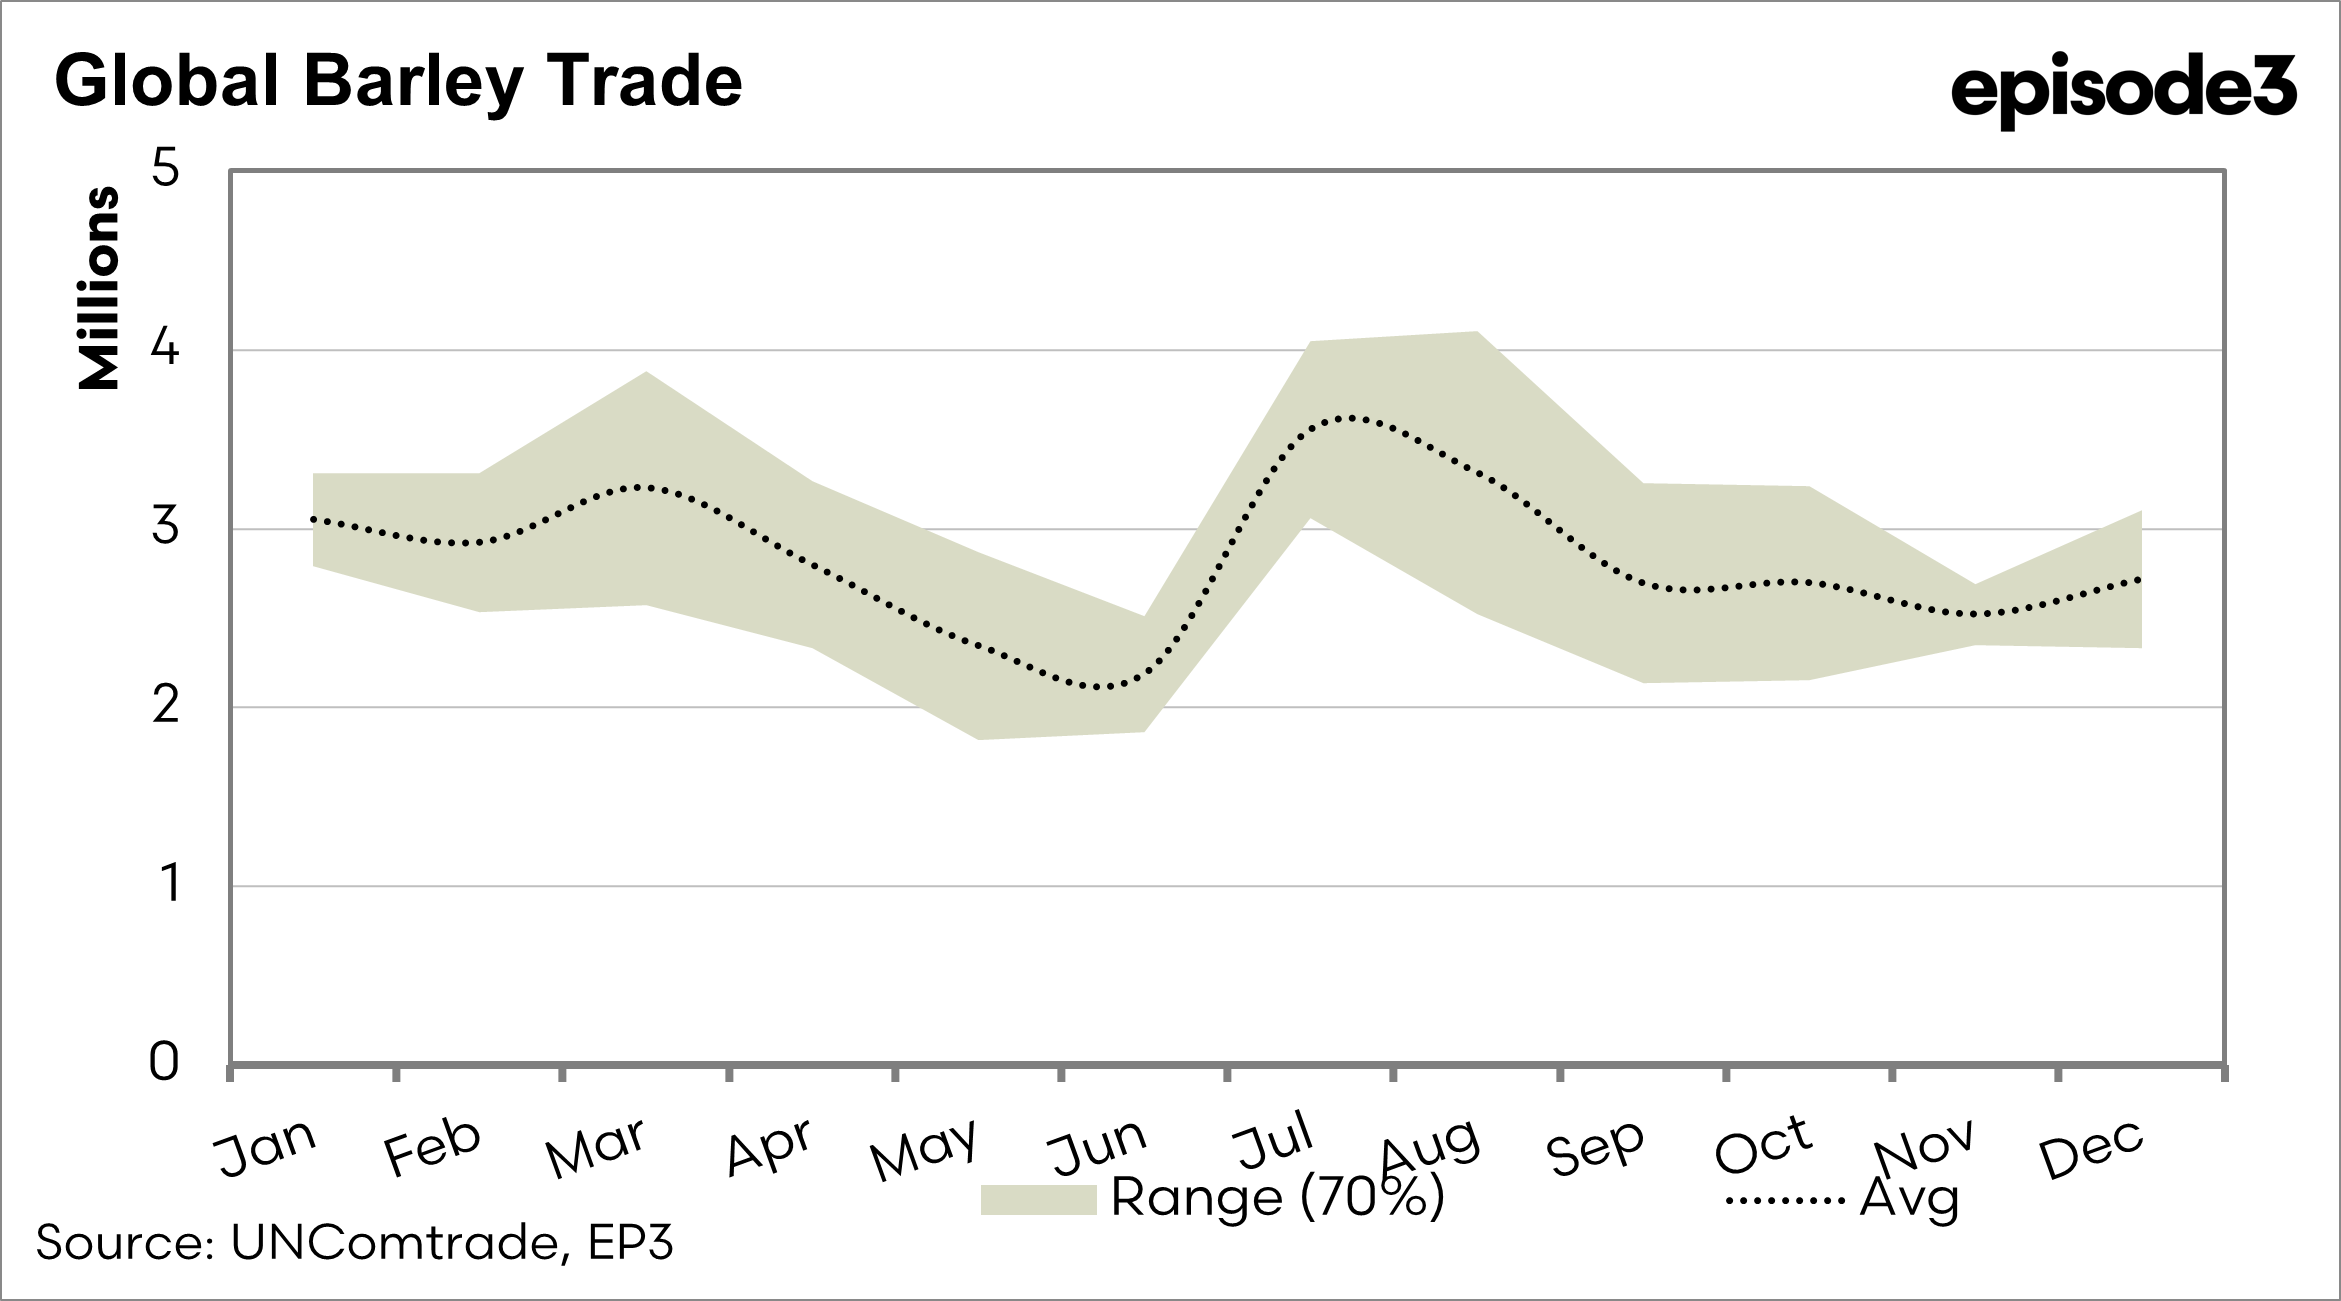
Barley
Barley exports are smaller in scale but show a comparable seasonal profile. The bulk of global barley comes from Europe and the Black Sea, where harvests in July and August set up strong export flows in late summer and early autumn. Demand for malting and feed barley in markets such as China and the Middle East drives shipping programs during this period. Australia again provides an offsetting influence, with its November to January harvest supplying fresh grain during the Northern Hemisphere off-season. Although trade policy changes, such as Chinese tariffs or shifts in feed grain substitution, can create year-to-year volatility, the underlying pattern of a late-year peak remains consistent.