Global Grain Glut
Summary & key takeouts
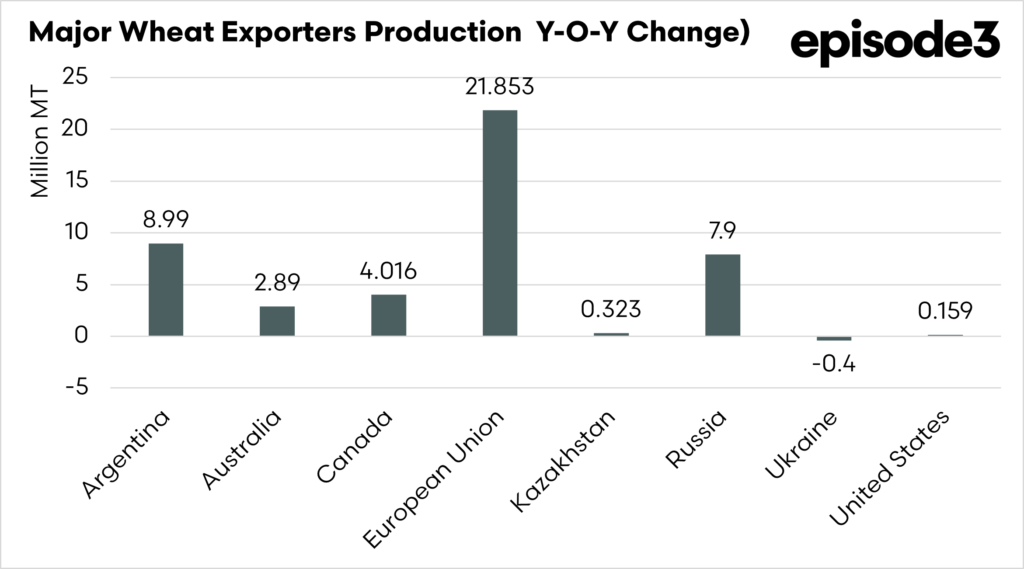
• Major exporters continue to dominate global wheat trade, with notable upward production revisions for Russia of 2 million tonnes and Argentina of 3.5 million tonnes.
• Ukraine was the only major exporter not to record a production increase this season, although the decline was relatively small.
• Rising production across key exporters, including Australia, increases the risk of large exportable surpluses competing in an already well-supplied global market.
• The current outlook from the report is broadly negative due to the scale of available supply among exporting nations.
• Despite this, there remains a long lead time to the 2026 harvest, leaving scope for weather or geopolitical disruptions to alter the supply outlook.
Production
It’s not good news, but you need to know. The world is awash with wheat, and that could be an issue for producers in 2026. Wheat prices are largely determined by supply and demand; too much supply and prices fall.
The world tends to keep a close eye on America these days, mainly to see what decisions Donald Trump is going to make next. Last night, the grain trade was looking at the USDA’s first World Agricultural Supply and Demand Estimates report for 2026, and it wasn’t a promising start for the year.
Production:
We are all getting better at farming in Australia; new technology, seed varieties, and improved water-use efficiency are driving the country toward higher and higher yields. Even in years when rainfall hasn’t been high, we are still getting large crops. That advancement isn’t unique to us; when a new technology is developed, it will spread quickly worldwide.
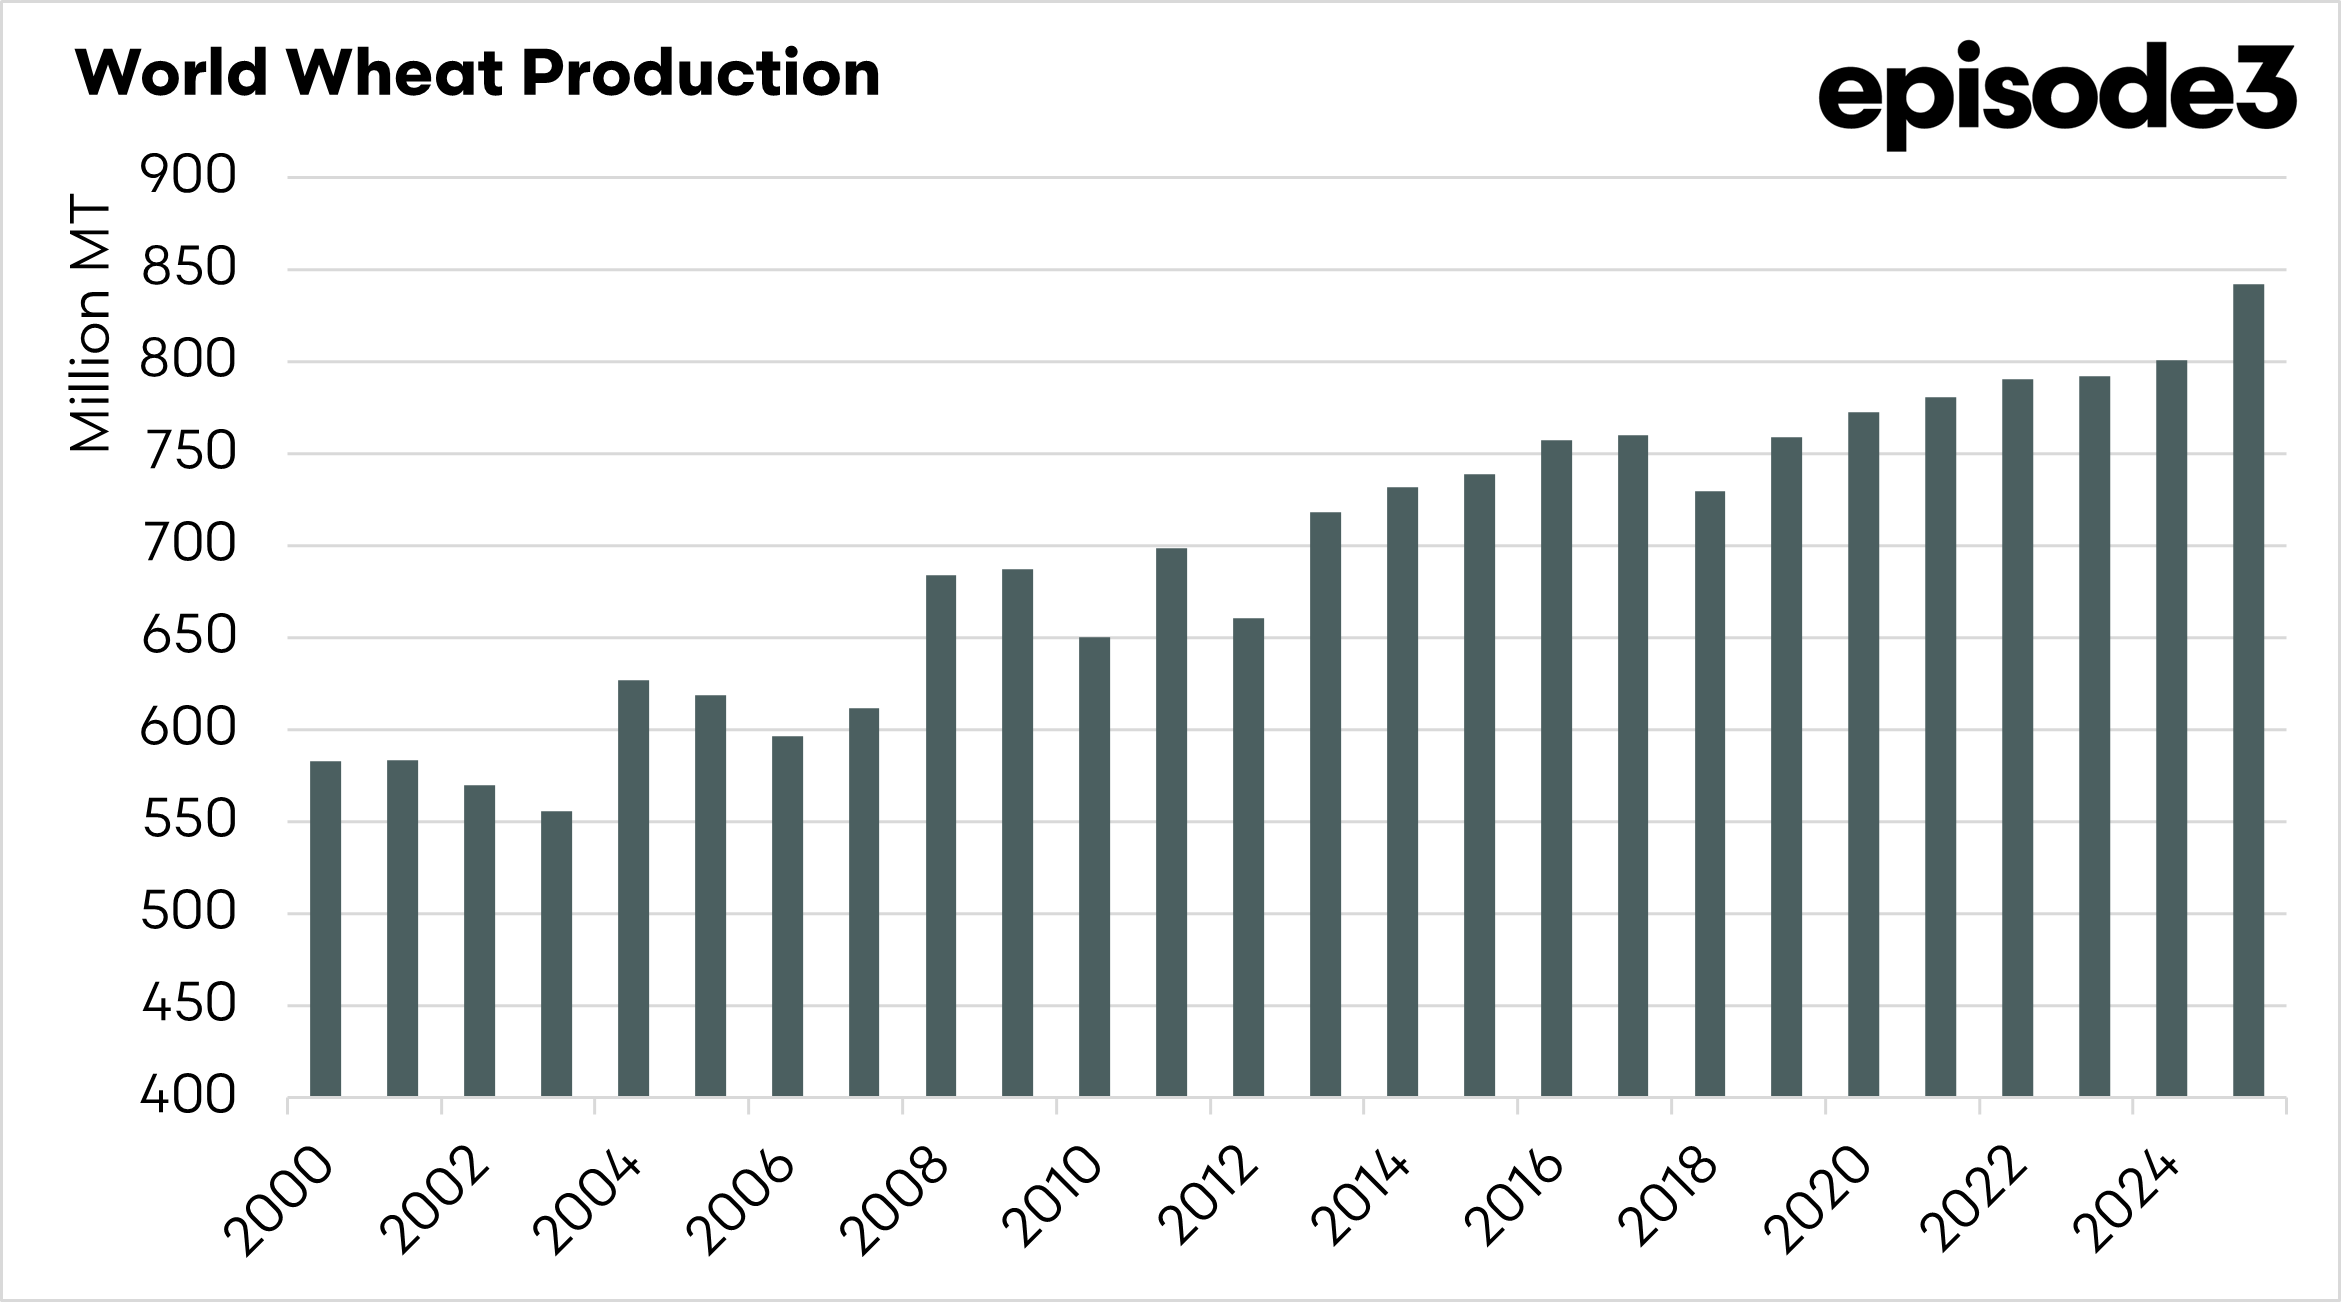
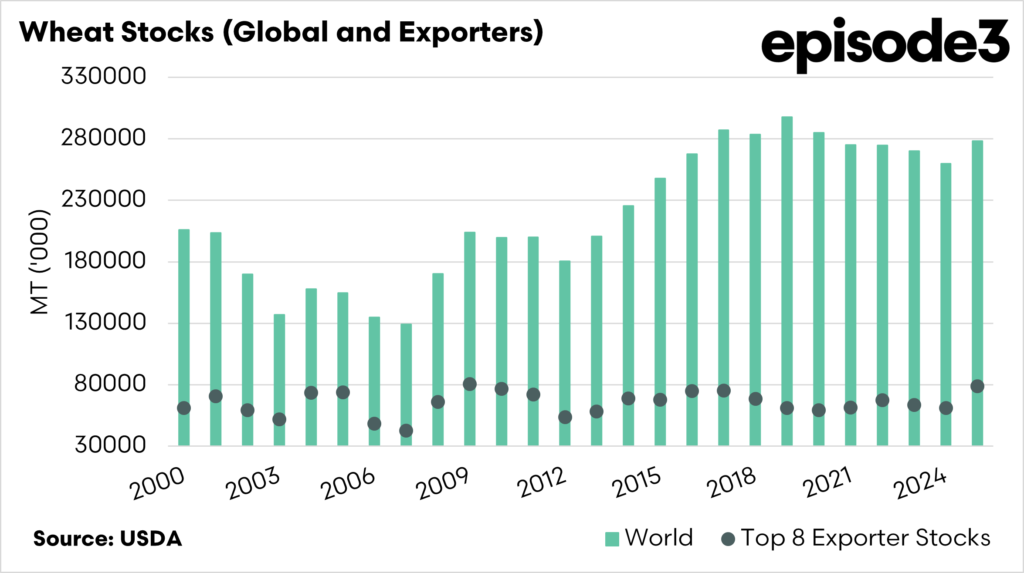
We can see this in global wheat production: the latest figures show a record 842 mmt in the past season, 42 mmt higher than the prior record. This is a record yield of 3.83 mt/ha on average worldwide, up from 3.6 mt/ha last year.
The world is producing more, and that is a risk we have discussed regularly (see here). It’s a great feeling to produce a high-yielding crop, but you cannot grow yourself out of low prices.

Supply and Demand
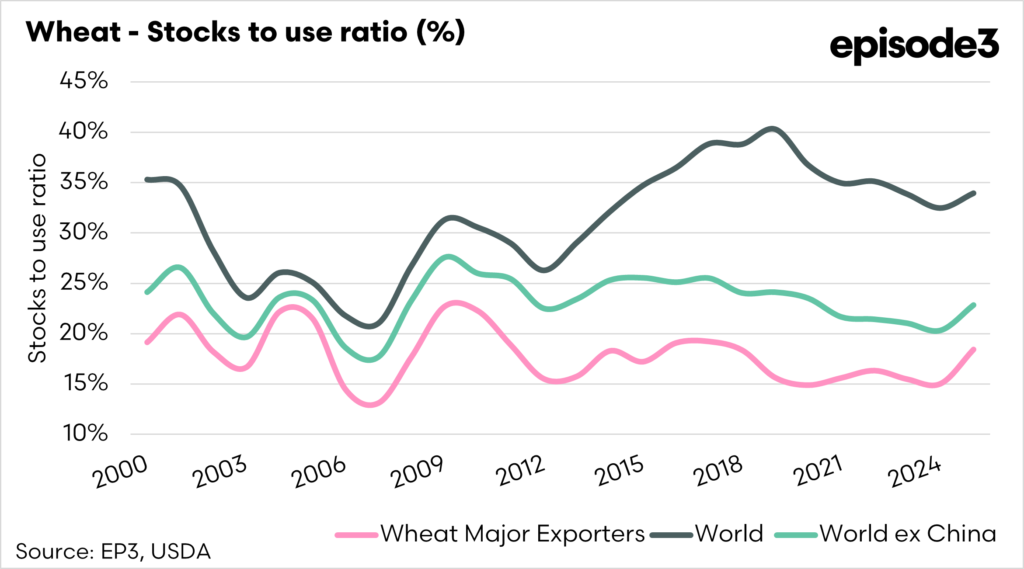
The stocks-to-use ratio is an important indicator to examine when it comes to grain, as it takes into account supply and demand.
The stocks-to-use ratio measures how much wheat is held in global inventories relative to expected consumption, providing a simple gauge of how tight or comfortable the supply balance is. A lower ratio signals increased vulnerability to price volatility from weather, trade disruptions or geopolitical shocks, while a higher ratio suggests the market has a greater buffer to absorb supply shocks.
When EP3 examines the stocks-to-use ratio, we look at the world, the world without China and the major wheat exporters. The stocks-to-use ratio has improved significantly this year, indicating a well-supplied world.
That said, if there are major issues with a couple of the major exporters, the supply/demand balance could flip, and prices could rise. At the moment, supply is strong.

Major exporters
The major exporters account for the bulk of global wheat trade, and there were significant revisions to Russia and Argentina, up 2mmt and 3.5mmt, respectively.
The only major exporter not to see a production increase this season was Ukraine, whose decline was minor.
This is the biggest concern, that these exporting countries (Australia included) will have big pantries trying to trade into a well-supplied market.
Whilst this report is pretty negative, we also have to be aware that there is a long time until the 2026 harvest, and anything can happen, but at the moment we need something to go wrong elsewhere.