It was the best of times; it was the most volatile of times.
Market Morsel
Is volatility good or bad? That depends, but it definitely brings opportunity. That’s why we shouldn’t necessarily be scared of it.
Over the past five years, I was starting to think that grain markets were a bit boring. We didn’t have the same excitement we saw during the period 2005 to 2015; well, we couldn’t have asked for more excitement in the market than 2022 has brought us.
There has been more uncertainty and volatility than we would have in a decade, only slightly more than four months into the year.
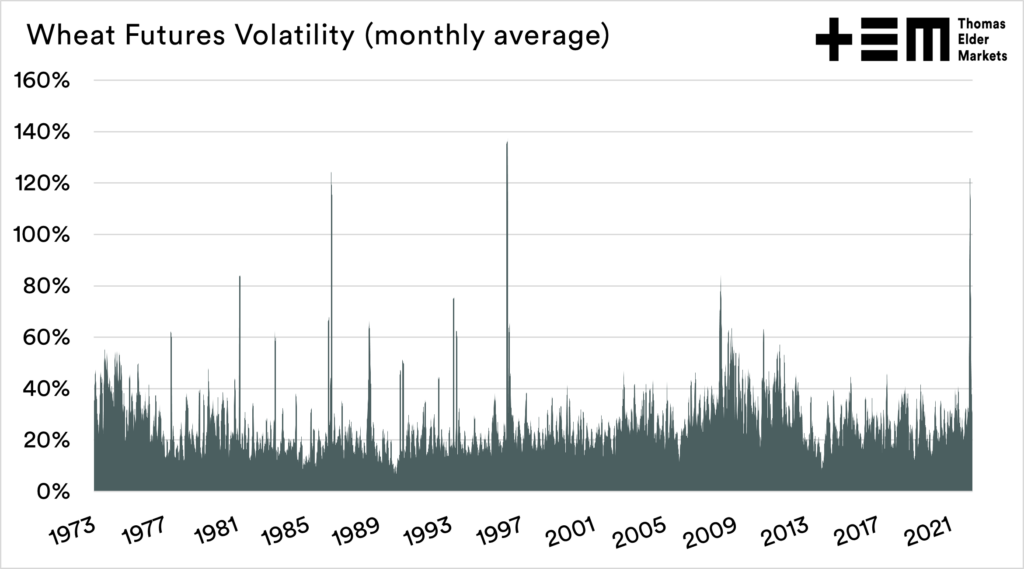
The chart below shows annualised volatility of wheat as a monthly average. The last couple of months has seen higher volatility at higher levels than the commodities boom of the mid-2000s. This is well above the typically expected volatility, and we will discuss seasonality later on.

To put this further into perspective wheat futures have only been more volatile in two periods since 1973. These were 1997 and 1987.
The market is extreme and largely driven by human factors (Putin) and creeping weather factors. This does make decision making extremely difficult; a volatile market can see prices change rapidly and cause sellers regret. Grain growers at the moment are experiencing huge swings, albeit all at strong levels.
Conversely, a consumer of grain (piggery, pizza manufacturer etc) can find that the uncertainty of pricing can cause a lot of angst. Consumers are finding their margins are being squeezed, with little ability to pass further down the chain.
In a volatile market, you have to be prepared for opportunities, so ensure that you have all your accounts (eg swap account) set up so that you can participate when presented with good events.

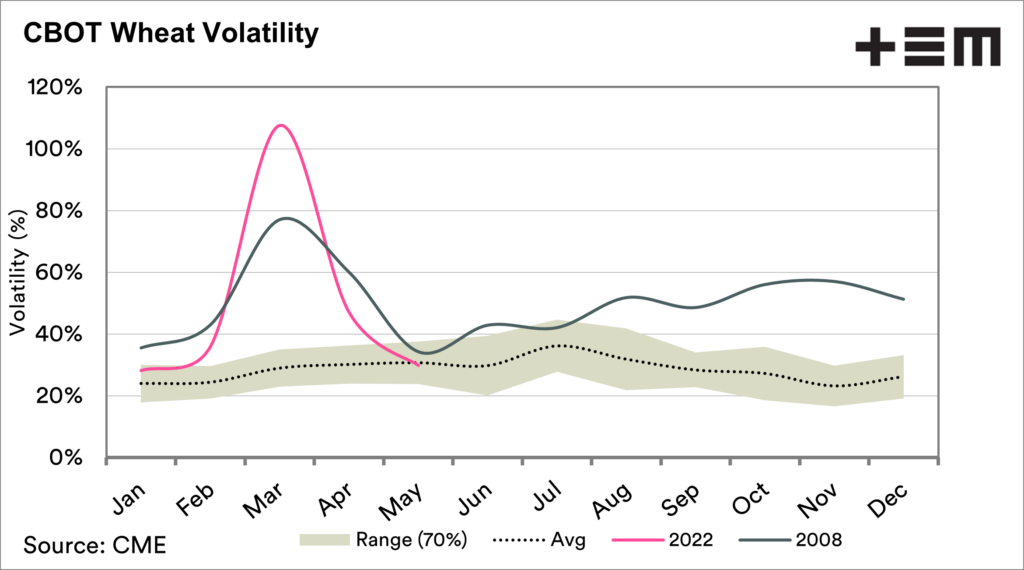
So markets have been crazy this year. That is a given. I got questioned on an article I wrote a couple of months ago where I mentioned that the market could get crazy if there were weather issues in the northern hemisphere. I apologise; I really should have used the term ‘crazier’.
Let’s look at the chart below.
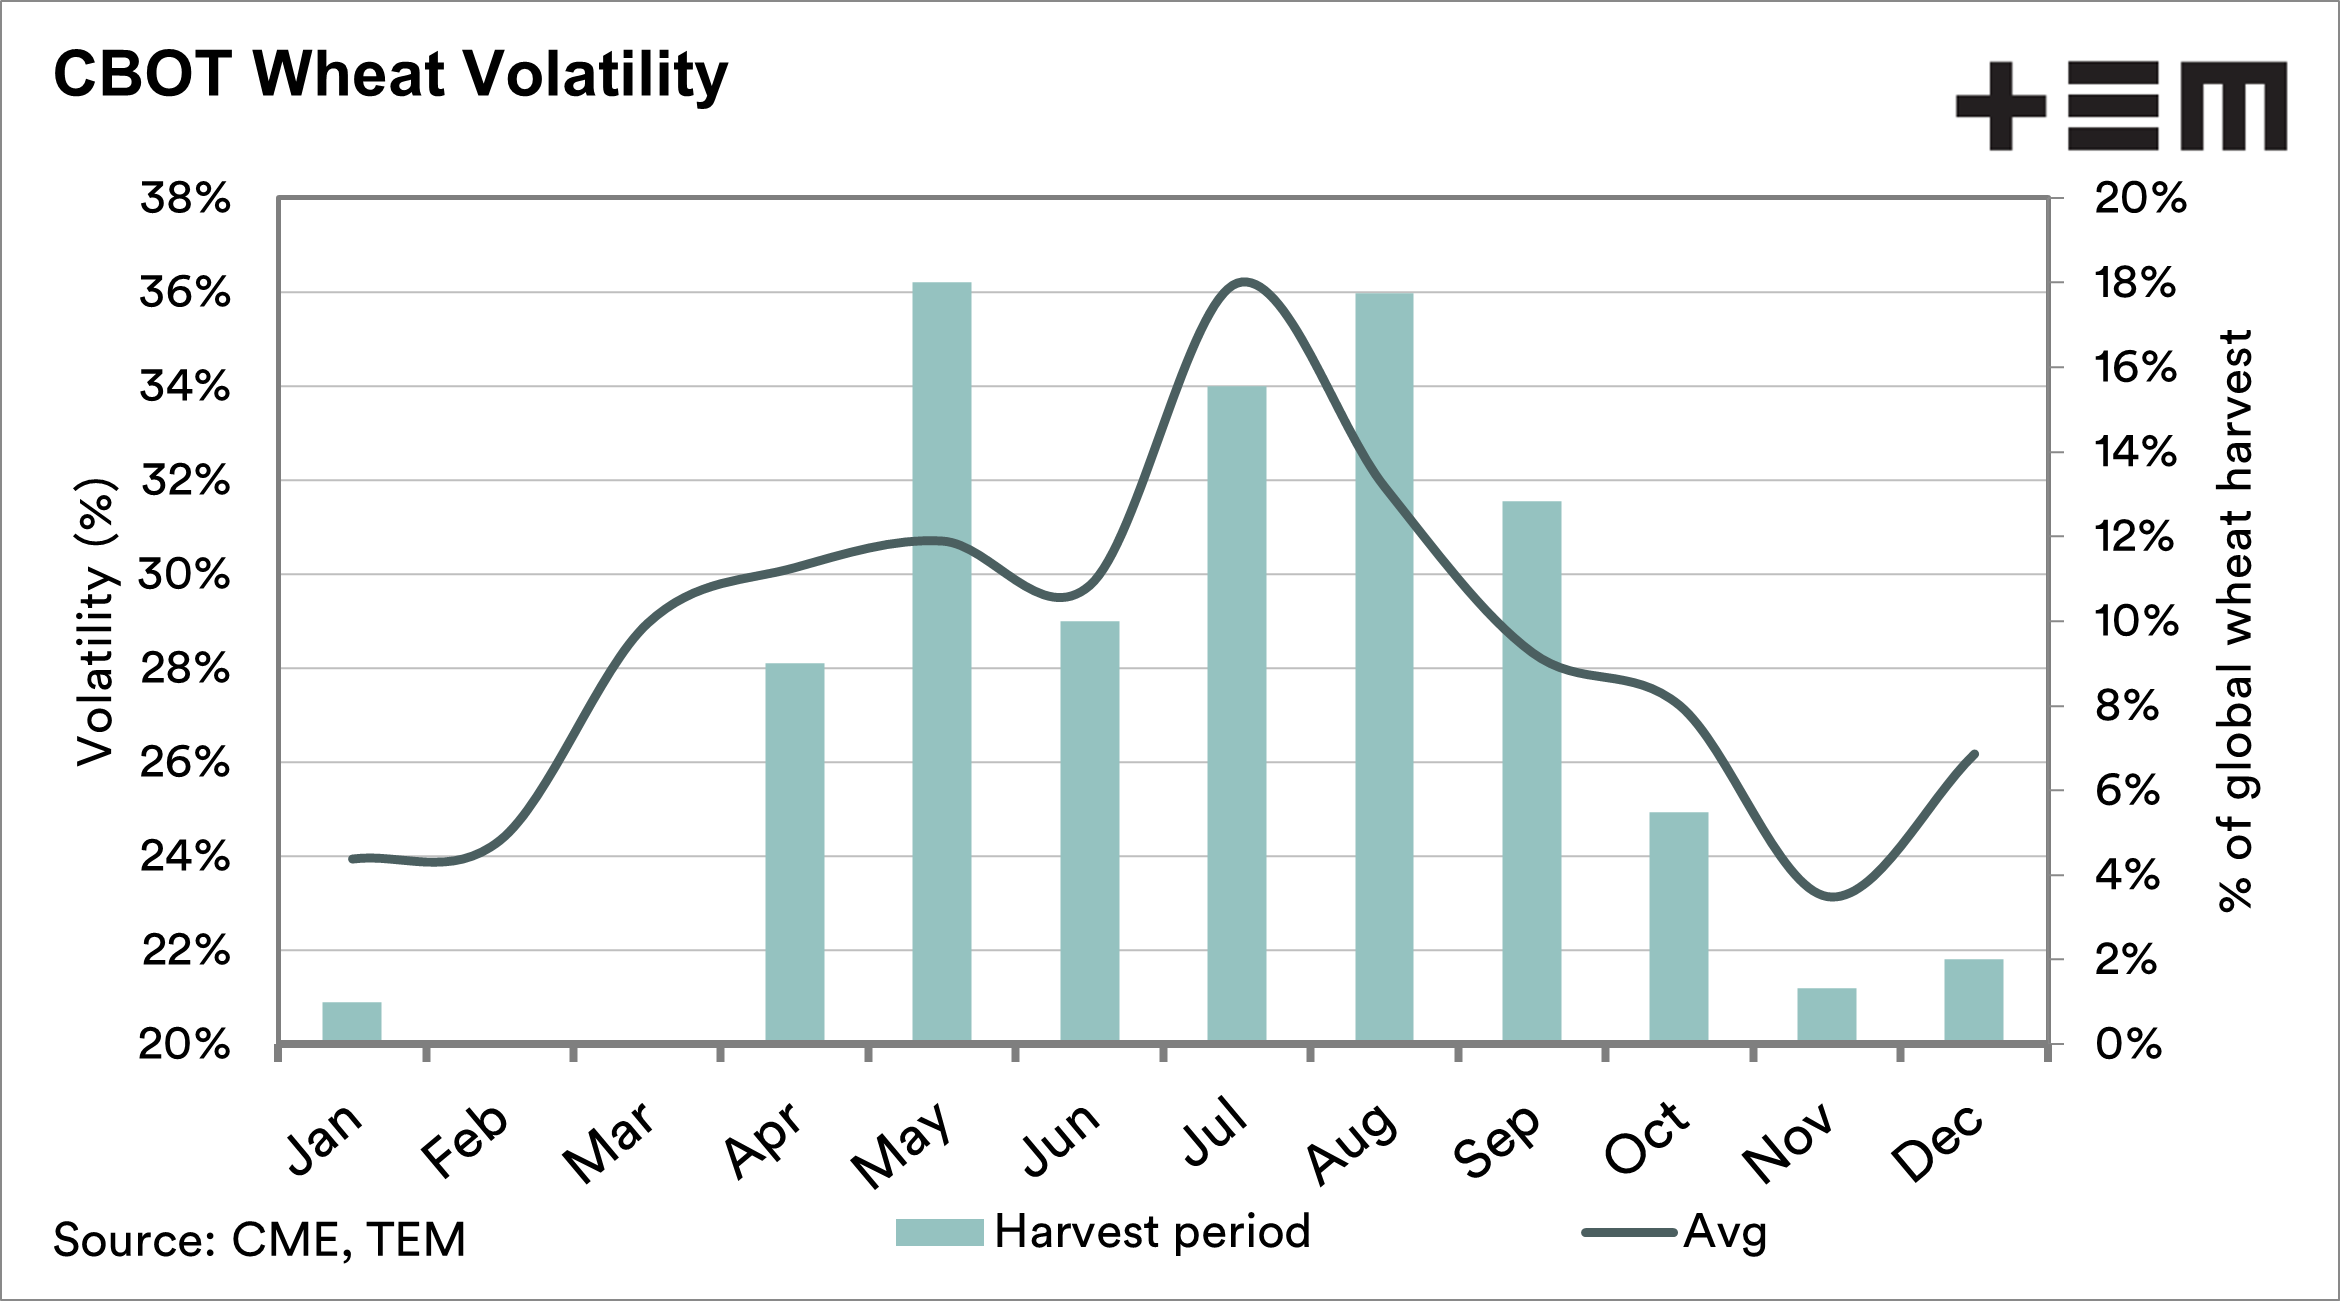
This chart shows the monthly average volatility (line) since 2010. We can see that the volatility tends to hit its crescendo in July. Why does this occur?
It is largely to do with the global harvest. The bars in this chart represent the percentage of the world’s wheat which is harvested each month.
The majority of the volume is harvested around the middle of the year. The trade gets fidgety around this time; any news, good or bad, tends to swing the market.
The volatility in recent months has been high, but as we move further into the northern hemisphere weather market we may see increased volatility.
This year is already one for the history books, but the rest of the year is likely to be as ‘interesting’. Dry conditions in the US, drying conditions in France, economic woes and continued Russian aggression.
Remember to sign up to make sure you don’t miss any of our updates, these are free to access. If you want to support this service, remember to share with your network.