Oil be damned

The Snapshot
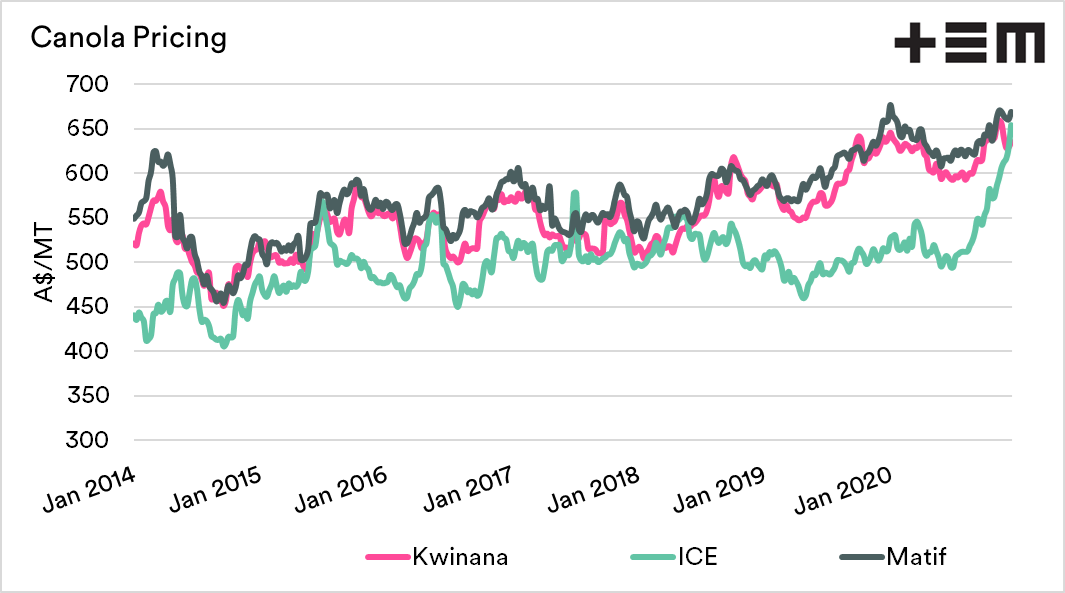
- Australian canola prices have come under some pressure due to high local production.
- Our prices tend to follow Matif rapeseed (French); in recent weeks, our pricing has diverged.
- Canadian ICE canola futures have rallied this year, and are currently higher than Australian pricing.
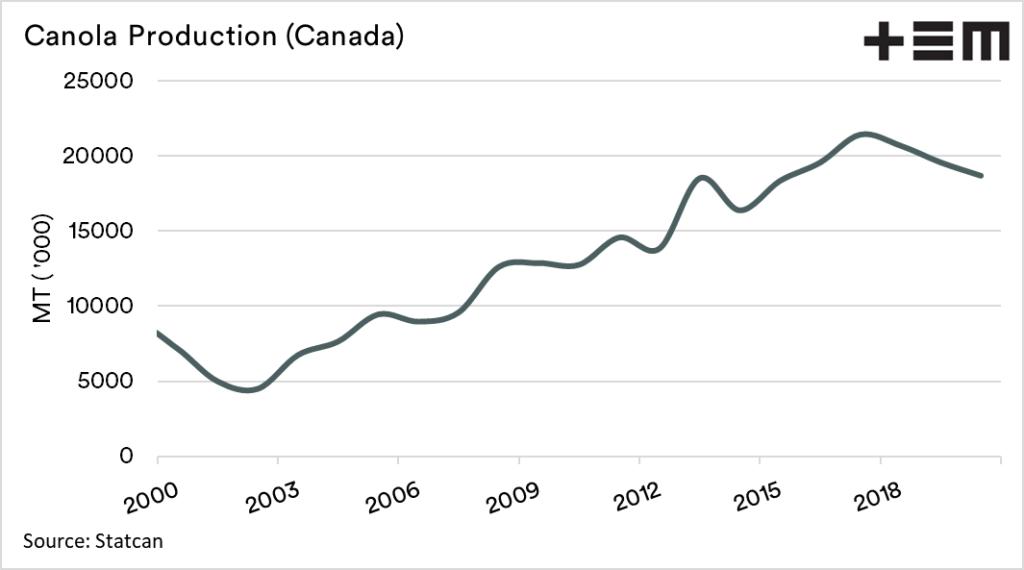
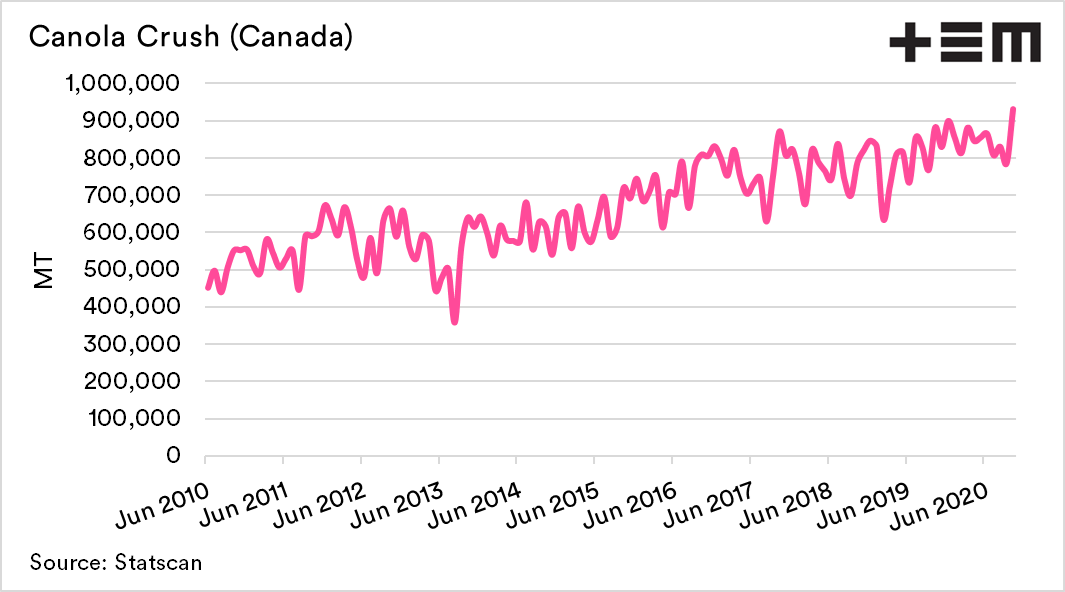
- Production of Canadian canola has dropped to the lowest level since 2015. At the same time domestic crush has grown significantly.
- The October crush figures were record levels.
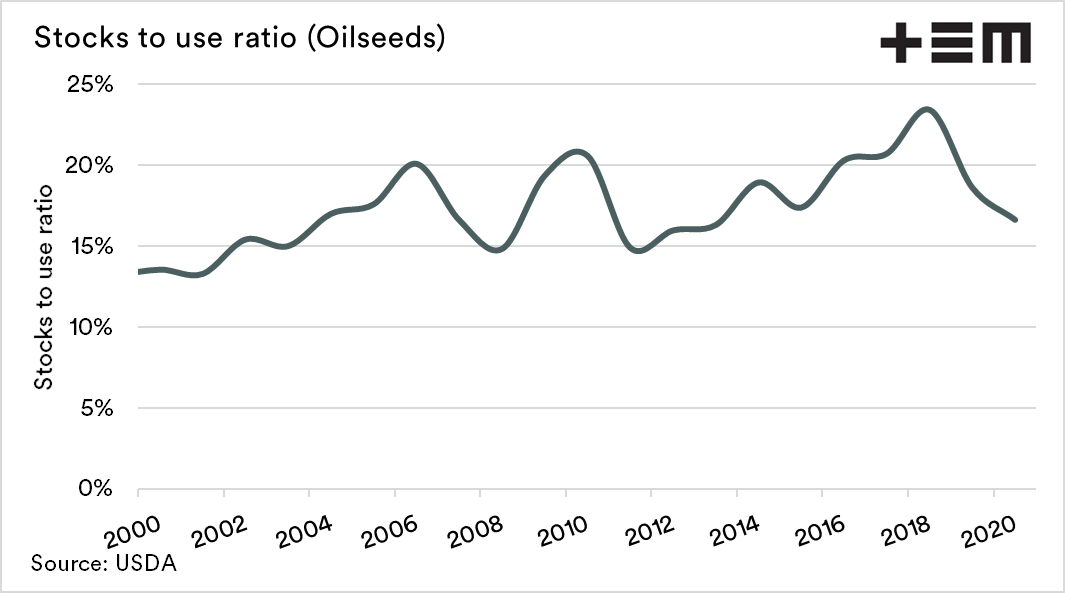
- The oilseed stocks to use ratio has declined from a record 23% in 2018 to a substantially tighter 17% this year.
- Keeping some of your canola might be a good idea this year.
The Detail
Australian canola prices have fallen from peaks during November. It isn’t surprising to see a fall in local pricing. This has occurred across most commodities as ‘harvest pressure’ puts a dampener on pricing.
Australian canola pricing tends to follow Matif (French), and ICE (Canadian) follows at a discount. This is in part due to the difference in pricing between GMO and non-GMO. Australia’s price has diverged in recent weeks with Matif remaining quite stable, and local pricing declining.
The interesting story, however, is the rapid rise in ICE canola futures this year. In A$ terms ICE futures are currently at a premium to Australian prices. What’s going on?

How’s the production, eh?
Canada canola production declined during 2020, to his 18.72mmt, the third consecutive year of falls. This places canola production at the lowest level since 2015.
The Chinese government blockages hampered the export program in 2019 based on ‘quality issues’ – yes we are all familiar with that old chestnut. This year however export demand has increased, but so has local crush demand.
Domestic crush reached 931kmt during October, a record month at a time when domestic production was low.


What about the bigger picture?
The oilseed supply and demand picture is currently facing some headwinds, from production issues around the world in conjunction with increased demand. This is good news for Australian farmers who have produced a healthy crop. Despite the recent fall, prices remain at very strong levels.
The stocks to use ratio is a valuable analysis tool, and provide a simple way of analysing the balance between supply and demand.
A high ratio is bearish for prices, and vice versa. In the chart below we have produced a stock to use ratio for the major oilseeds*.
The stocks to use ratio has had a substantial change in the past two years. In 2018 the ratio achieved a record (since 1965) of 23%. The ratio has since declined to 17%.
This leaves the overall supply and demand picture for oilseeds at quite tight levels. At present, the prospect of La Nina impacted production in South America is one spark which could see supply become constrained.
The other aspect is the increased demand in China for meal. The herd rebuild in China could lead to higher demand for feed for two reasons; lower productivity per KG of meat, and a move to industrial production.
All in all, the match is lit for a potentially buoyant 2021 in the oilseed sector. It might be worthwhile not cashing all your canola.
*Copra, cottonseed, palm kernel, peanut, canola/rapeseed, soybeans and sunflowerseed.