Market Morsel: See what condition the condition is in.

Market Morsel
The grain market is quite often US centric. Whether it is right or wrong, the US drives a lot of the market movement.
At this time of year, the conditions of their crop are a driver of markets. Poor crops, higher prices and vice versa.
The crop conditions report provides, funnily enough, data on the condition of the crop at a state and national level. The data is laid out in five categories, and the percentage of the crop which is in each category. These categories are:
- Excellent
- Good
- Fair
- Poor
- Very poor
The focus is generally at the extremes. The excellent/good and the poor/very poor. Let’s quickly look at the present conditions.
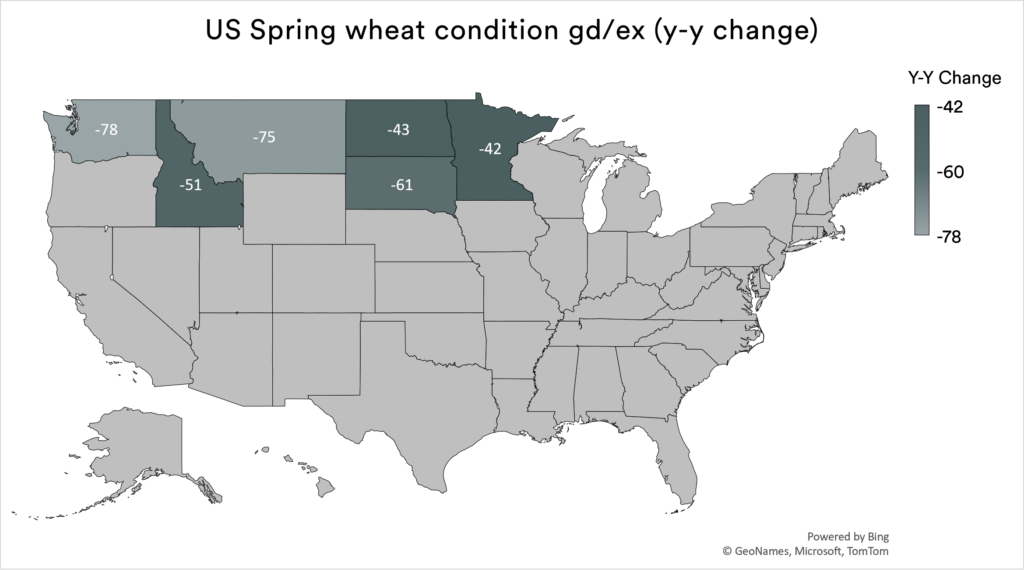
We have spoken at great length about the disastrous state of the northern US spring wheat crop (and Canada). This is being reflected in the conditions of the spring crop.
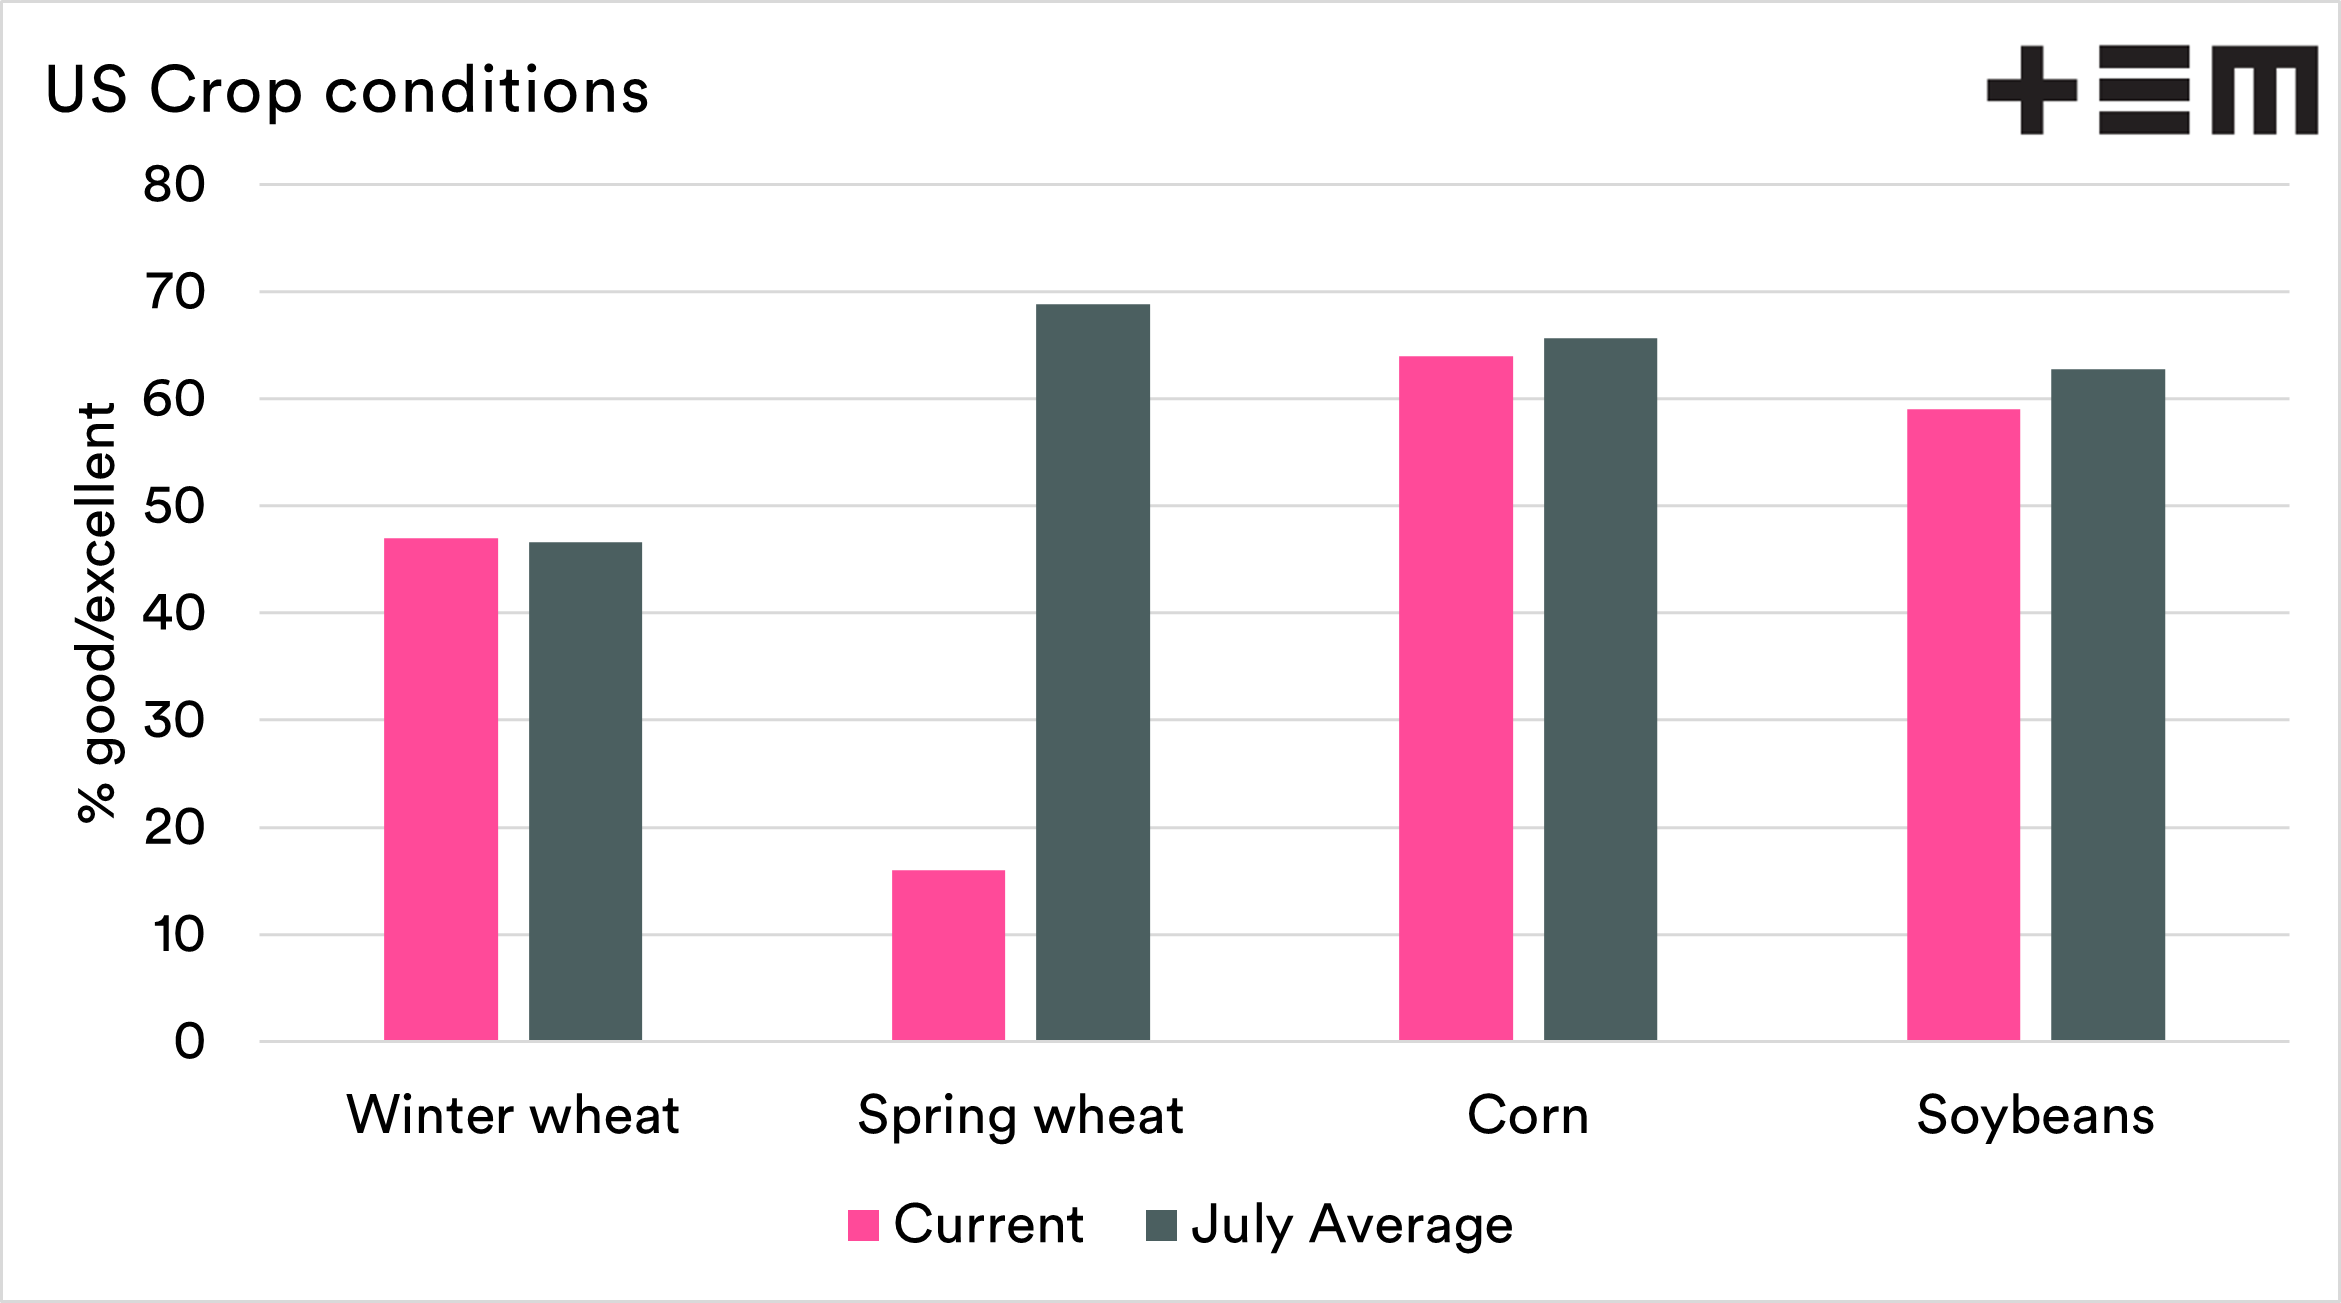
The first chart below shows the current good/excellent percentage versus the 2010-present average for July. Winter wheat, corn and soybeans are not far off the long term average, but spring is in a terrible state.
Whilst soybeans and corn are not far off the average; there is a tightness in the world.
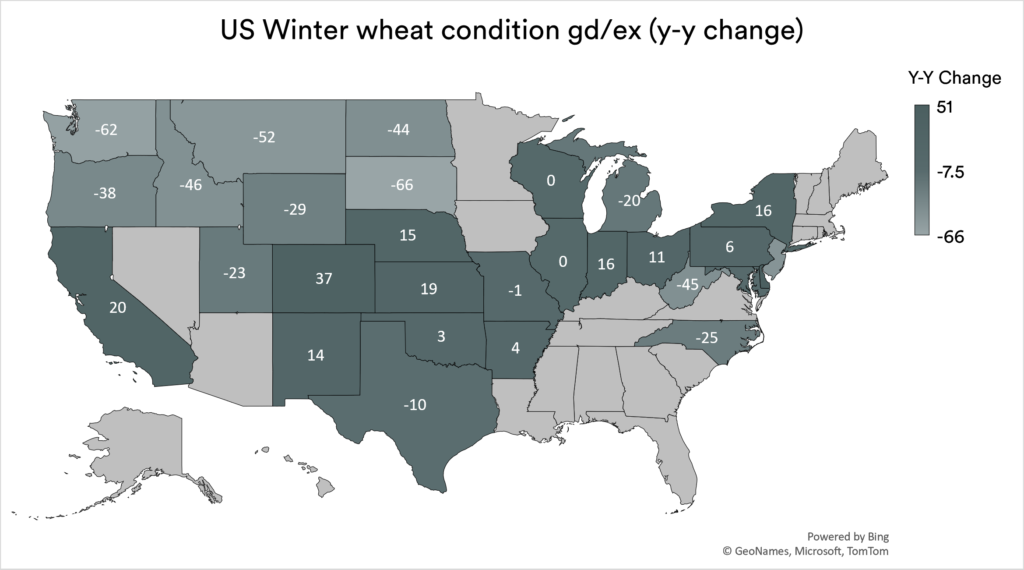
The second two maps which we produced, show the change in good/excellent condition from the same period last year for winter & spring wheat.
It’s stark, Washington for instance, has gone from 86% good/excellent to 8%!