Market Morsel: Wheat is in short supply.

Market Morsel
Late last week, I wrote about the potential of Russian wheat being on the precipice and how the market could rally significantly. You can read this article here
That article outlined that Russia is potentially in a sorry state of affairs, and their crop could be a poor performer in 2025. There is more to think about, though.
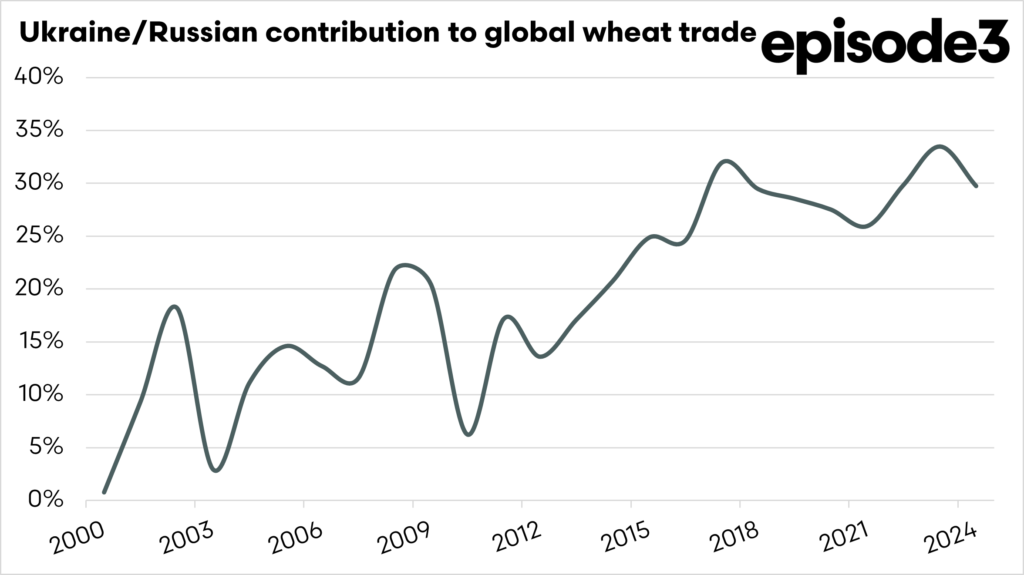
For a long time at EP3, we have been discussing the available wheat stocks. These are the countries which produce wheat and are major exporters. The top 8 wheat exporters, on average, since 2000 have contributed 88% of the global wheat trade, and when we focus on Ukraine/Russia, they contribute 30% of the global wheat trade.
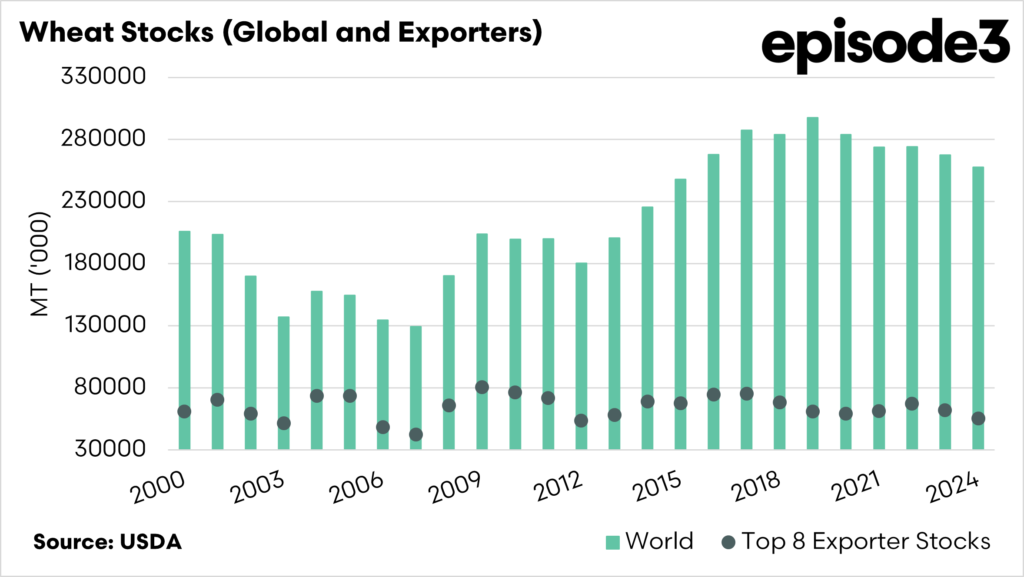
The second chart below shows that global wheat stocks have been declining since hitting a peak in 2018. Although it is important to note that China and India still account for 55% of stocks, whether they actually exist and in what state is another matter. The key for us in terms of dictating price direction is not the total stocks but the available stocks – those top 8 key exporters. The stocks of the top 8 are at the lowest level since 2012. We also need to look at the stock-to-use ratio.
The stocks-to-use ratio for wheat measures how much wheat is available in storage compared to how much is expected to be consumed or exported in a given period. It essentially shows how many days or months of supply are “in reserve.” A high stocks-to-use ratio means there’s plenty of wheat available relative to demand, which typically keeps prices stable or lower. Conversely, a low ratio indicates tighter supplies, which can lead to higher prices and increased market volatility.
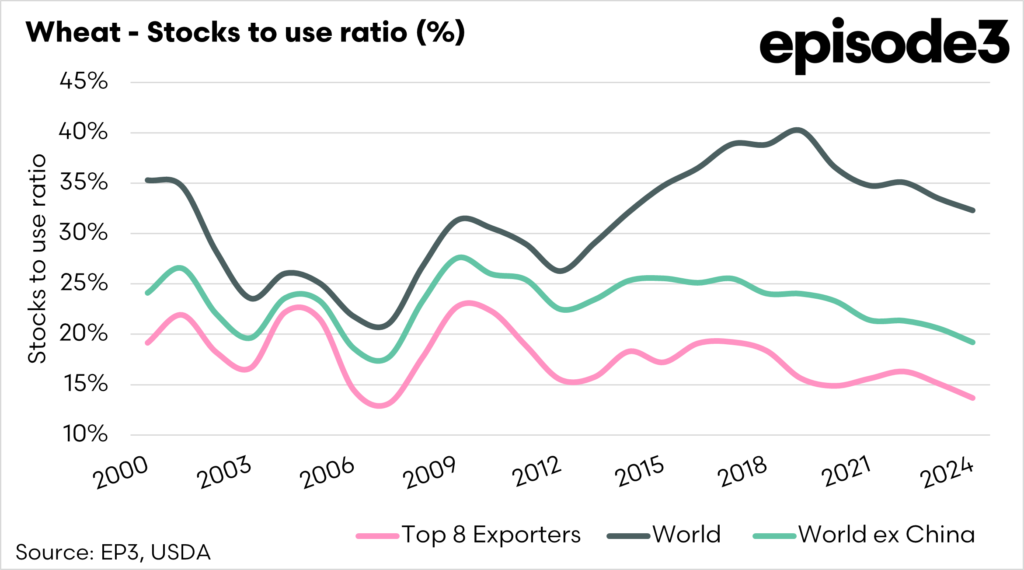
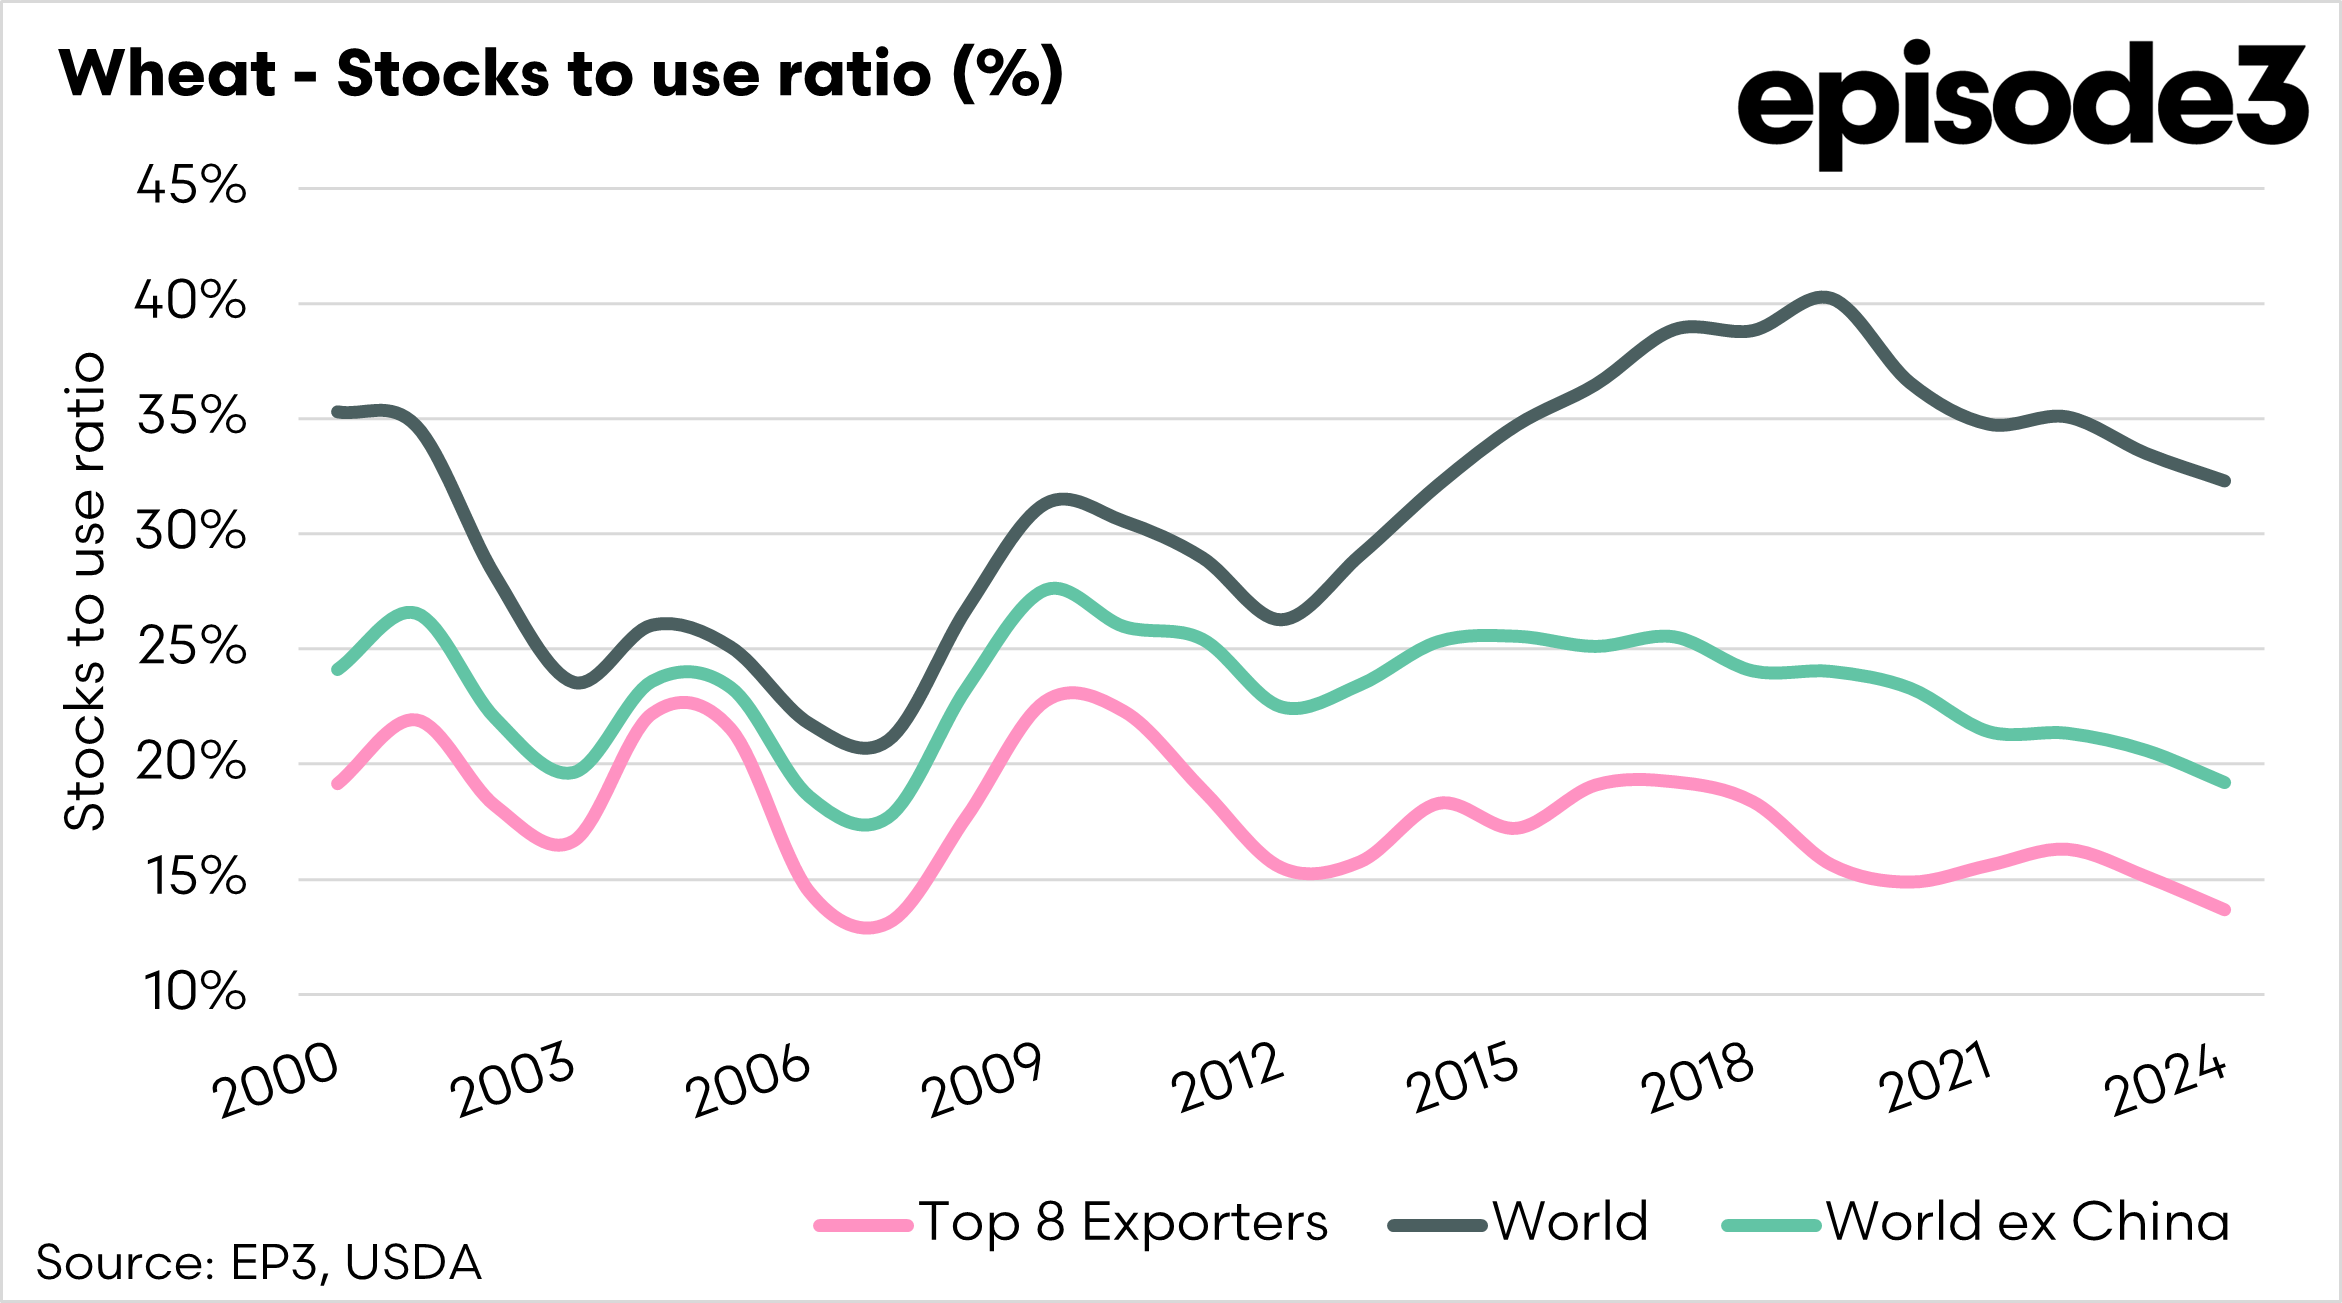
The third chart displays the STU of the world, the world minus China and the top 8 exporters. The world looks relatively healthy in terms of the stocks-to-use ratio, with approximately a third of a year’s supply in stocks. However, that doesn’t tell the whole picture.
The global STU, excluding China, is at 19%, the lowest since 2017, when it was at 18%. The top 8 STU is at 14%, the lowest since 2017 when it was at 13%.
So, at present, we are narrowly off the records for the lowest stocks-to-use ratio for the world ex china and the top 8 exporters.
This is coming at a time when we are coming into a season when Russia is potentially facing a poor winter wheat season.
If we see a period of contraction in production in only a couple of top 8 exporters, then we are facing a period where prices could rise dramatically.
Prices are driven by supply. Low supply and prices go up. That is how simple the wheat market is; on one level, availability could be stretched in 2025.

