Somewhere over the rainbow

The Snapshot
- The forward curve represents the horizon for a futures markets. It shows each trading expiry date.
- The market can be in either contango or backwardation.
- A market in contango is where the forward months are trading at a premium to present; backwardation is the opposite.
- The wheat market has tended towards contango in recent times.
- The market tends to pay ‘carry’ or a premium for forward months.
The Detail
It’s nearing the end of August, and the days are ticking down until the headers are rolling. A lot of thoughts are turning to the logistics of the operation from organising contractors to finding harvest staff. For many, the task is complicated by the imposition of hard borders.
The marketing of grain is for many, not in front of mind. However, marketing is an activity which should be conducted in advance, during and after harvesting.
Through managing your grain sales, it allows you time for other activities that arise and to mitigate the risk of adverse movements.
A tool worth using is the forward curve. The forward curve is a chart which we will often refer to in EP3 articles, as it provides a quick view of the market. The forward curve details the price for each of the contract expiry date for the futures contract of a commodity.
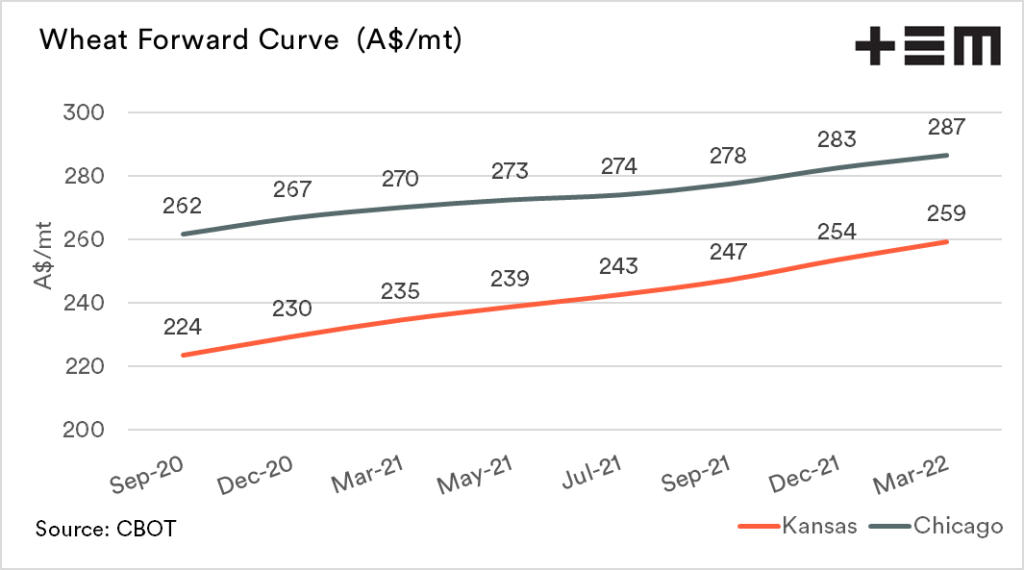
The curve gives an instant snapshot of where you could theoretically buy or sell the commodity. The below chart displays the forward curve for Kansas & Chicago wheat converted to A$/mt. This lets us know the price for each contract data between spot (Sept 2020) and March 2022.

The forward curve can be in either contango or backwardation. In typical financial/economic gobbledygook fashion, the terms sound more complicated than reality. Although there are a range of economic theories behind contango and backwardation, I’ll try to explain succinctly below.
Contango:
A forward curve is in contango when the forward futures months are at a premium to the spot level. In the above chart, the market is in contango, as each of the months ahead is higher than the September contract.
The futures market in contango is effectively paying a premium for the seller to carry the crop.
Backwardation:
As you might expect, backwardation is the opposite of contango. The forward curve is in backwardation when the forward market is trading at a discount to the spot market.
When in backwardation, the market is effectively wanting access to grain as soon as possible and does not want to pay you to carry the grain.
How to use it as a farmer?
The wheat futures market in recent years has tended to be in contango, and effectively provided a premium versus spot. This offers the opportunity to lock in futures on the forward curve i.e beyond the current harvest at a premium to spot.
It is important to note that the price can (and will) change between taking out a contract and when it expires. However, if you are locking in a price that you are happy with, then that becomes less of an issue.
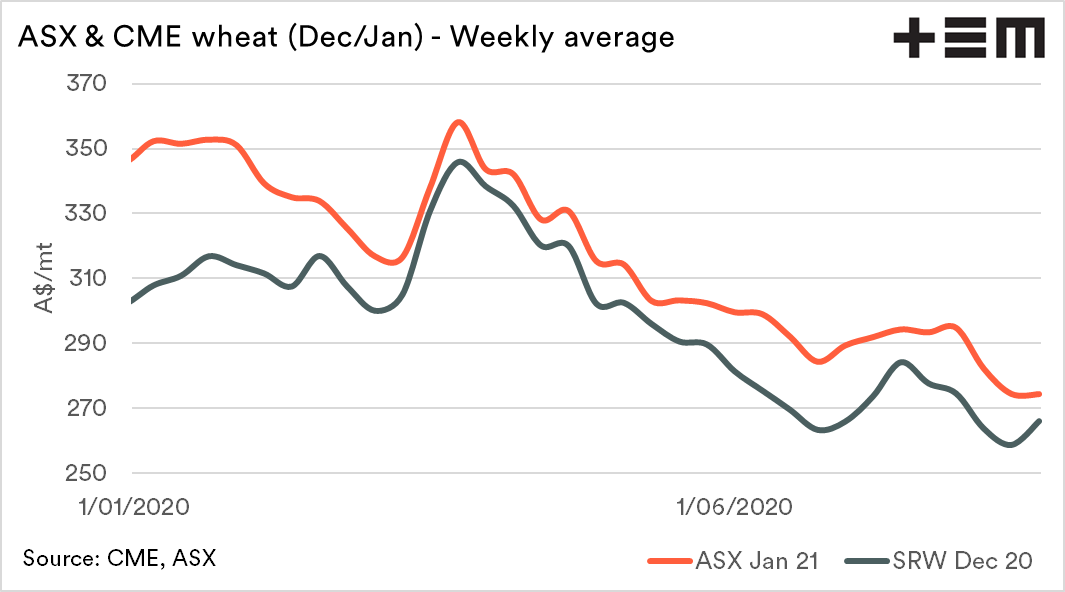
As an example during March 2020, it was possible to lock in a CBOT wheat futures price just shy of A$350 or ASX at approx A$360 (based on weekly average) for the coming harvest. On a similar time frame, the 2021/22 harvest values were A$340 for both CBOT and ASX. Since March the current crop has declined 22%, and next years crop 15%.
Through using the forward curve, you can ‘bank’ the carry, on the proviso that you are locking in a suitable value.