The world is running low on available wheat.

The Snapshot
- The wheat price has fallen from its recent highs.
- The world has strong stockpiles of wheat, at least overall.
- The situation with the top exporters is really important for global supply and demand.
- The stocks of the top exporters have been at the lowest levels since 2007.
- The stock-to-use ratio of the top exporters has been at its lowest level since 2007.
- A major disruption to supplies either through production or politics, could light a fire under wheat.
The Detail
Supply and demand is what drives agricultural markets. If there is a lot of stock of a particular commodity, then that commodity will drop in price.
We have recently seen grain prices fall under pressure and fall from recent highs. So this would point towards the world being awash with wheat. Is this the case?
Firstly, wheat doesn’t operate in a vacuum. There are other factors, in addition to wheat, that impact wheat prices (more in a later article on that). Let’s take a look at why wheat is in a precarious situation.
The first chart below displays wheat stocks. I have displayed two different sides of wheat stocks. The first is the total global stocks (green bar), and the stocks of the top 8 exporters are in the dots.
If we look at the global wheat stocks, they are actually quite high, at 252mmt. Despite these, they have reduced from the highs of 2018. If we examined the numbers just at the higher level, we’d think the world was well supplied. This isn’t 100% the case.
We closely monitor the top 8 exporters, who contribute most of the world’s exportable surplus. This wheat can be exported to countries of deficit – those in need.
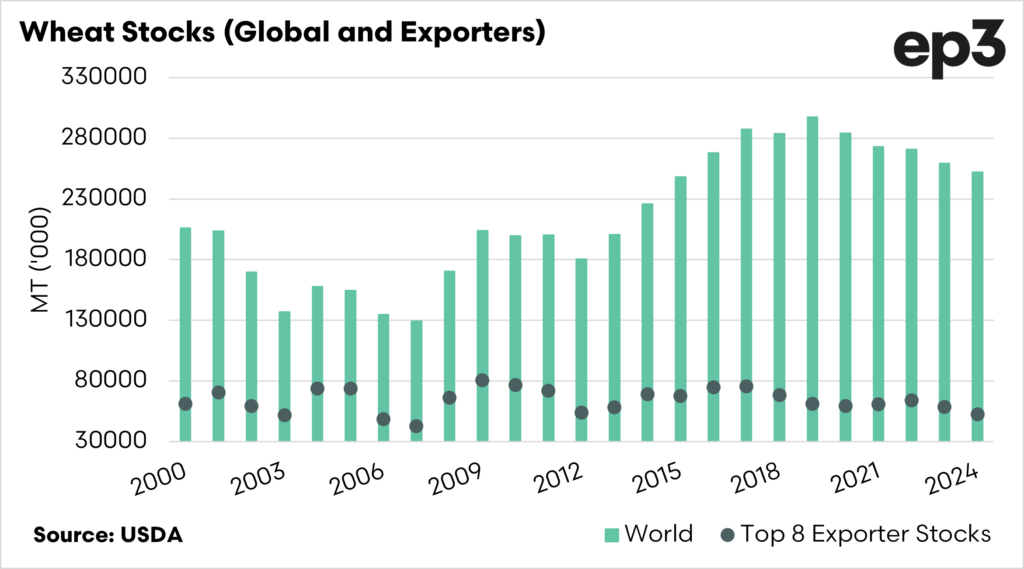

At present, the world’s wheat exporters’ stocks are at 52.6mmt, the lowest since 2007. If you recall 2007, this period was when wheat prices achieved one of their highest peaks in history.
At its peak, wheat futures achieved over 1000¢/bu, a price never achieved again until the Russian invasion of Ukraine.

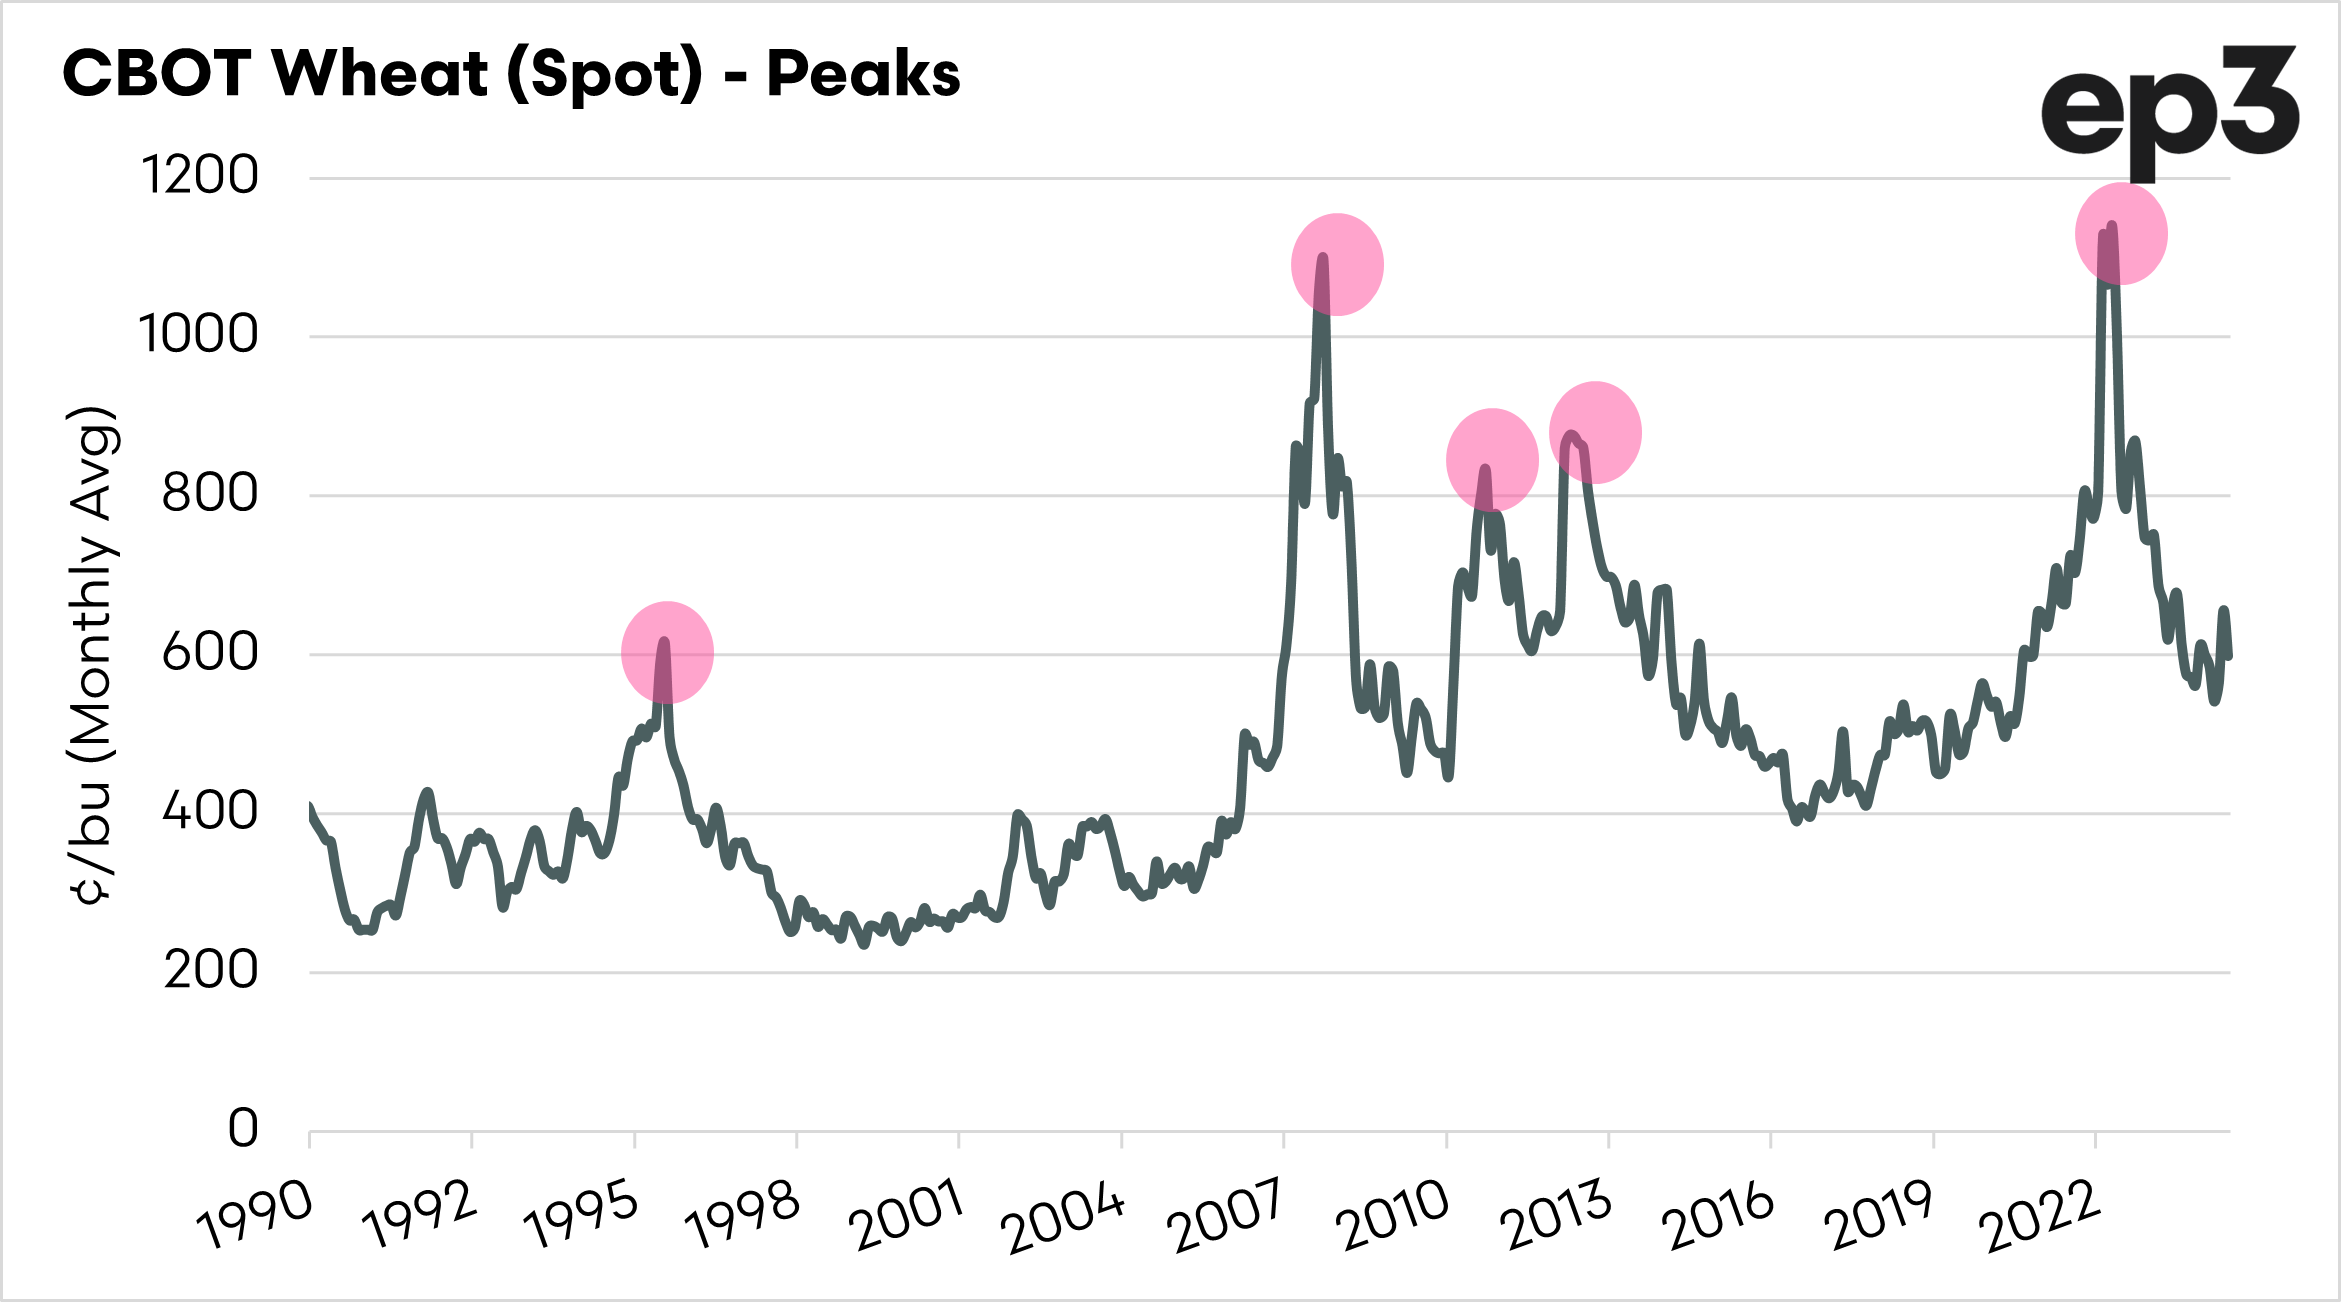
The stocks from the top exporters are low, and it will only take an incident in one or two of these to cause supplies to decline. For instance, production declines or the export blockages which have been experienced in Russia/Ukraine in recent years.
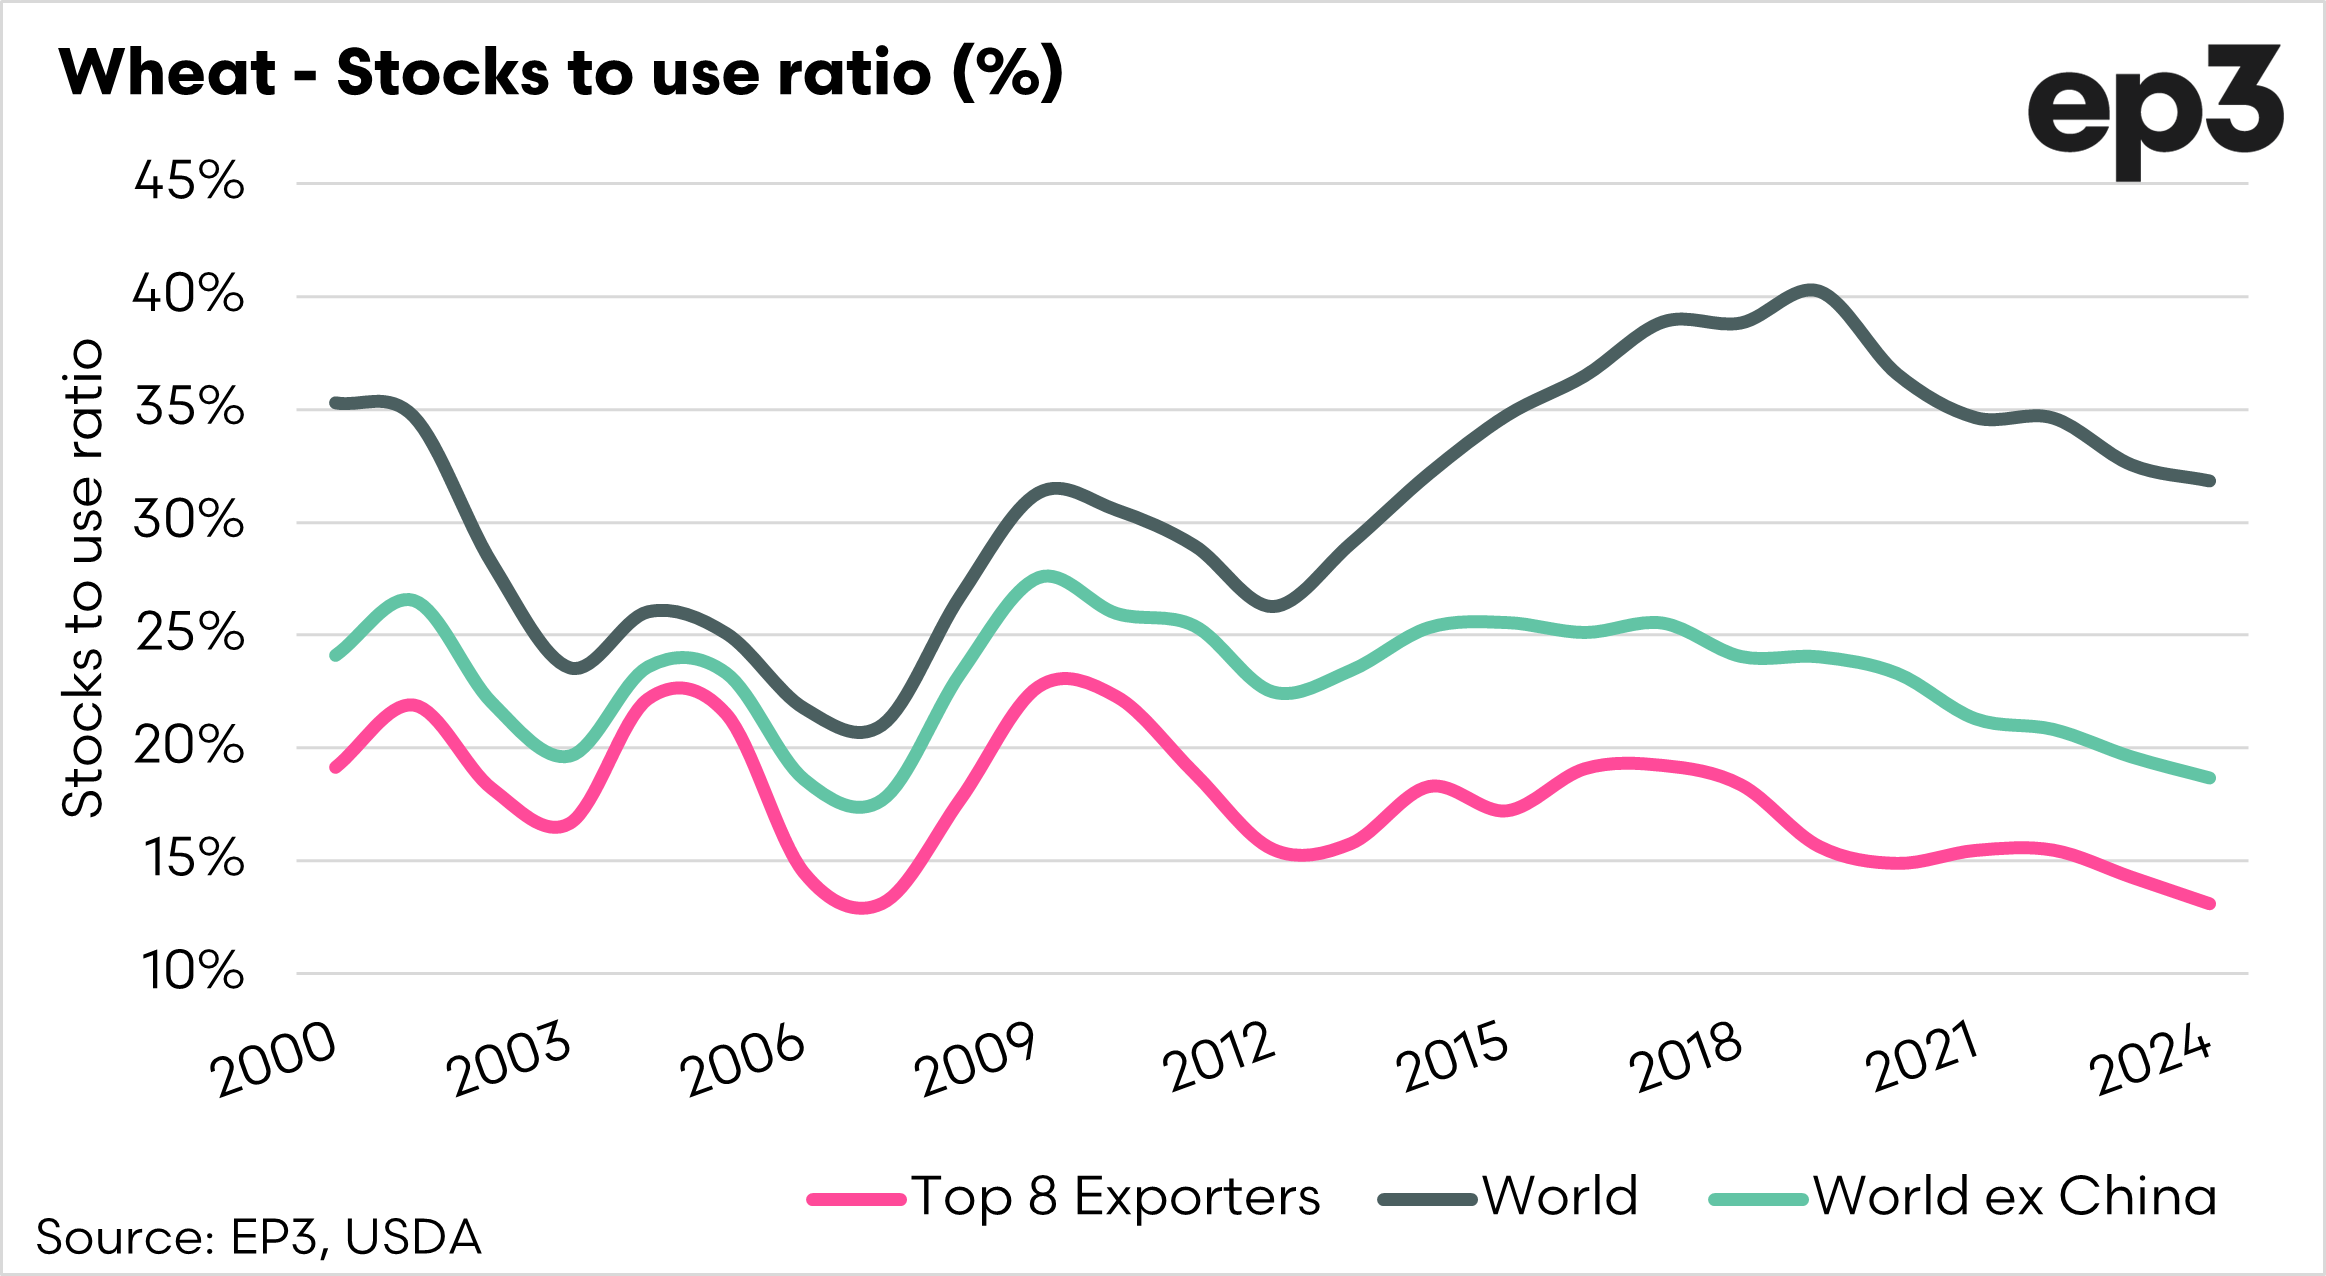
If we look further, the stocks-to-use (STU) ratio is a crucial barometer which is used to provide insight into the relationship between supply and demand.
The STU ratio can is displayed as either a % or a number of days. I prefer using a ratio, but both are showing the same thing.
A lower ratio means the world is less supplied and vice versa. In the chart below, I have separated three different scenarios.
These are the stocks to use ratios of the world, the world ex-China and the top 8 exporters. The world has a healthy stocks-to-use ratio, but the picture is different when we look at the top 8 exporters or the world without China.
The stocks-to-use ratio is tight for these two scenarios, meaning there is very little left in the pantry if something goes wrong.
Whilst this has an impact on supply and demand, it also has huge geopolitical ramifications. If we look back to 2007-2011, there was a huge increase in the number of food riots when the price of bread increased throughout the developing world.
In my view, we are at an interesting tipping point. In a coming article, we will talk about the impact of corn on wheat.