Wheat market has some chance of a revival

The Snapshot
- The wheat price has largely been sliding globally since Australian seeding finished.
- There are some underlying issues which could help wheat prices rise.
- The war in Ukraine continues to erupt, and on the weekend a civilian grain cargo was attacked.
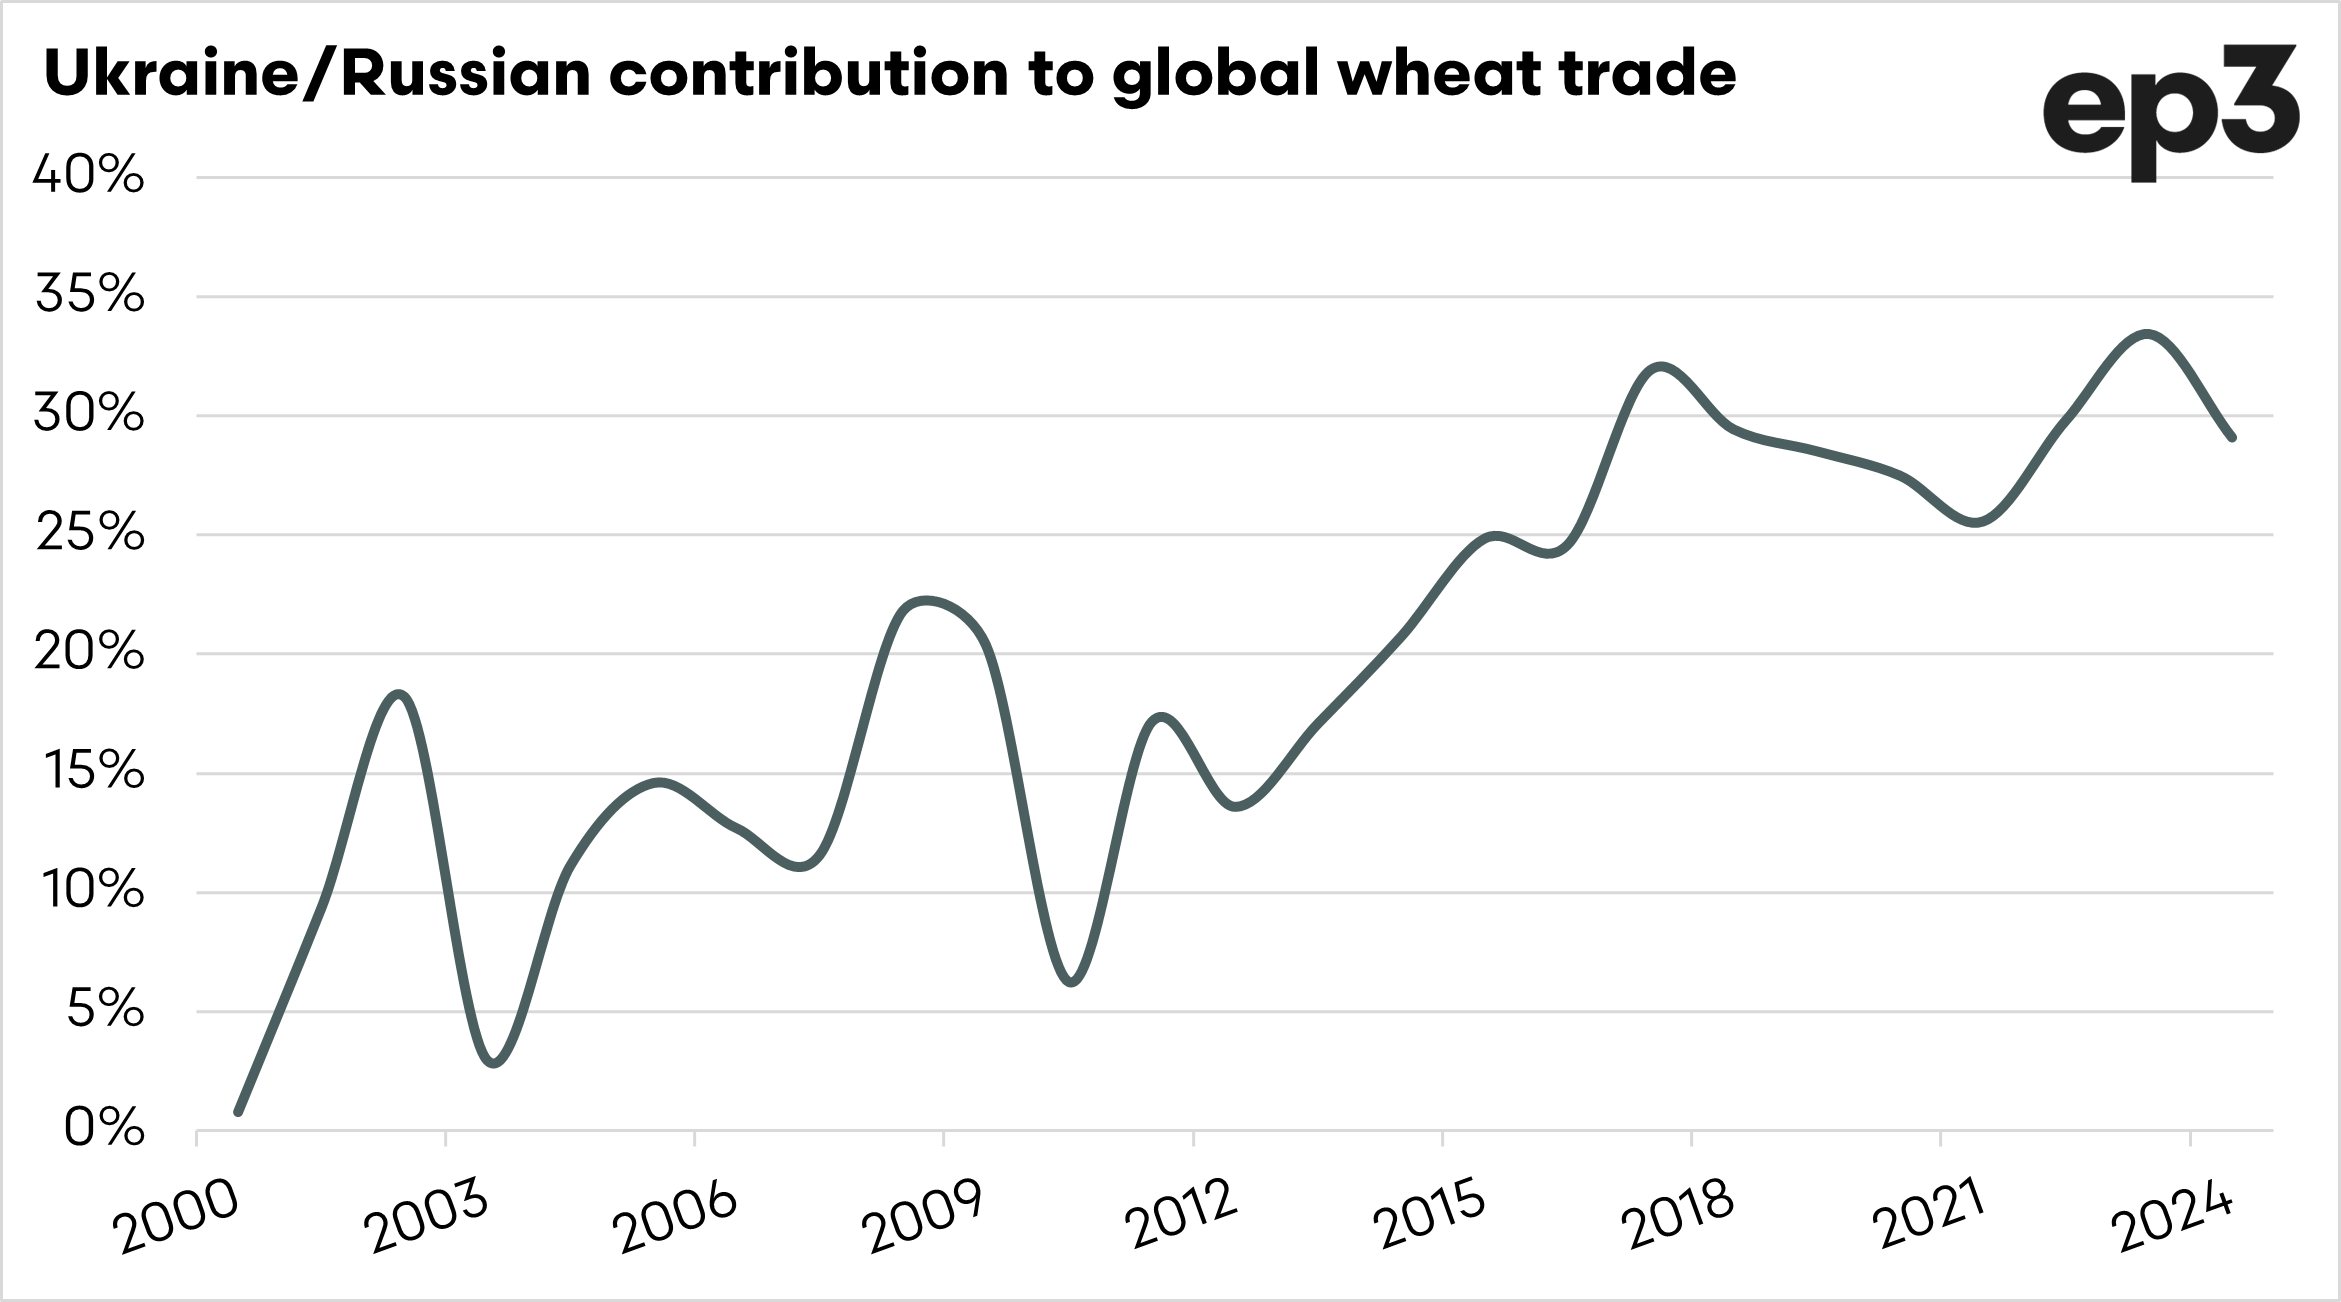
- The black sea region is responsible for nearly a third of wheat exports, sustained disruptions will cause wheat prices to take off like a rocket (no pun intended).
- The world does not have much left in the pantry if there is a major issue.
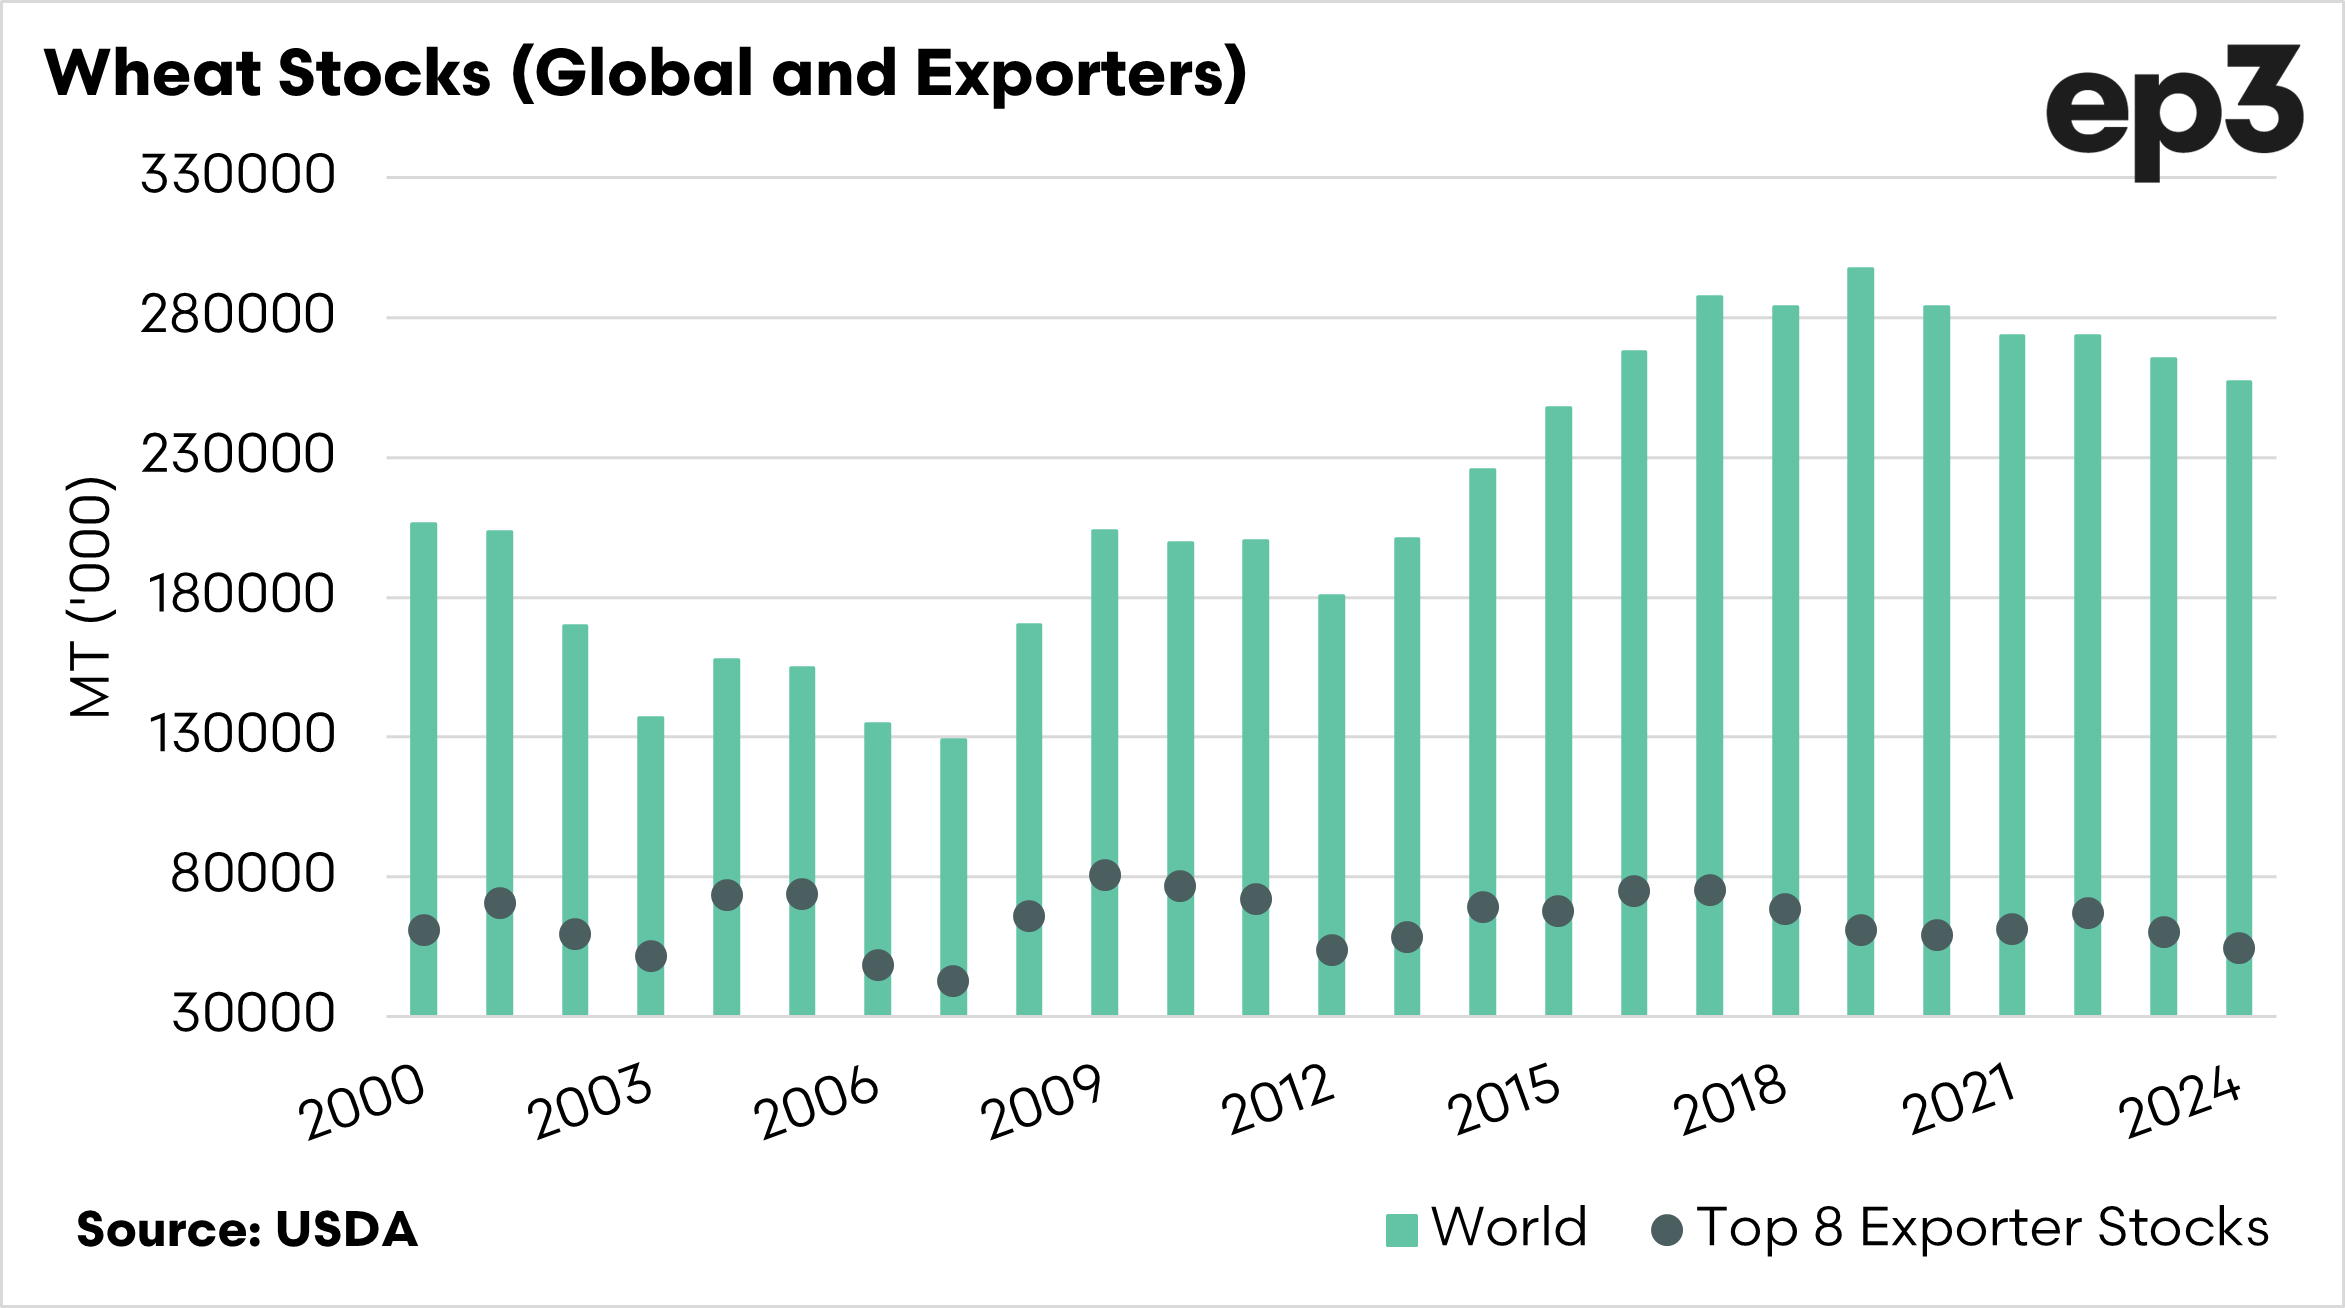
- The largest exporters stocks at the end of this year will be at the lowest level since 2012.
The Detail
The wheat market has been on a steady slide downward since the end of seeding.The market still has some potential for improvement (it always does). So I thought I would just put out a few areas of hope.
The Black Sea
The war continues in Ukraine, and whilst the grain has flowed, any conflict is volatile and has the potential to cause huge disruptions.
Last week a civilian vessel was struck by a Russian missile. This caused a temporary increase in wheat pricing as concerns mounted over threats to the black sea grain exports.
The chart below shows the contribution that Ukraine/Russia makes to the global wheat trade. It has grown massively since the turn of the century.
Until the war is over, there is no certainty that actions will not be taken against the grain supply chain. If there are sustained actions like witnessed on the weekend, then that will have ramifications for the global wheat supply chain, and therefore increase wheat pricing.
The world doesn’t have much wiggle room
There is a tendancy to look at the whole picture when examining markets. It is important to delve deeper intot he numbers.
If we look at the supply of wheat, there are some back ground concerns. The first chart below shows the global stocks of wheat, along with the top 8 exporters.
The global stocks at the end of this year are at the lowest level since 2015. This is a concern as demand has increased since then. The more important metric, in my view, is the stocks of the top 8 exporters. The stocks are at 54mmt, which is the lowest since 2012, when they were at 53mmt, so pretty much the same.
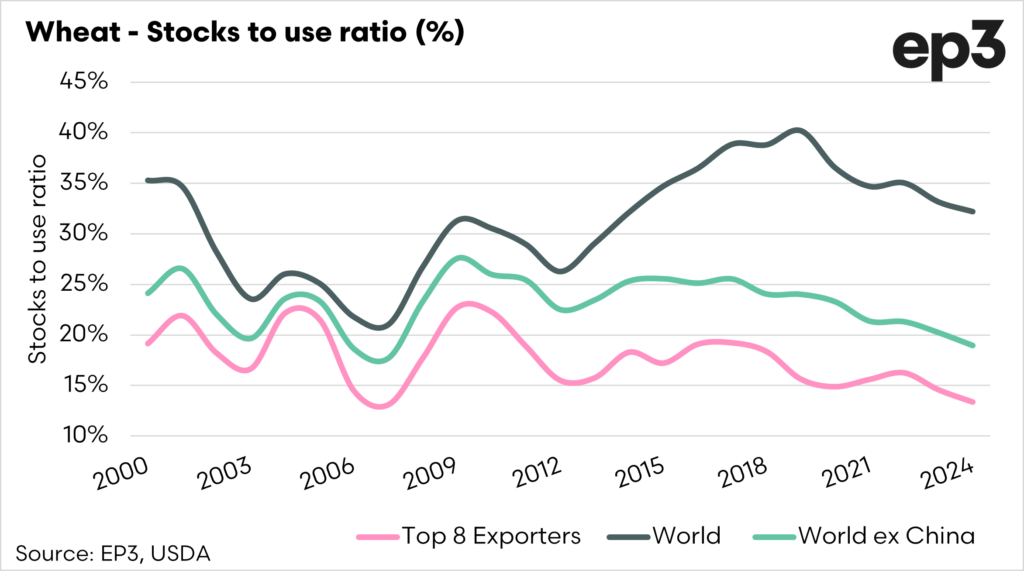
If we exclude 2012, they are the lowest since 2007. The second chart shows the stocks to use ratio, and again this highlights how tight the worlds exporters are.
In recent years we keep just getting it right and producing enough. That being said, there is very little left in the pantry if anything goes wrong in the major producers.
We are overdue a major weather issue.

