Wheat: The global forecast for this year.

The Snapshot
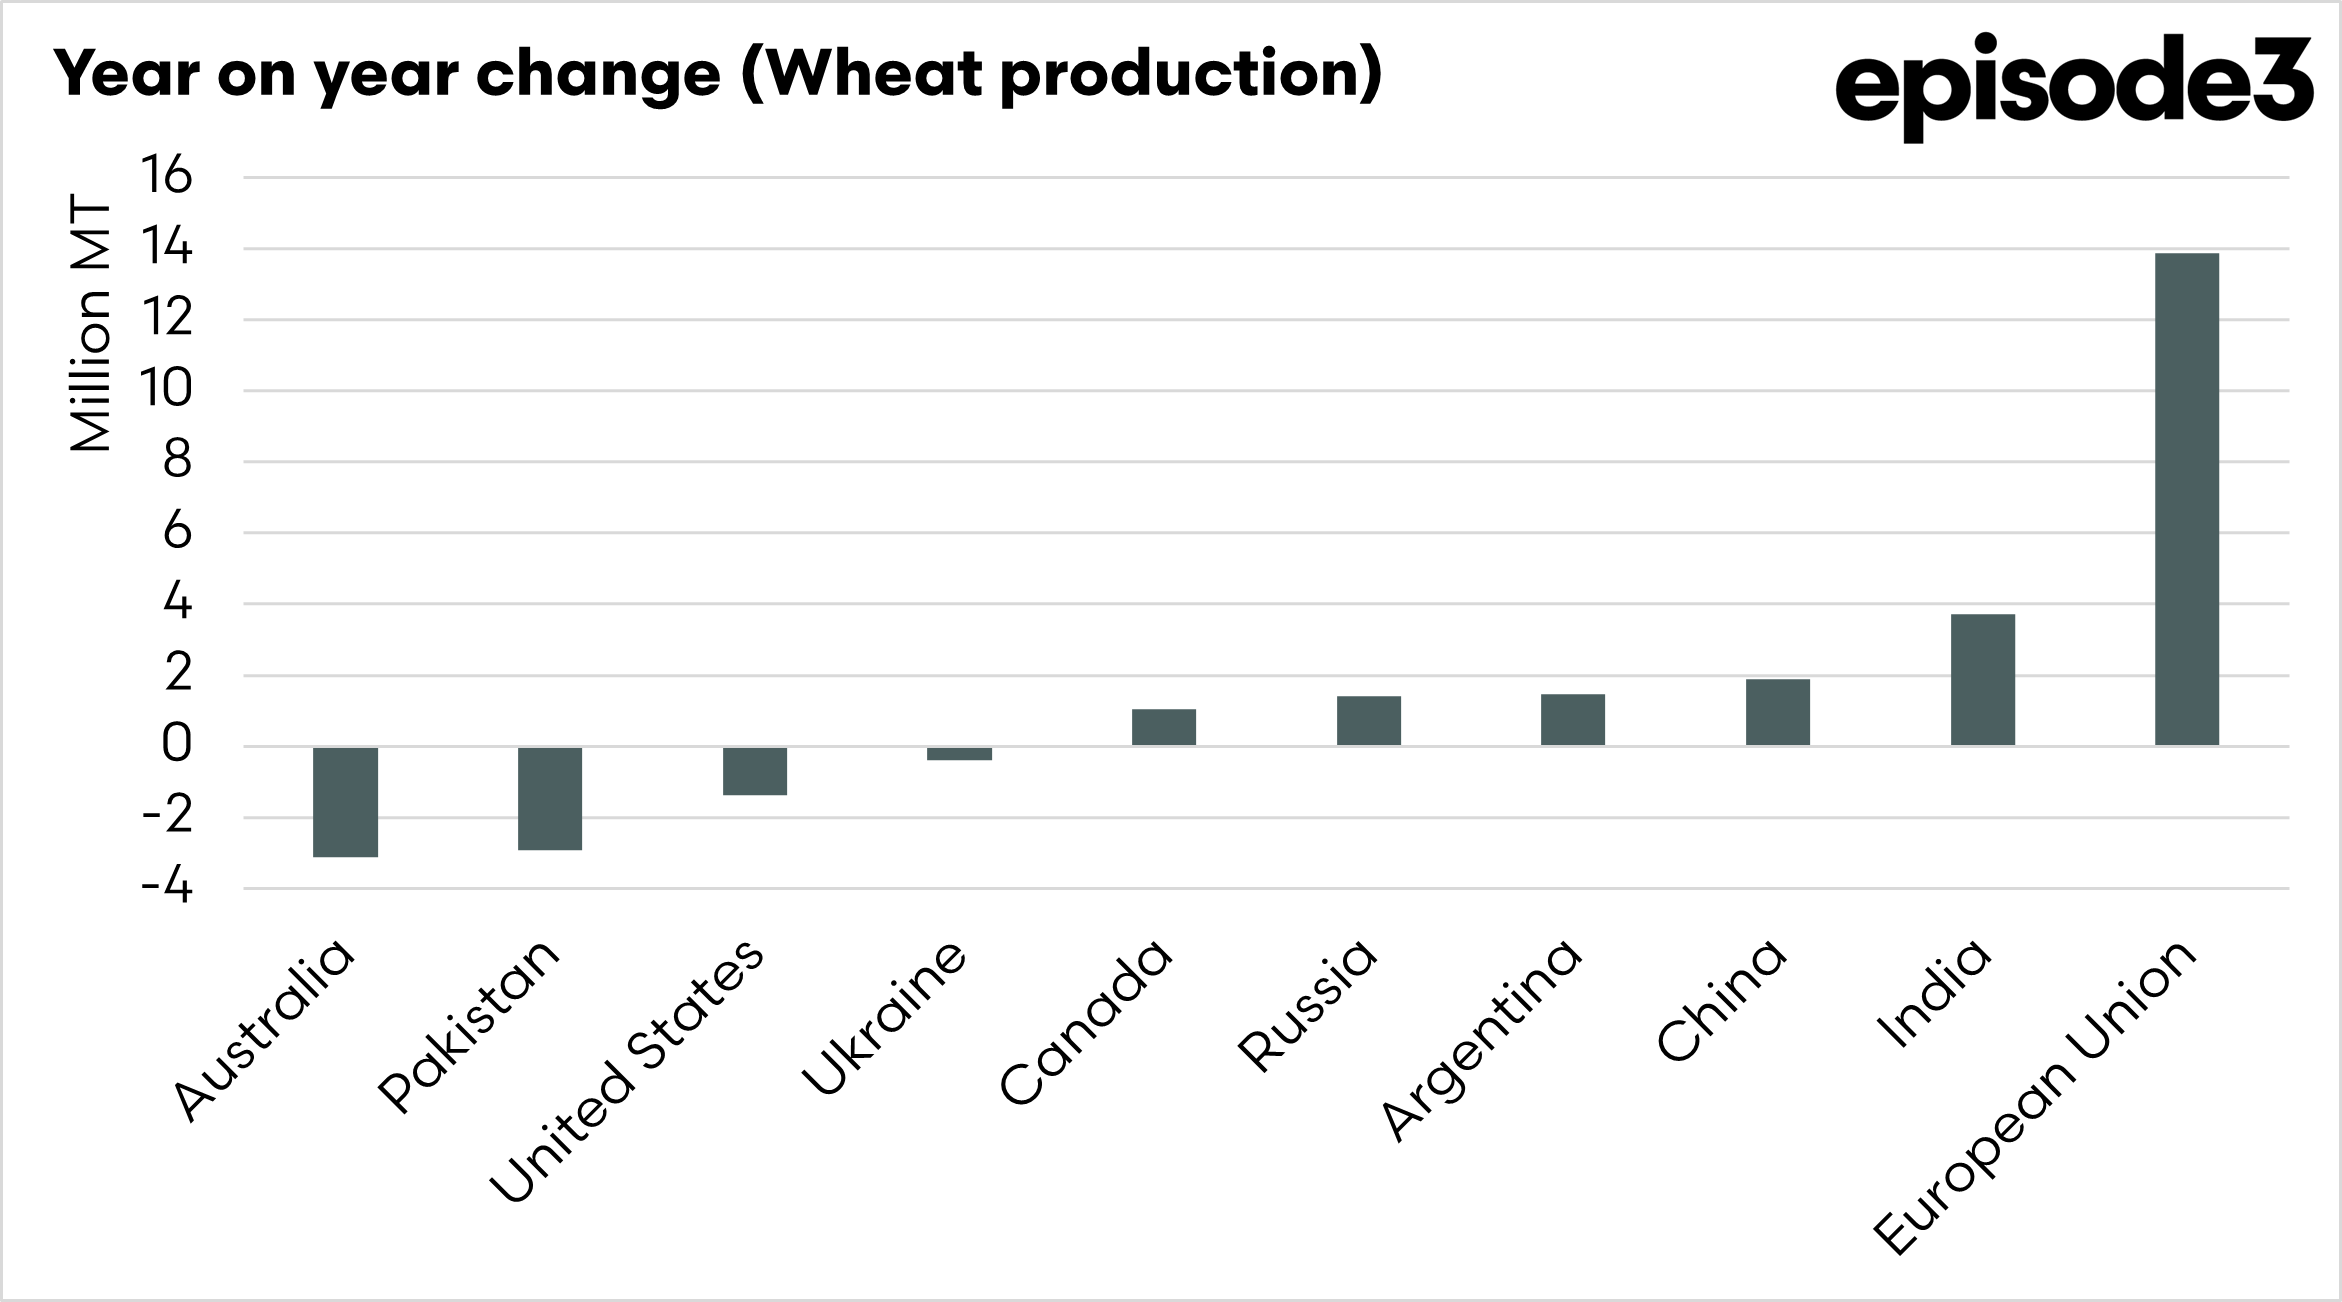
- Record global production of wheat in 2025
- Consumption is also expected to hit a record of 808 mmt.
- Ending stocks higher to 265.7mmt
- 53% of the world’s wheat is held in China and India.
- The stocks to use ratio for the world is flat
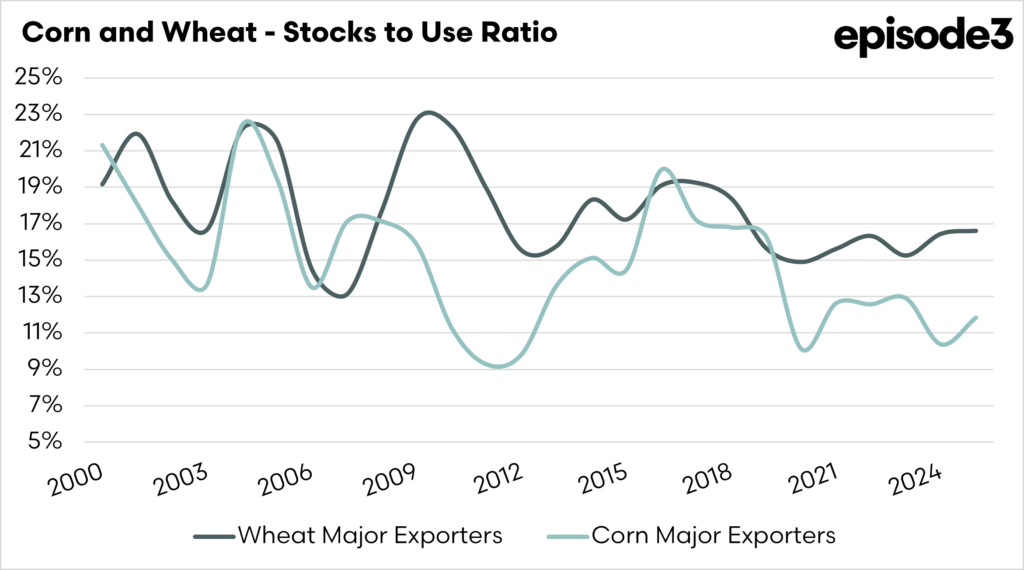
- The stocks-to-use ratio for the top 8 exporters has increased.
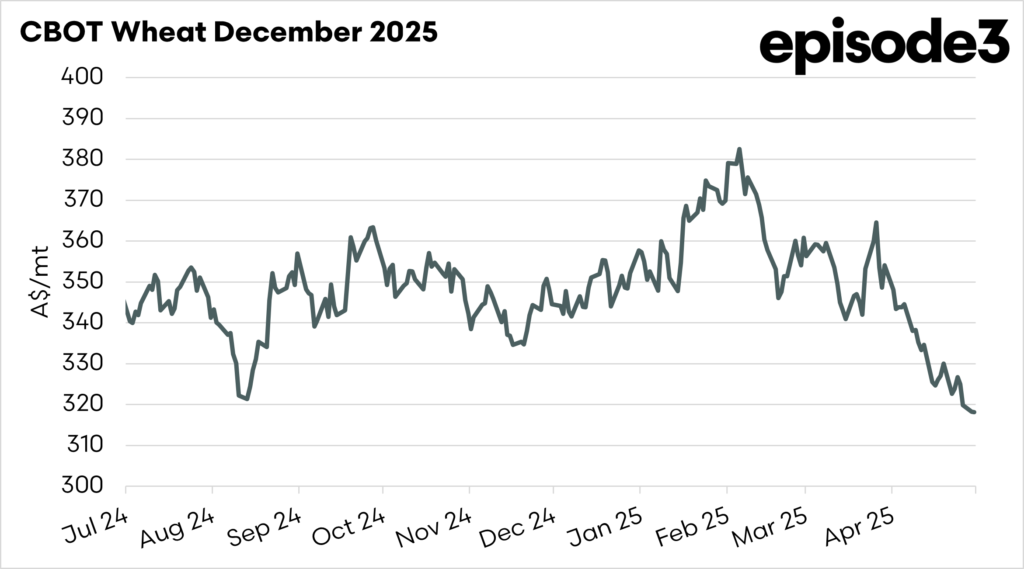
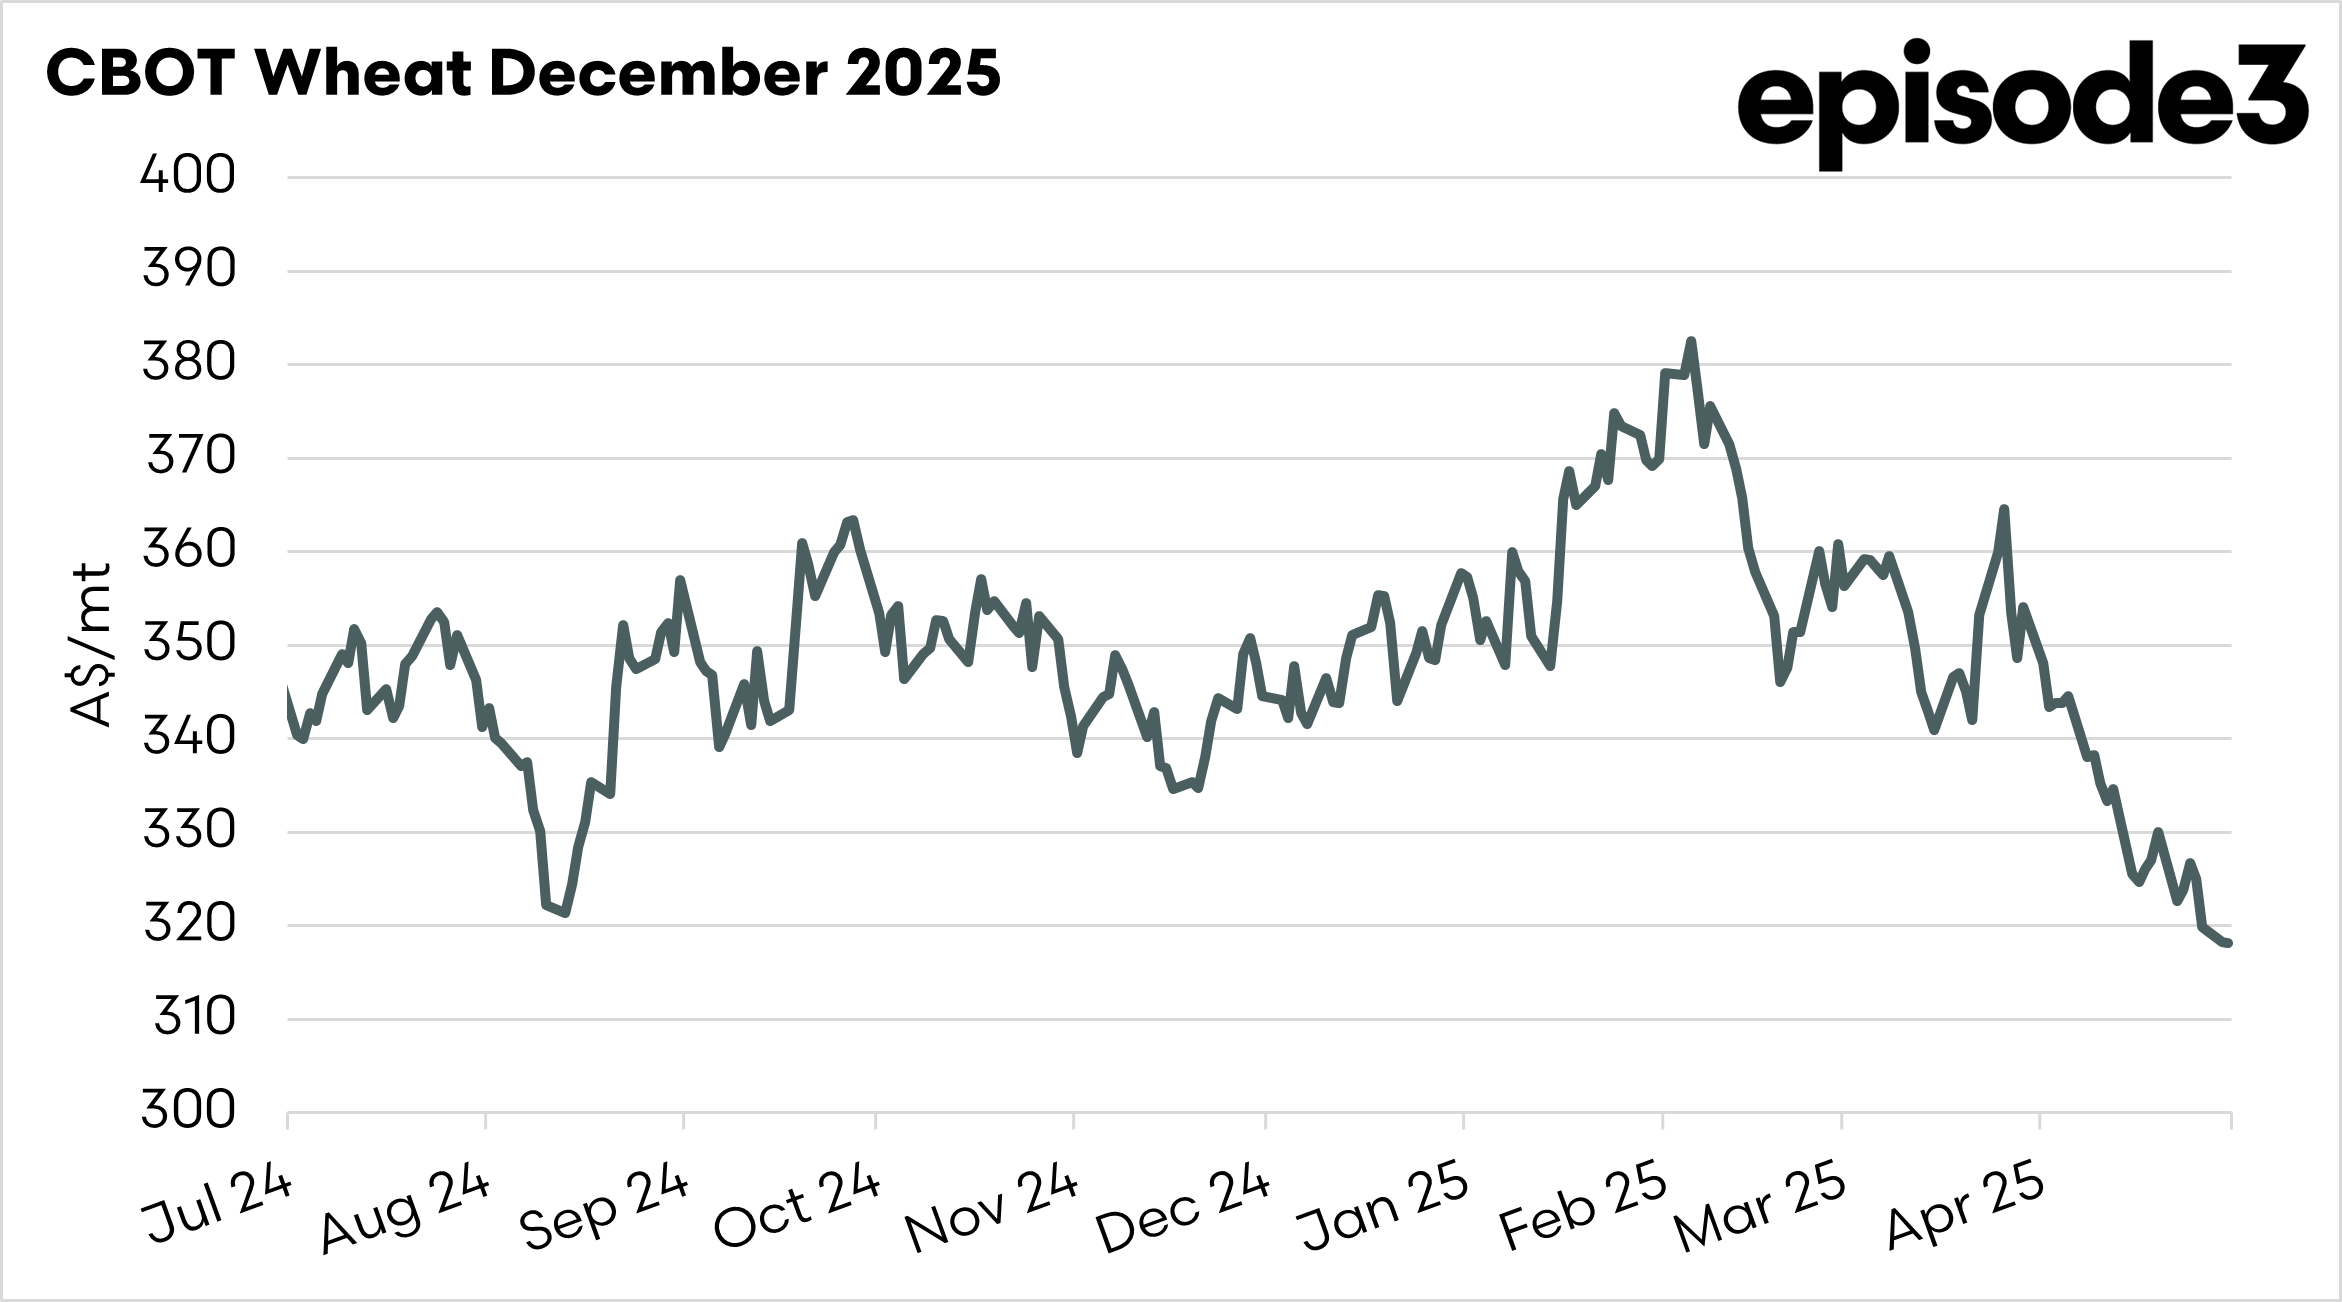
- The wheat market has been soft, and this report doesn’t help.
The Detail
The USDA have released their May WASDE report. This report is the first one of the year, which will forecast the global supply and demand estimates for the 2025 crop. The report, known as the World Agricultural Supply and Demand Estimates, is issued monthly and provides an indication of the global balance sheet for a range of commodities.
So what did it have in store?
The global wheat balance sheet is not welcome news for Australian farmers. The world’s production is set to hit a record 808.5 mmt. Australia is set for a fall of 3.1mmt to 31mmt, although that is still dependent on Australia not drying out, the fall in Australia and other exporters is offset by the EU. The European Union has seen a huge rise in production to 136 mmt.

The stocks-to-use ratio is a handy way to understand how tight or plentiful grain supplies are in any given year. It compares two key figures: how much grain is expected to be left over at the end of the season and how much is expected to be used over the year, either through local consumption or exports. This number is usually shown as a percentage and helps people working in agriculture,, like farmers, grain traders, and food companies, gauge how balanced the supply and demand are.
When the stocks-to-use ratio is low, it means that most of the available grain is being used up, with not much left over. This can make the market nervous, especially if there is a risk of poor weather or a smaller harvest next season. In these cases, grain prices often rise because buyers want to secure the supply while they still can. On the other hand, a high stock-to-use ratio means plenty of grain is stored compared to how much is used. That can help keep prices steady or even push them down, as there’s less urgency for buyers and more comfort in knowing supply is secure.
Because it’s such a useful indicator of supply pressure, analysts, policymakers, and everyone involved in the grain supply chain closely watch the stocks-to-use ratio. It’s one of the best ways to quickly understand whether grain markets will likely be calm or volatile.

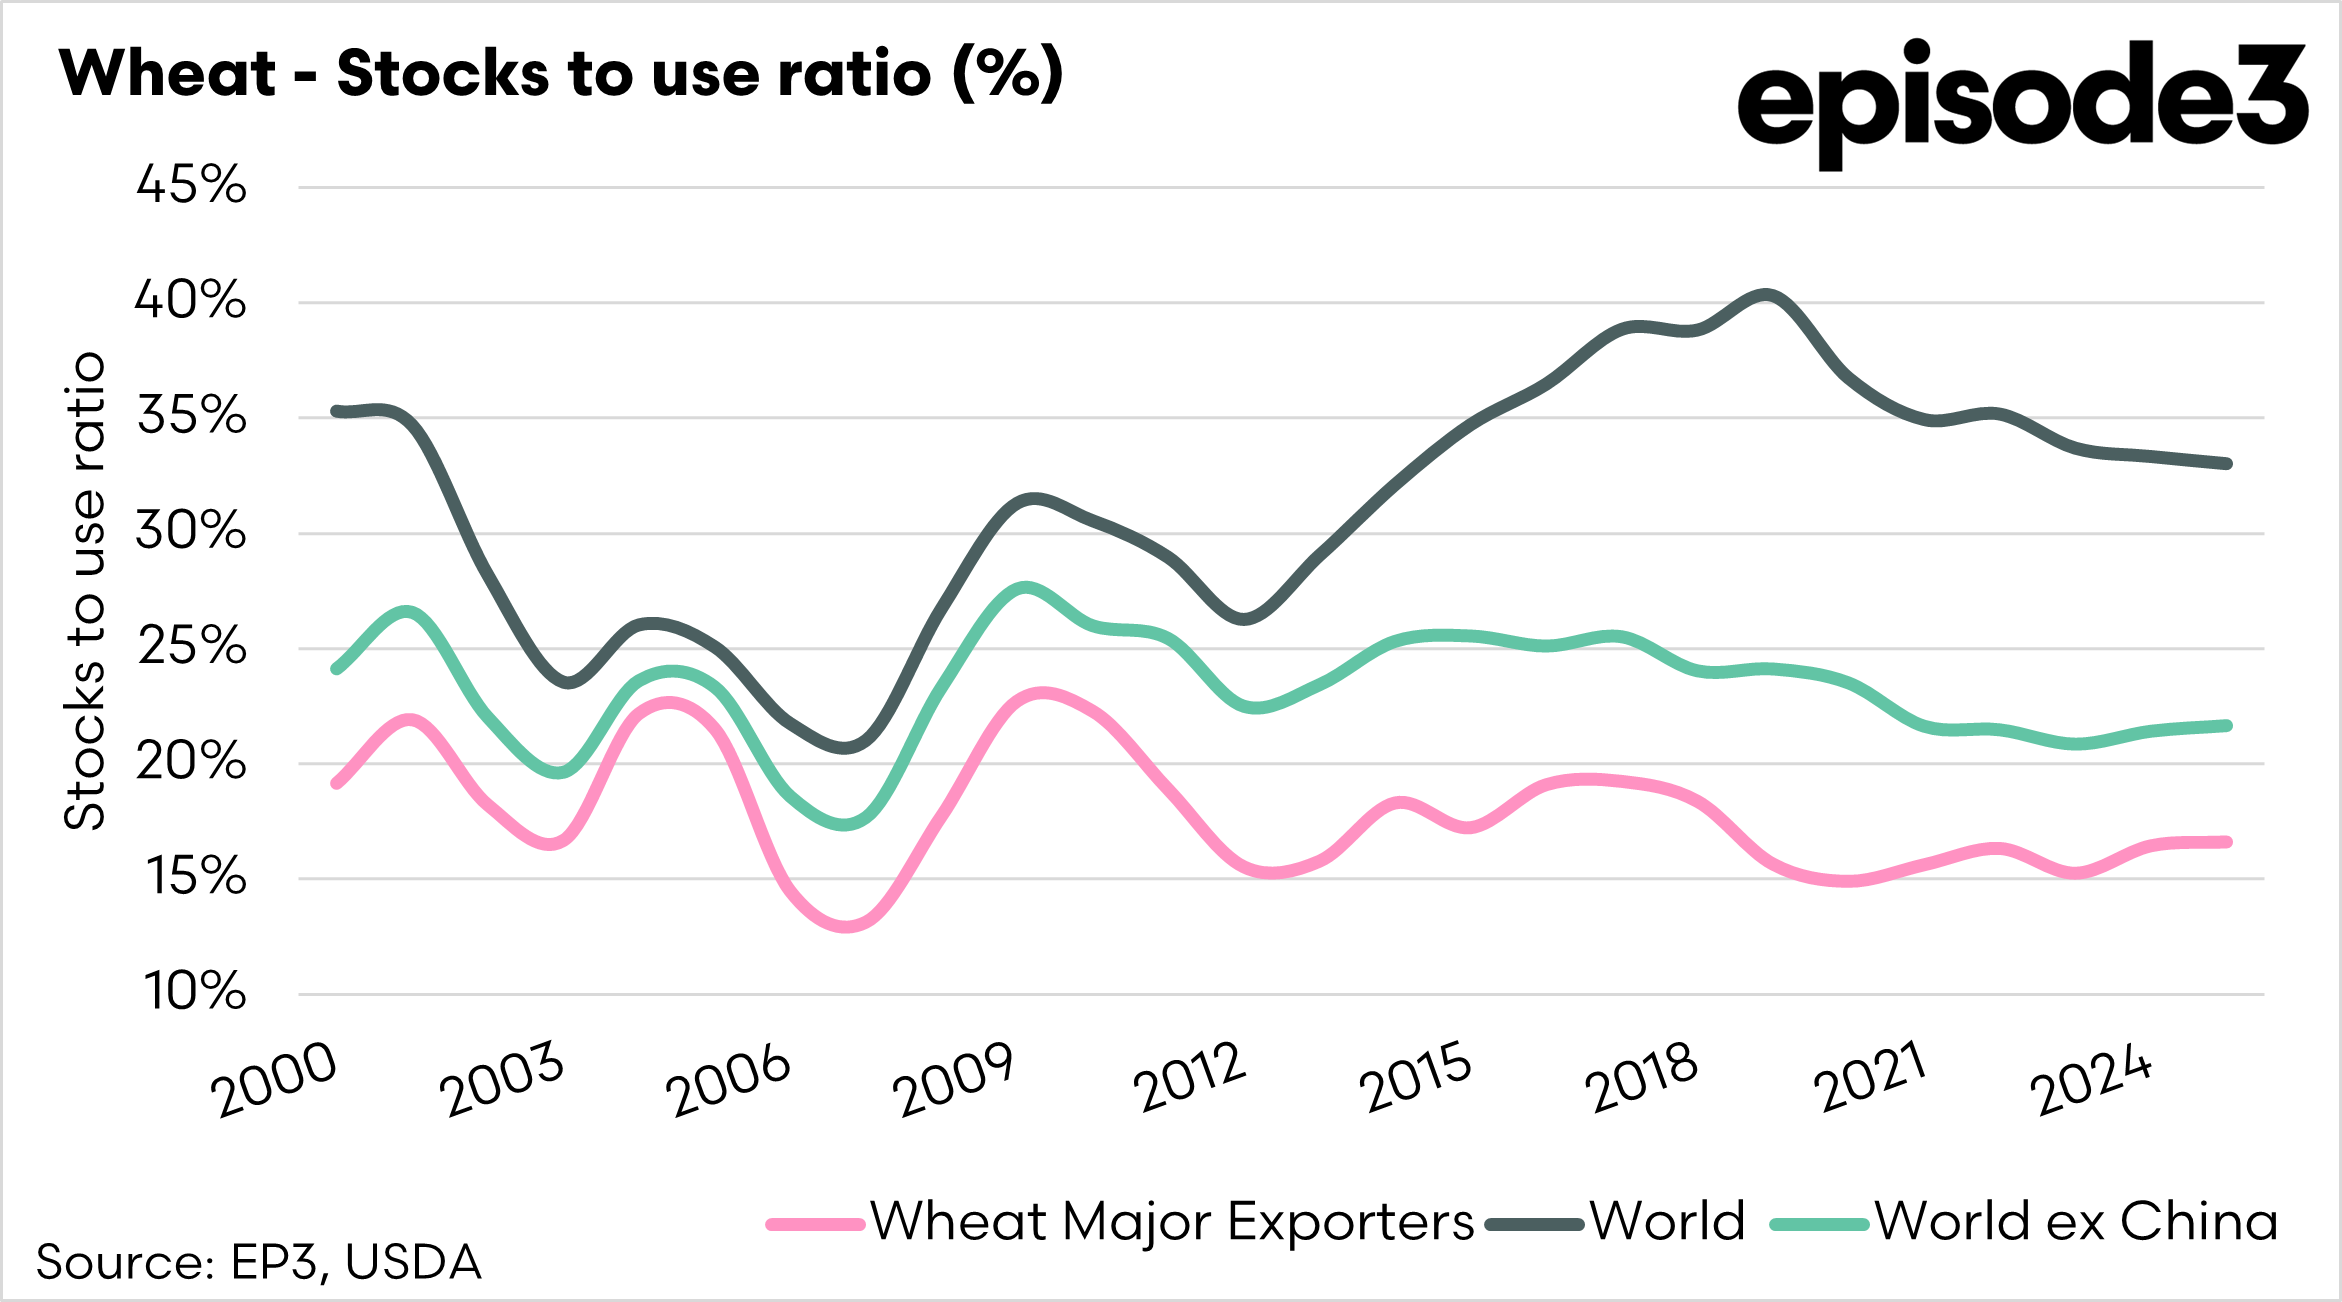
The stocks-to-use ratio for wheat overall has stayed at 33%, which is a pretty healthy level. The stock-to-use ratio of the wheat major exporters is more concerning for farmers, as it has increased to 16.6%, which, whilst still tight, is going to make buyers believe there are ample supplies globally.
The closer we get to the northern hemisphere harvest without a significant disruption to production, the more sure this forecast will become.

This article won’t look too closely at corn, as we will cover this later on in the week. Overall, the WASDE report showed both record production and consumption, which will lead to lower ending stocks. If forecasts are correct, it could be the lowest stocks at the end of this year in over a decade.
Overall, the WASDE was not overly supportive of wheat pricing. I would condition this, in that this is just a forecast, and things can change quickly, but at present the world is still well supplied with wheat.
Wheat futures have been sliding for most of the past two months, and global factors will largely determine our pricing.