Market Morsel: The MAP to guide you to DAP.
Market Morsel
It’s time to start thinking about fertilizer for next season. As always, we will be covering fertilizer on a monthly basis in an independent fashion. Analysts must be independent and not try to sell you fertilizer on instruction from head office……
In this article, I want to take a quick look at MAP/DAP. Whilst MAP and DAP are different, they tend to price at very similar levels. To an extent, we can use them interchangeably.
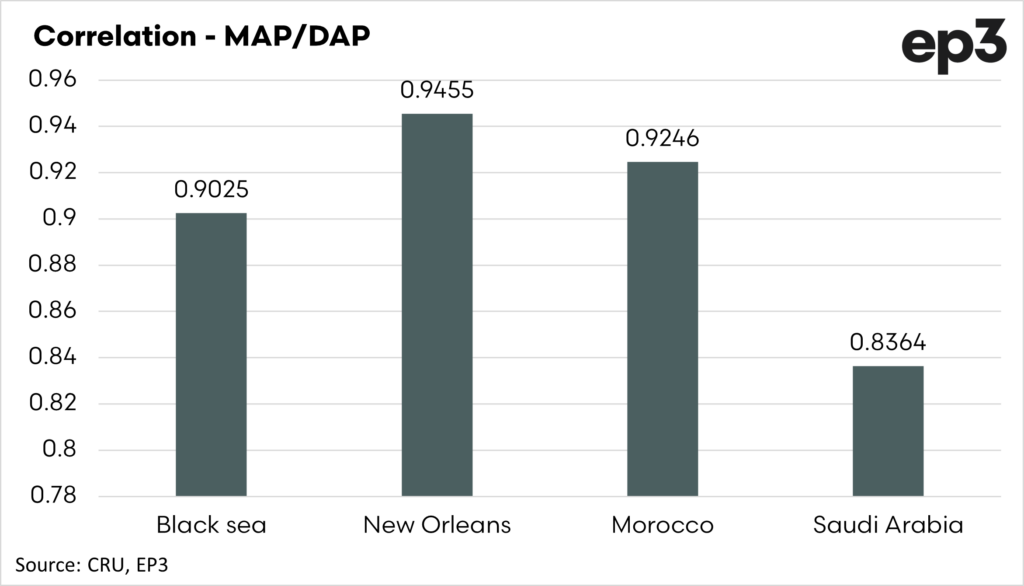
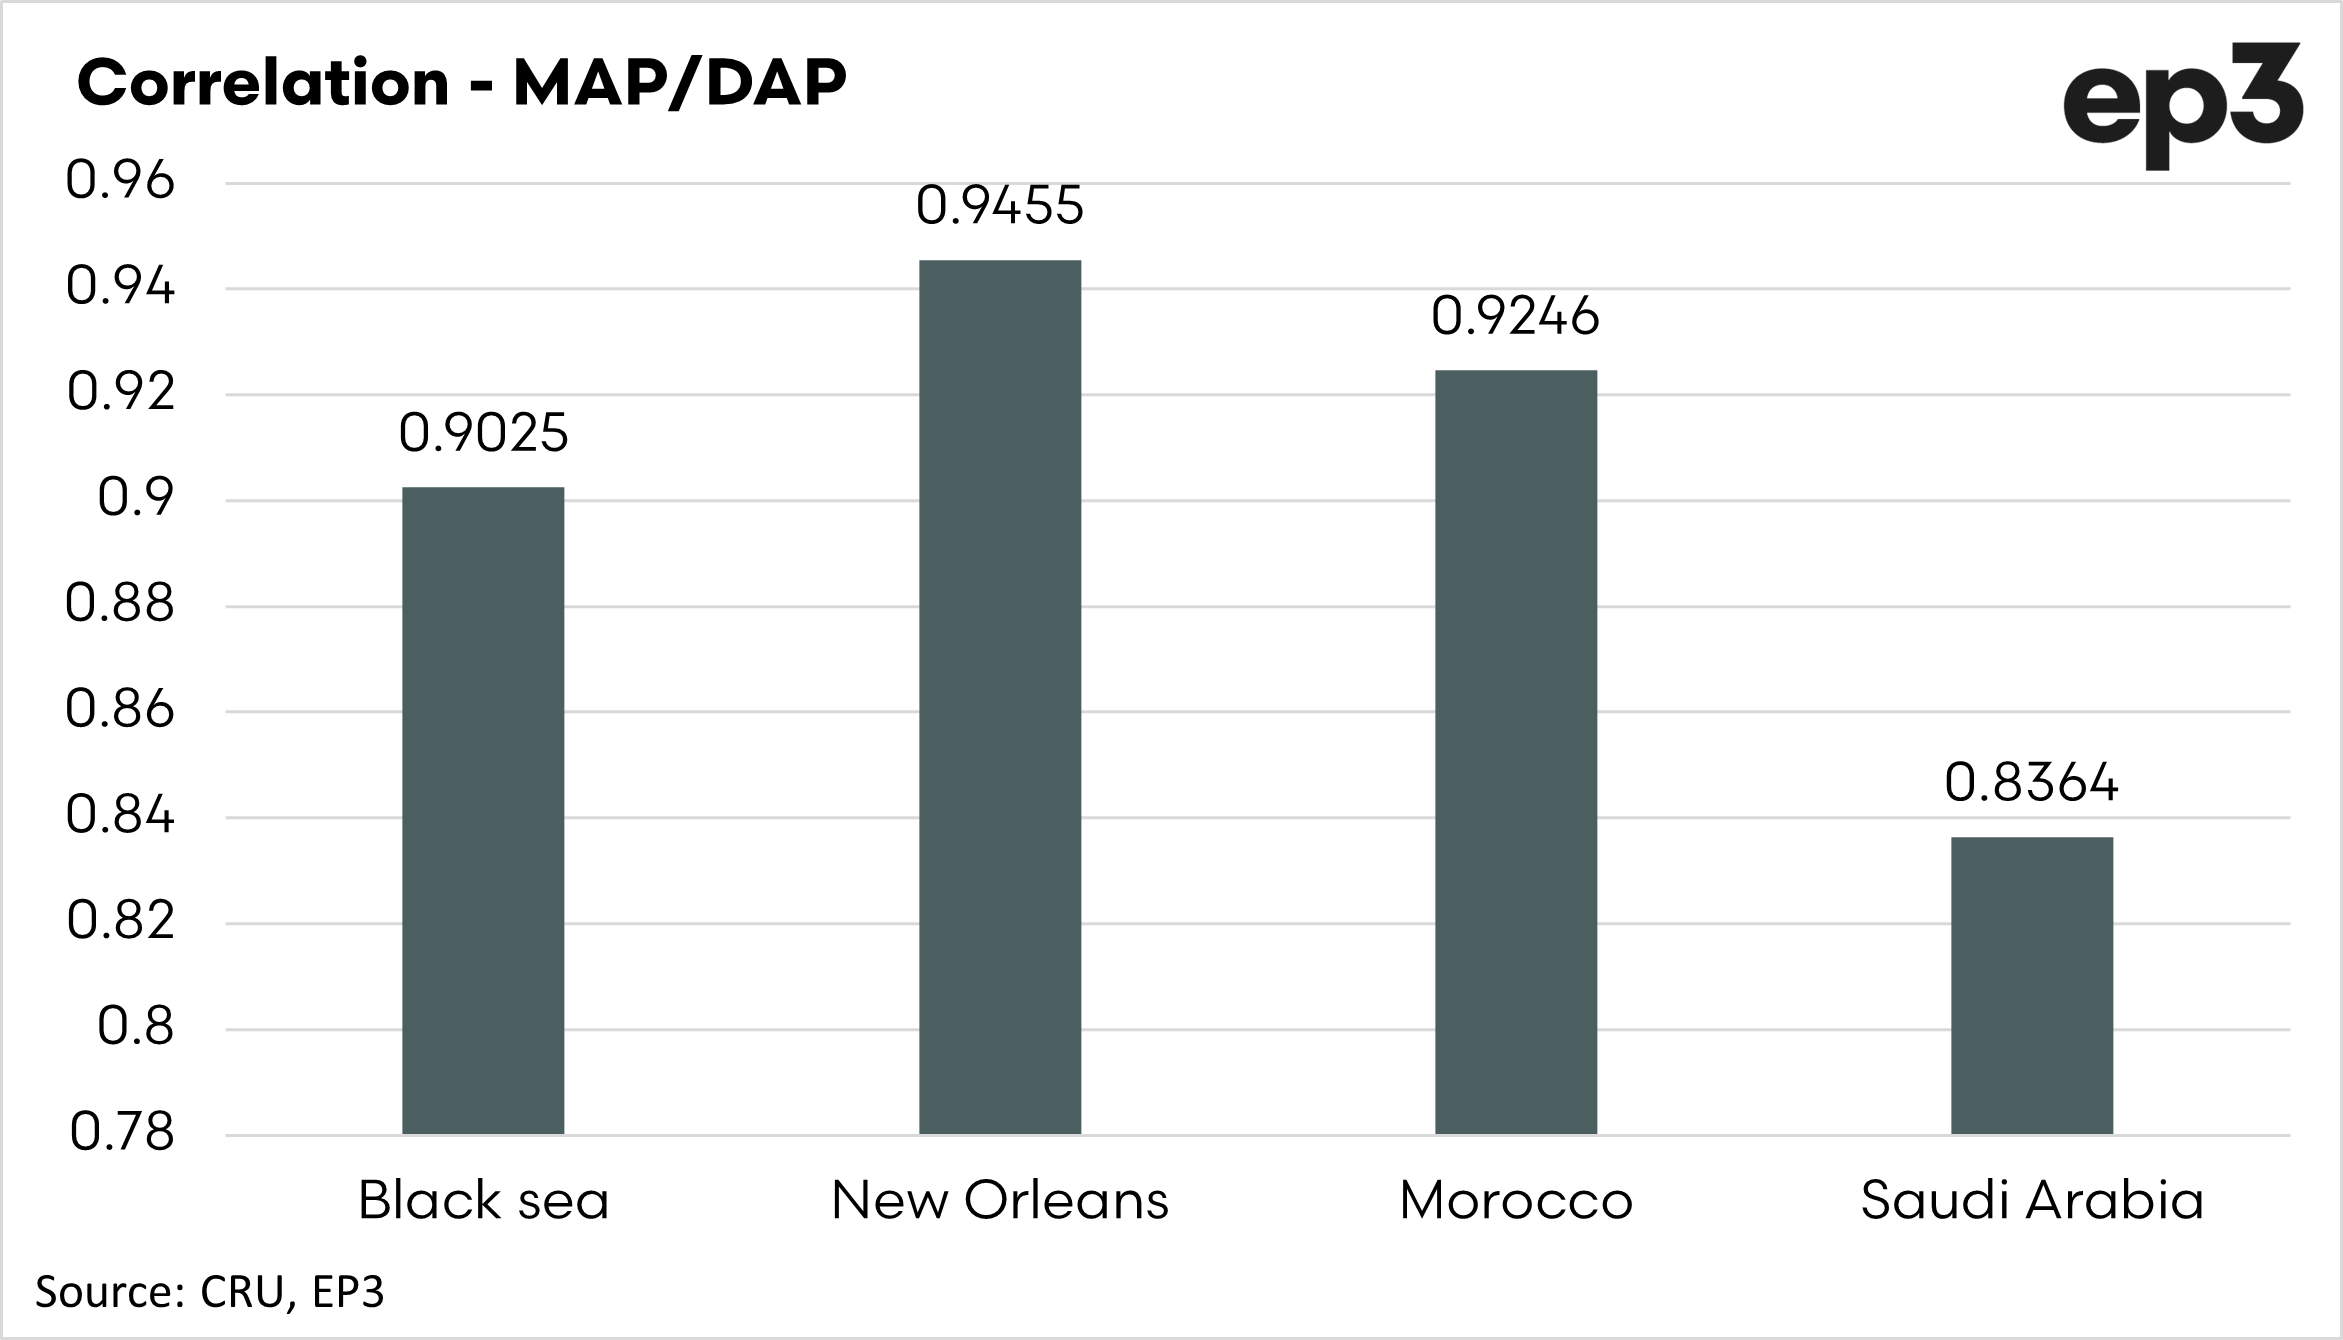
The first chart below displays the correlation between DAP and MAP in some of the world’s major origins. A result of 1 is a perfect correlation, and a result of 0 is no correlation. This correlation is of returns and not pricing, which is statistically a better measure. So these are almost perfect: when DAP moves, MAP moves with it.
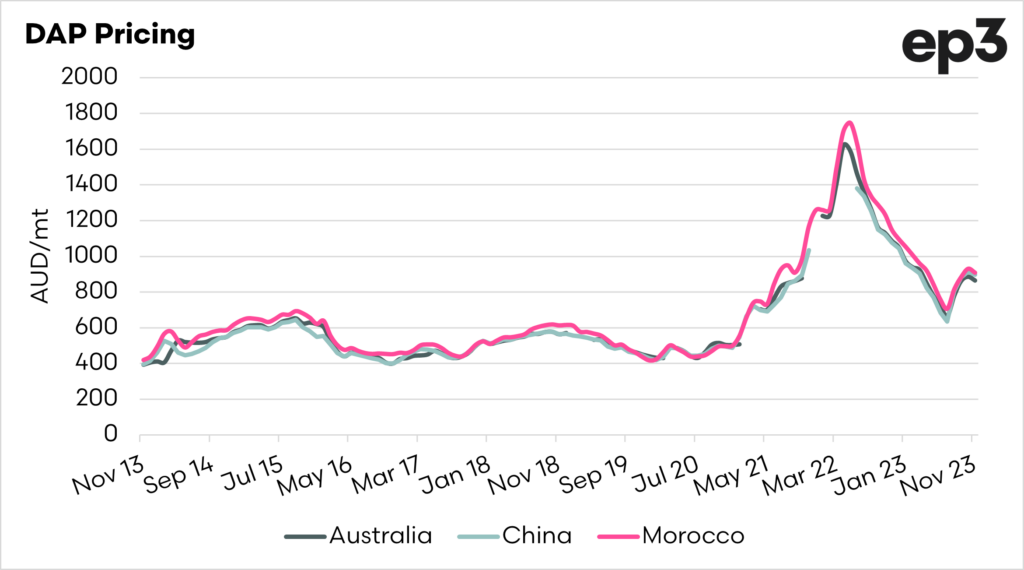
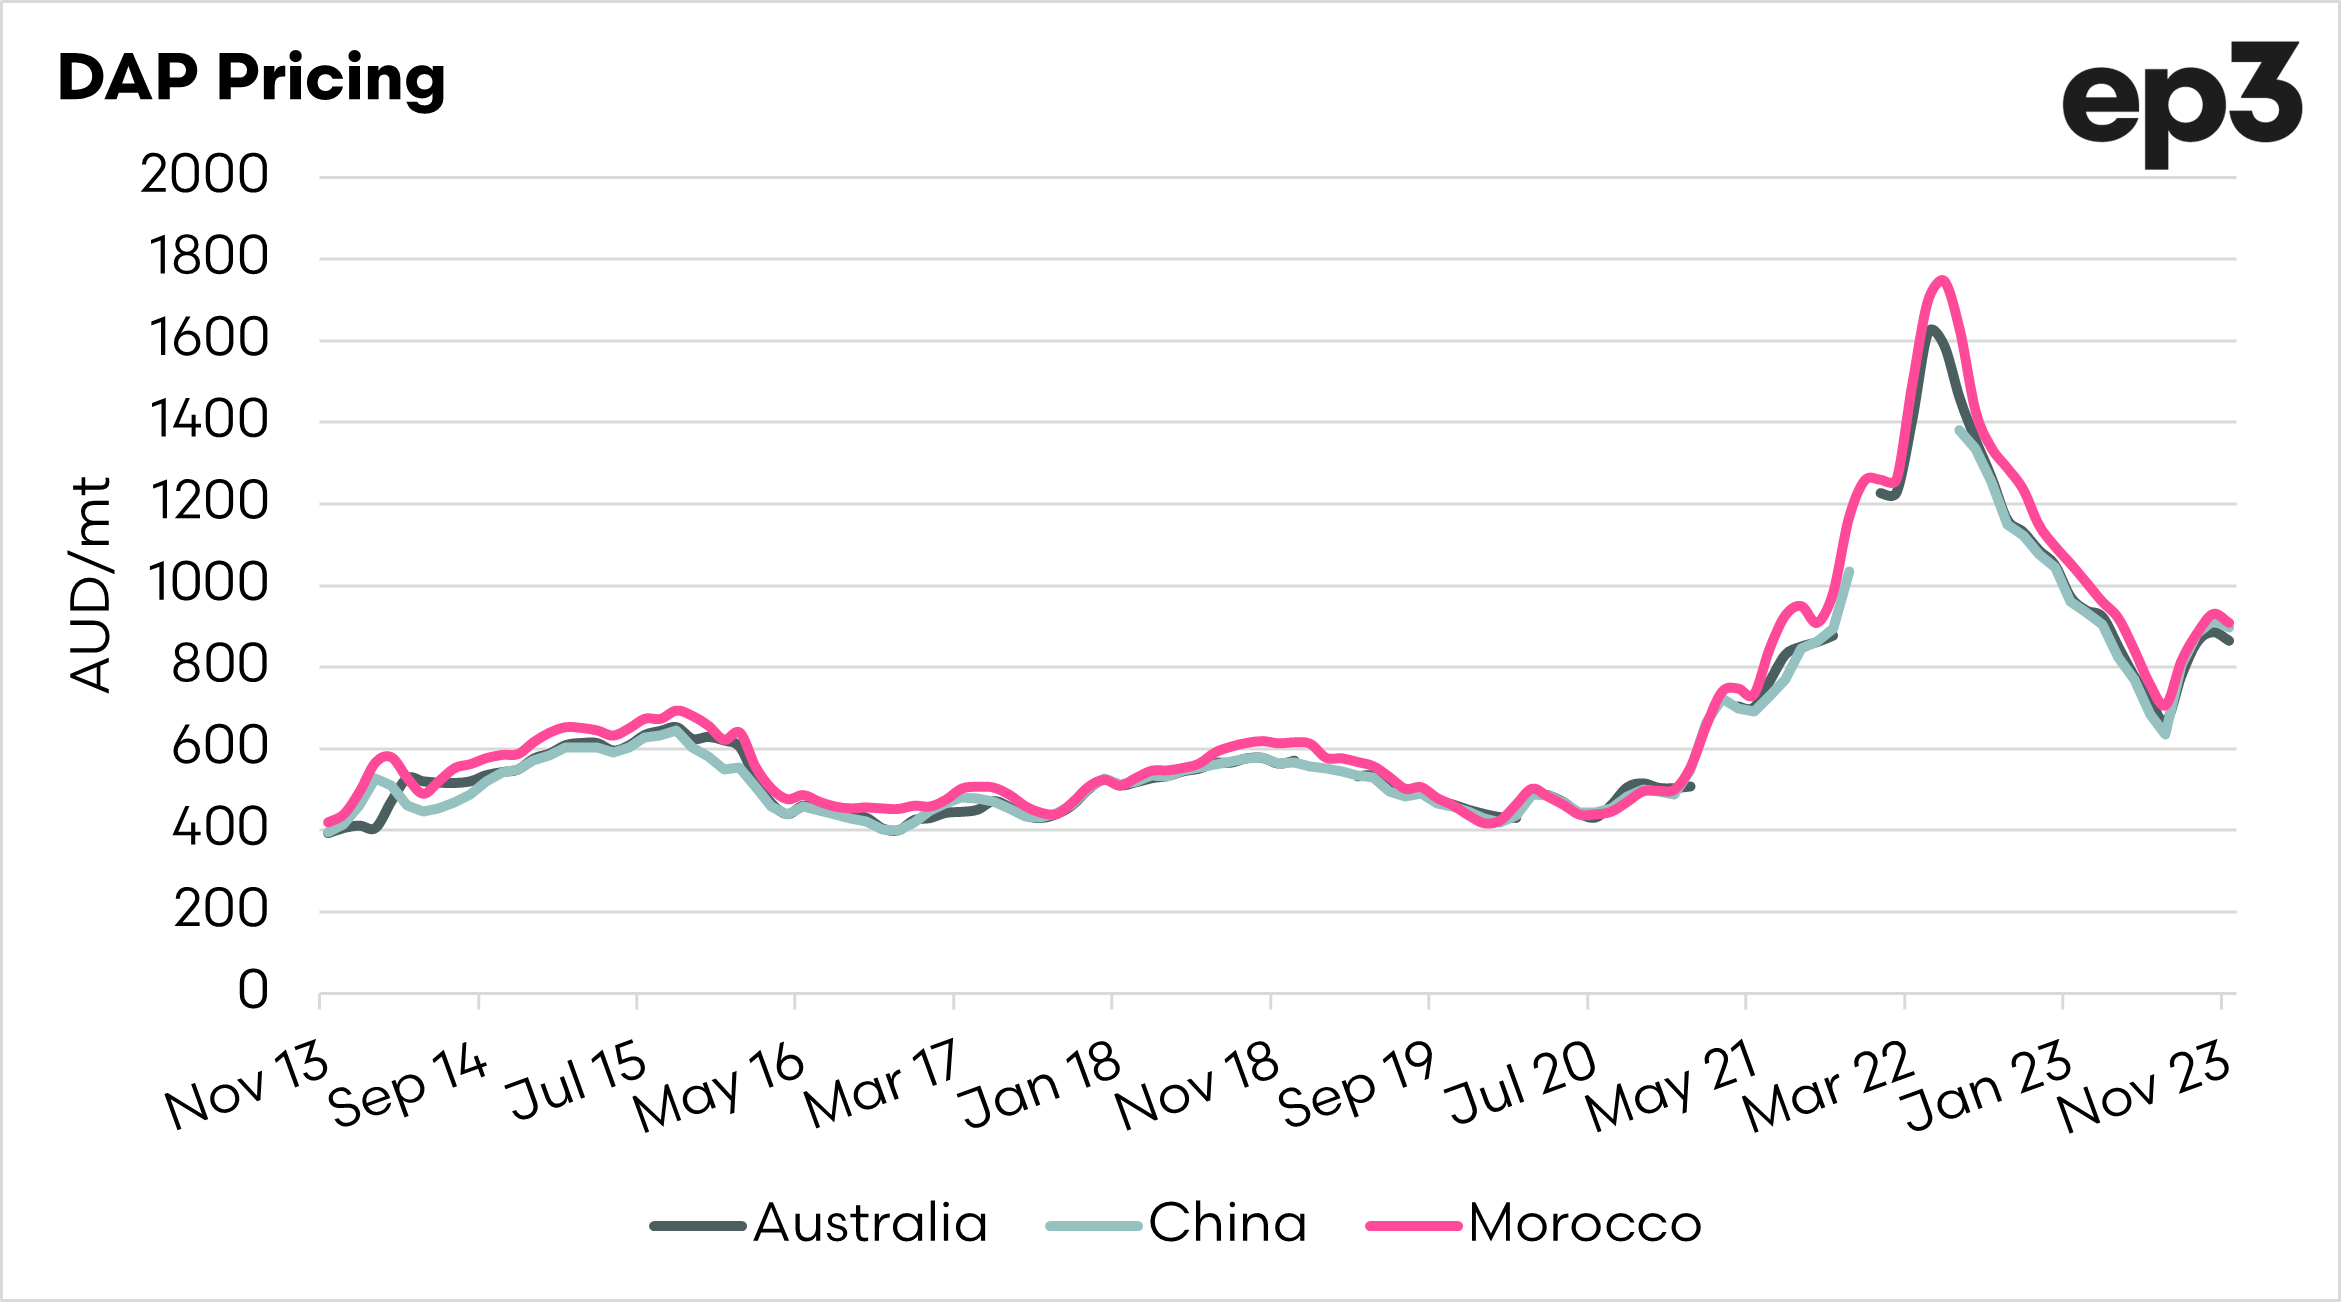
Let’s look at pricing around the world for DAP. In the second chart, the price of DAP (FOB/A$). At present, DAP in Australia is quoted at around A$850-875 for November. This is based on the price loaded onto a vessel.
The price is currently A$220/mt lower than this time last year and well below the peak in May 2022. DAP was falling and was as low as the mid-600s during July. The market has been driven by our friends in China.
China has restricted exports of phosphates, which have kept prices high as supply on the international market becomes constrained. China has introduced these restrictions to maintain prices at a lower level domestically to shore up their food production.
It is important to note that the prices shown in this article are the FOB numbers and not the prices received by farmers. The retail price will be higher; these charts are only here to give the trend of pricing.
Pricing of DAP/MAP is expected to be higher than the long-term average but lower than the recent highs of 2021 and 2022.

