New Series: Farm Costs #1 – Insurance

The cost of farming
Our regular readers will know that we do not limit our articles to farming outputs, such as grain or cattle prices, we take a whole of industry approach.
We regularly cover various topics impacting our overall profitability in agriculture, from freight to fertilizer.
I thought it would be worthwhile delving a little deeper into the costs of agriculture and looking at specific farm costs beyond the big ticket items.
These costs might not be all huge, but they add up.
The most straightforward formula for on-farm profit accounting is income multiplied by yield minus costs.
Income: The income component is the price received for the farm’s output. In cropping businesses, this is the income from sales of grain/oilseeds.
Yield: The yield is the volume of grain/oilseed produced for the given area.
Costs: The total costs of producing the crop are deducted from the crop income. These costs comprise costs that are fixed farm costs such as depreciation and management and variable costs that relate directly to growing a crop, such as chemicals, fertilizer and machinery running costs.

Farm Costs #1: Insurance
I’ve lived in Australia since 2010 and love it here. It does seem to have more than its fair share of natural disasters.
In fact, Matt and I, suffered through two serious storm events in two years (see here) at our pig farm, which caused significant damage.
These natural disasters from storm to hail to fire, mean that insurance is a very important tool for protecting against risk.
Let’s see how insurance costs have changed over time.
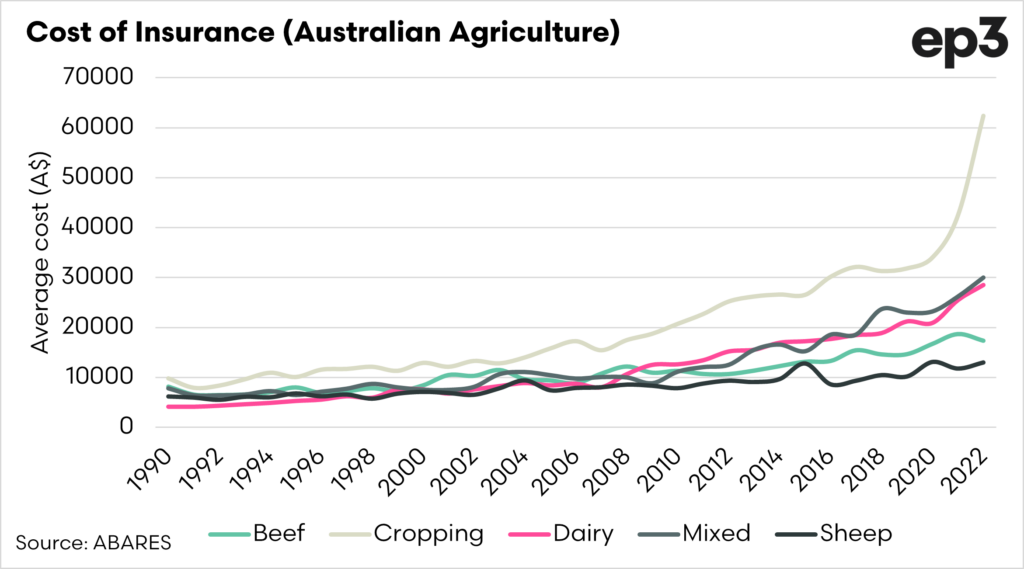

The chart above displays the average cost of insurance per farm from 1990 to the present. From 1990 to the mid-2000s, the insurance cost for each type of enterprise trended at similar levels.
Around 2005, the pace of increases for cropping separated from the rest of the agricultural sector. To delve deeper, let’s take a look at the compound annual growth rate.

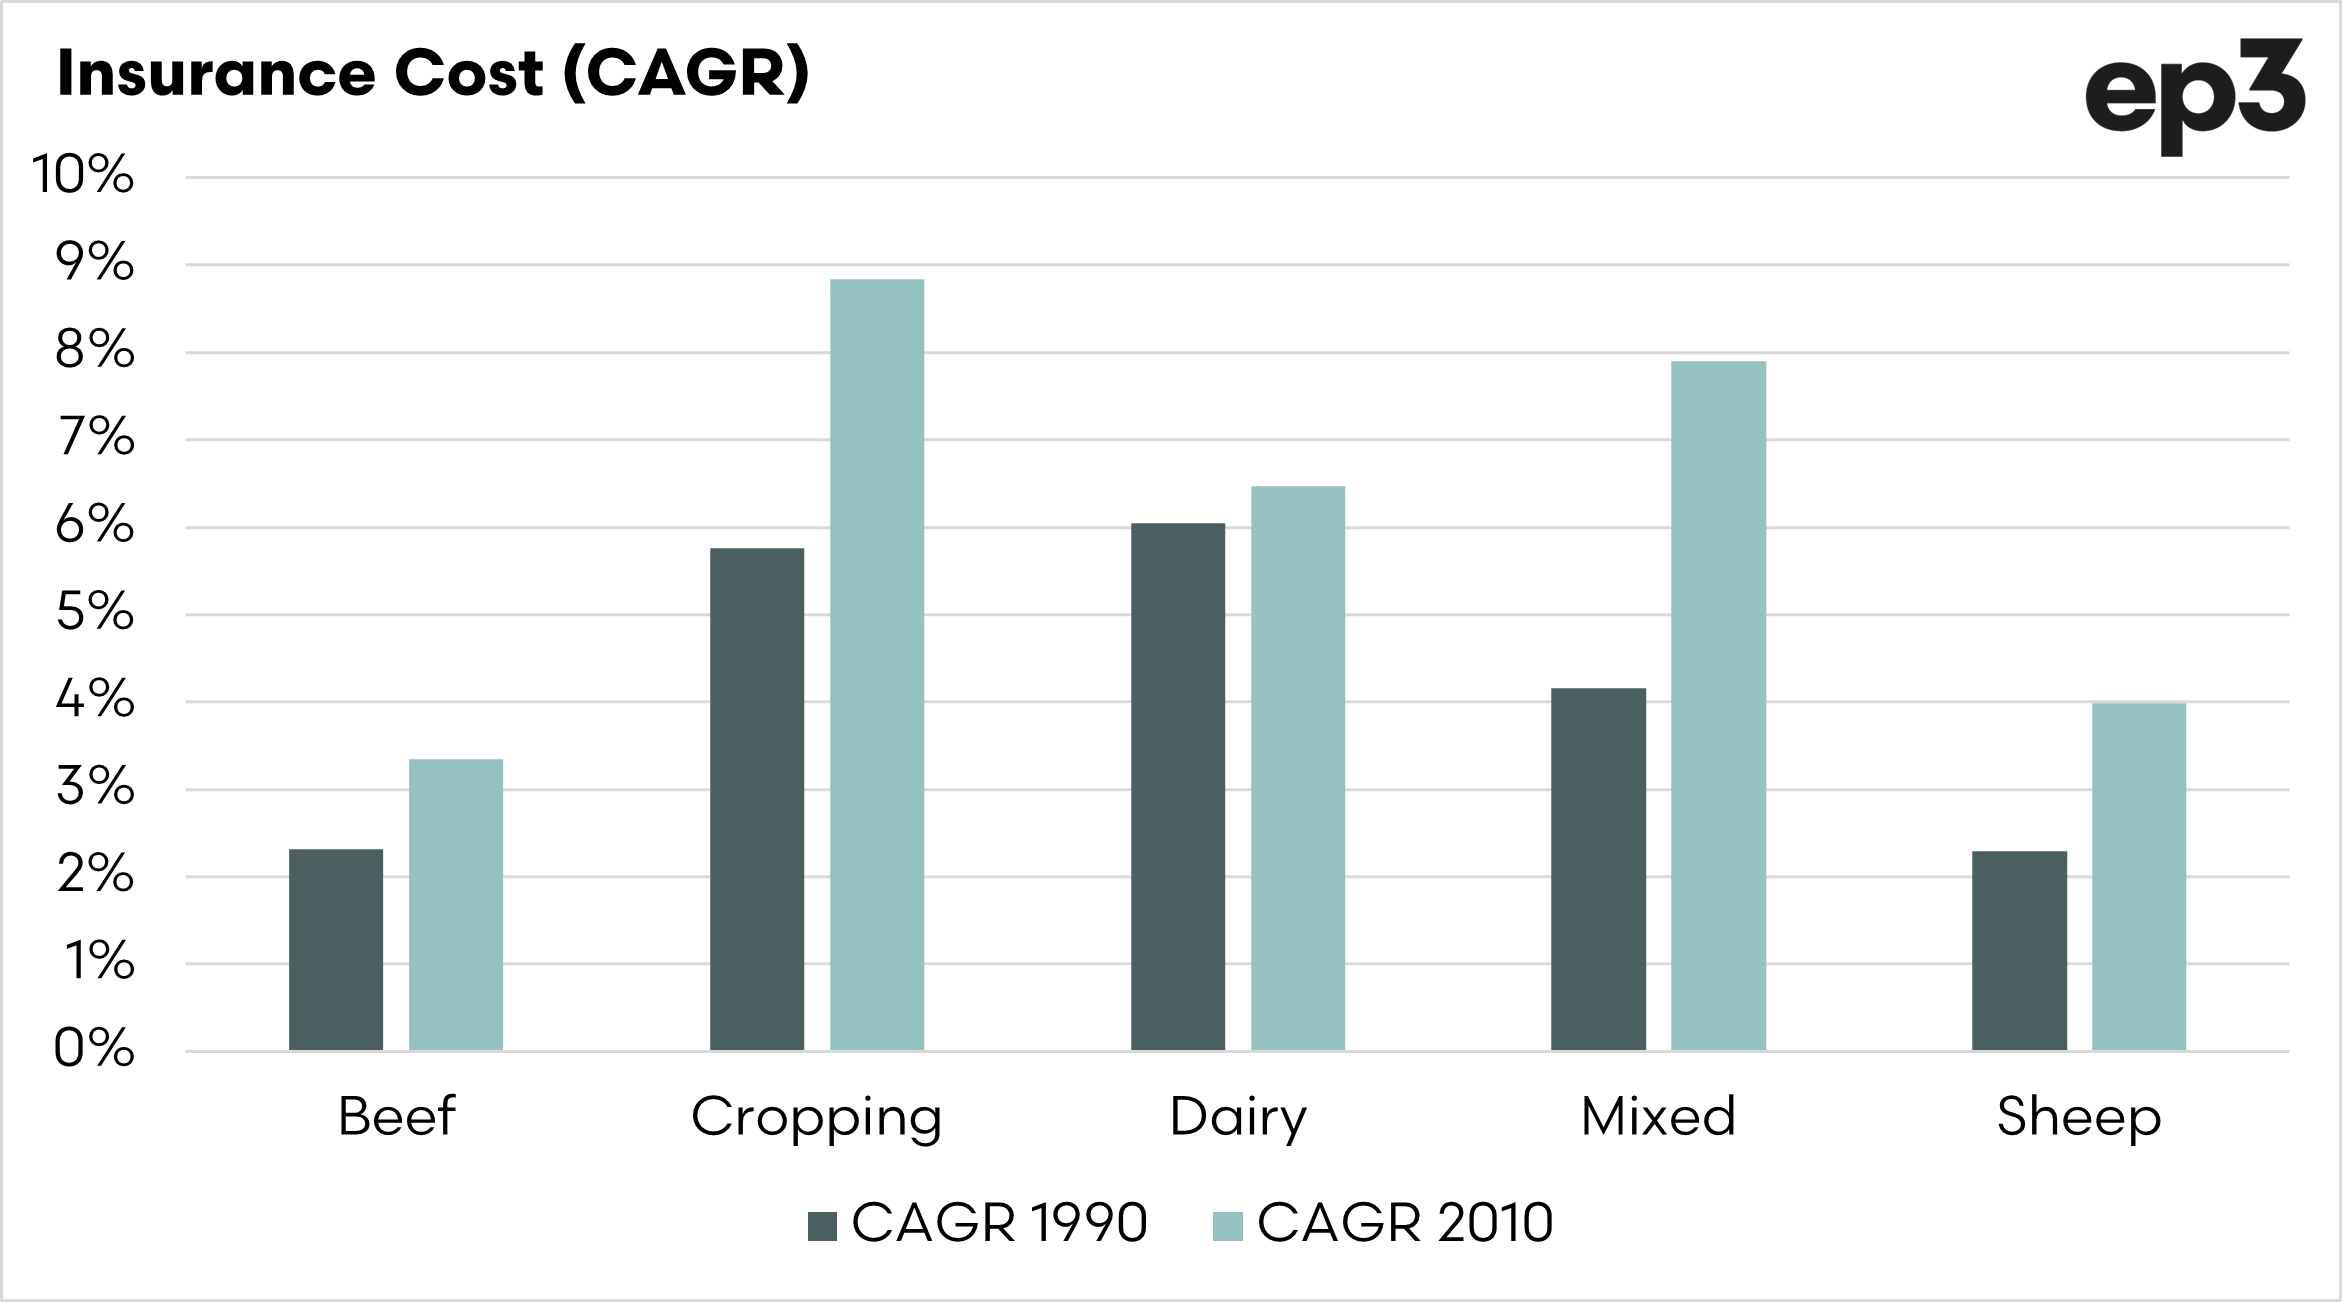
The compound annual growth rate is a good indicator to use to track the rate of growth, or return, over a period of time.
In the chart above, I have shown the compound annual growth rate from 1990 to present and from 2010 to present.
If we look at cropping, the CAGR was 6% for the full period but has increased to 9% since 2010. Large increases were also experienced in mixed and sheep farming.
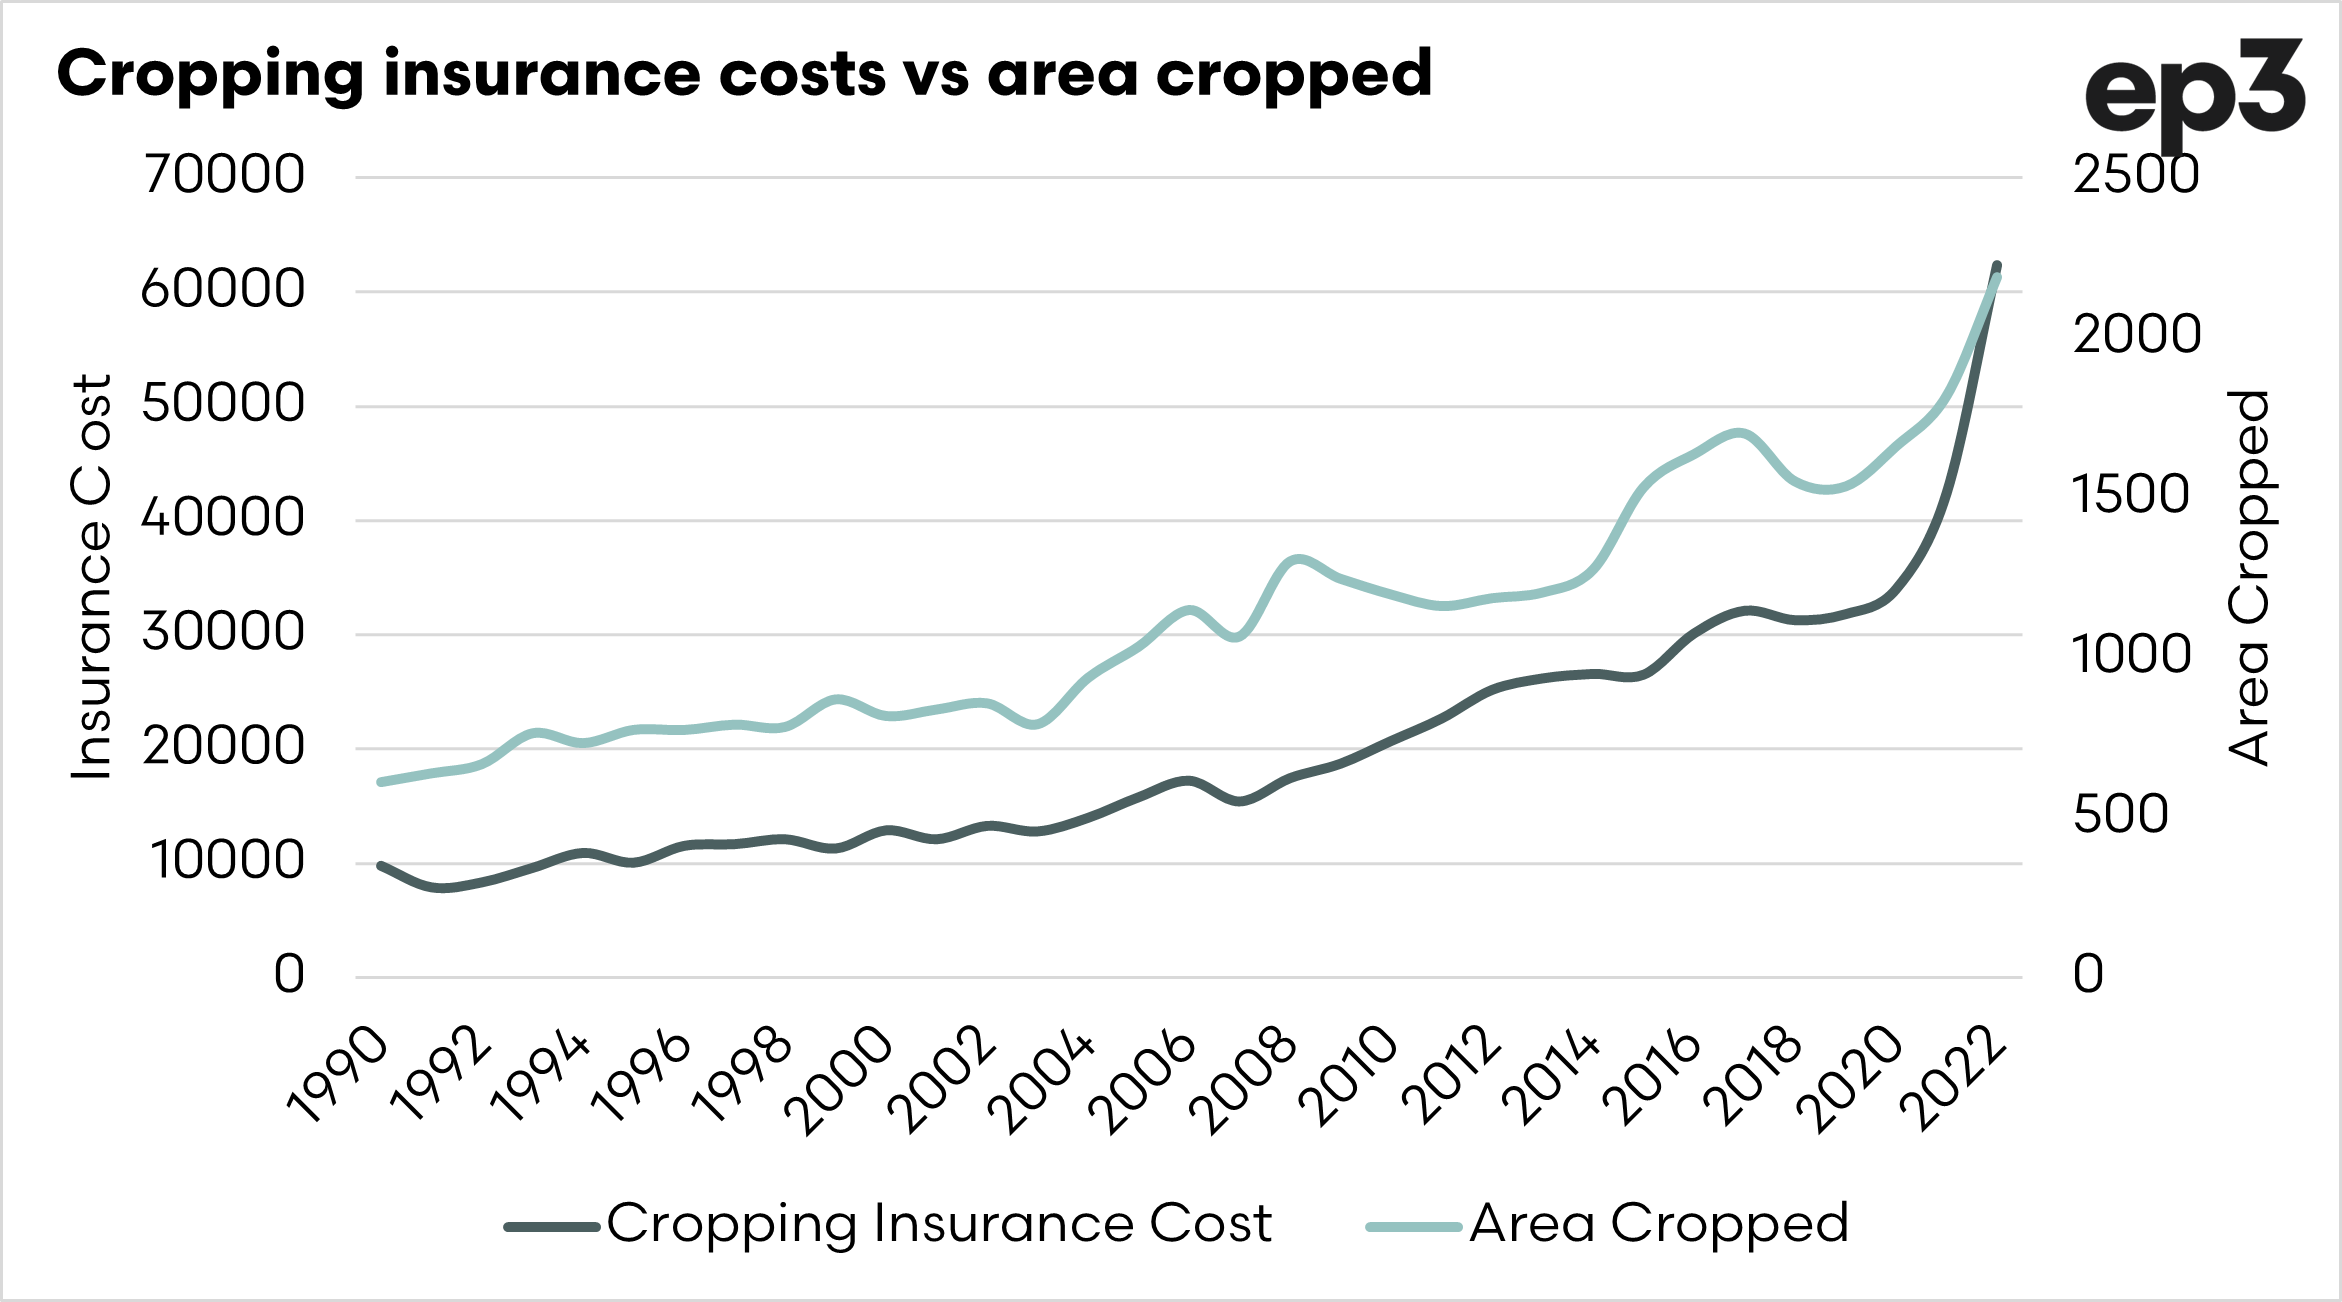
Let’s delve a little deeper into this cropping insurance. The average cost of insurance per farm has grown as the size of farms has increased. The chart below shows that as average area cropped increases, the insurance cost obviously rises.

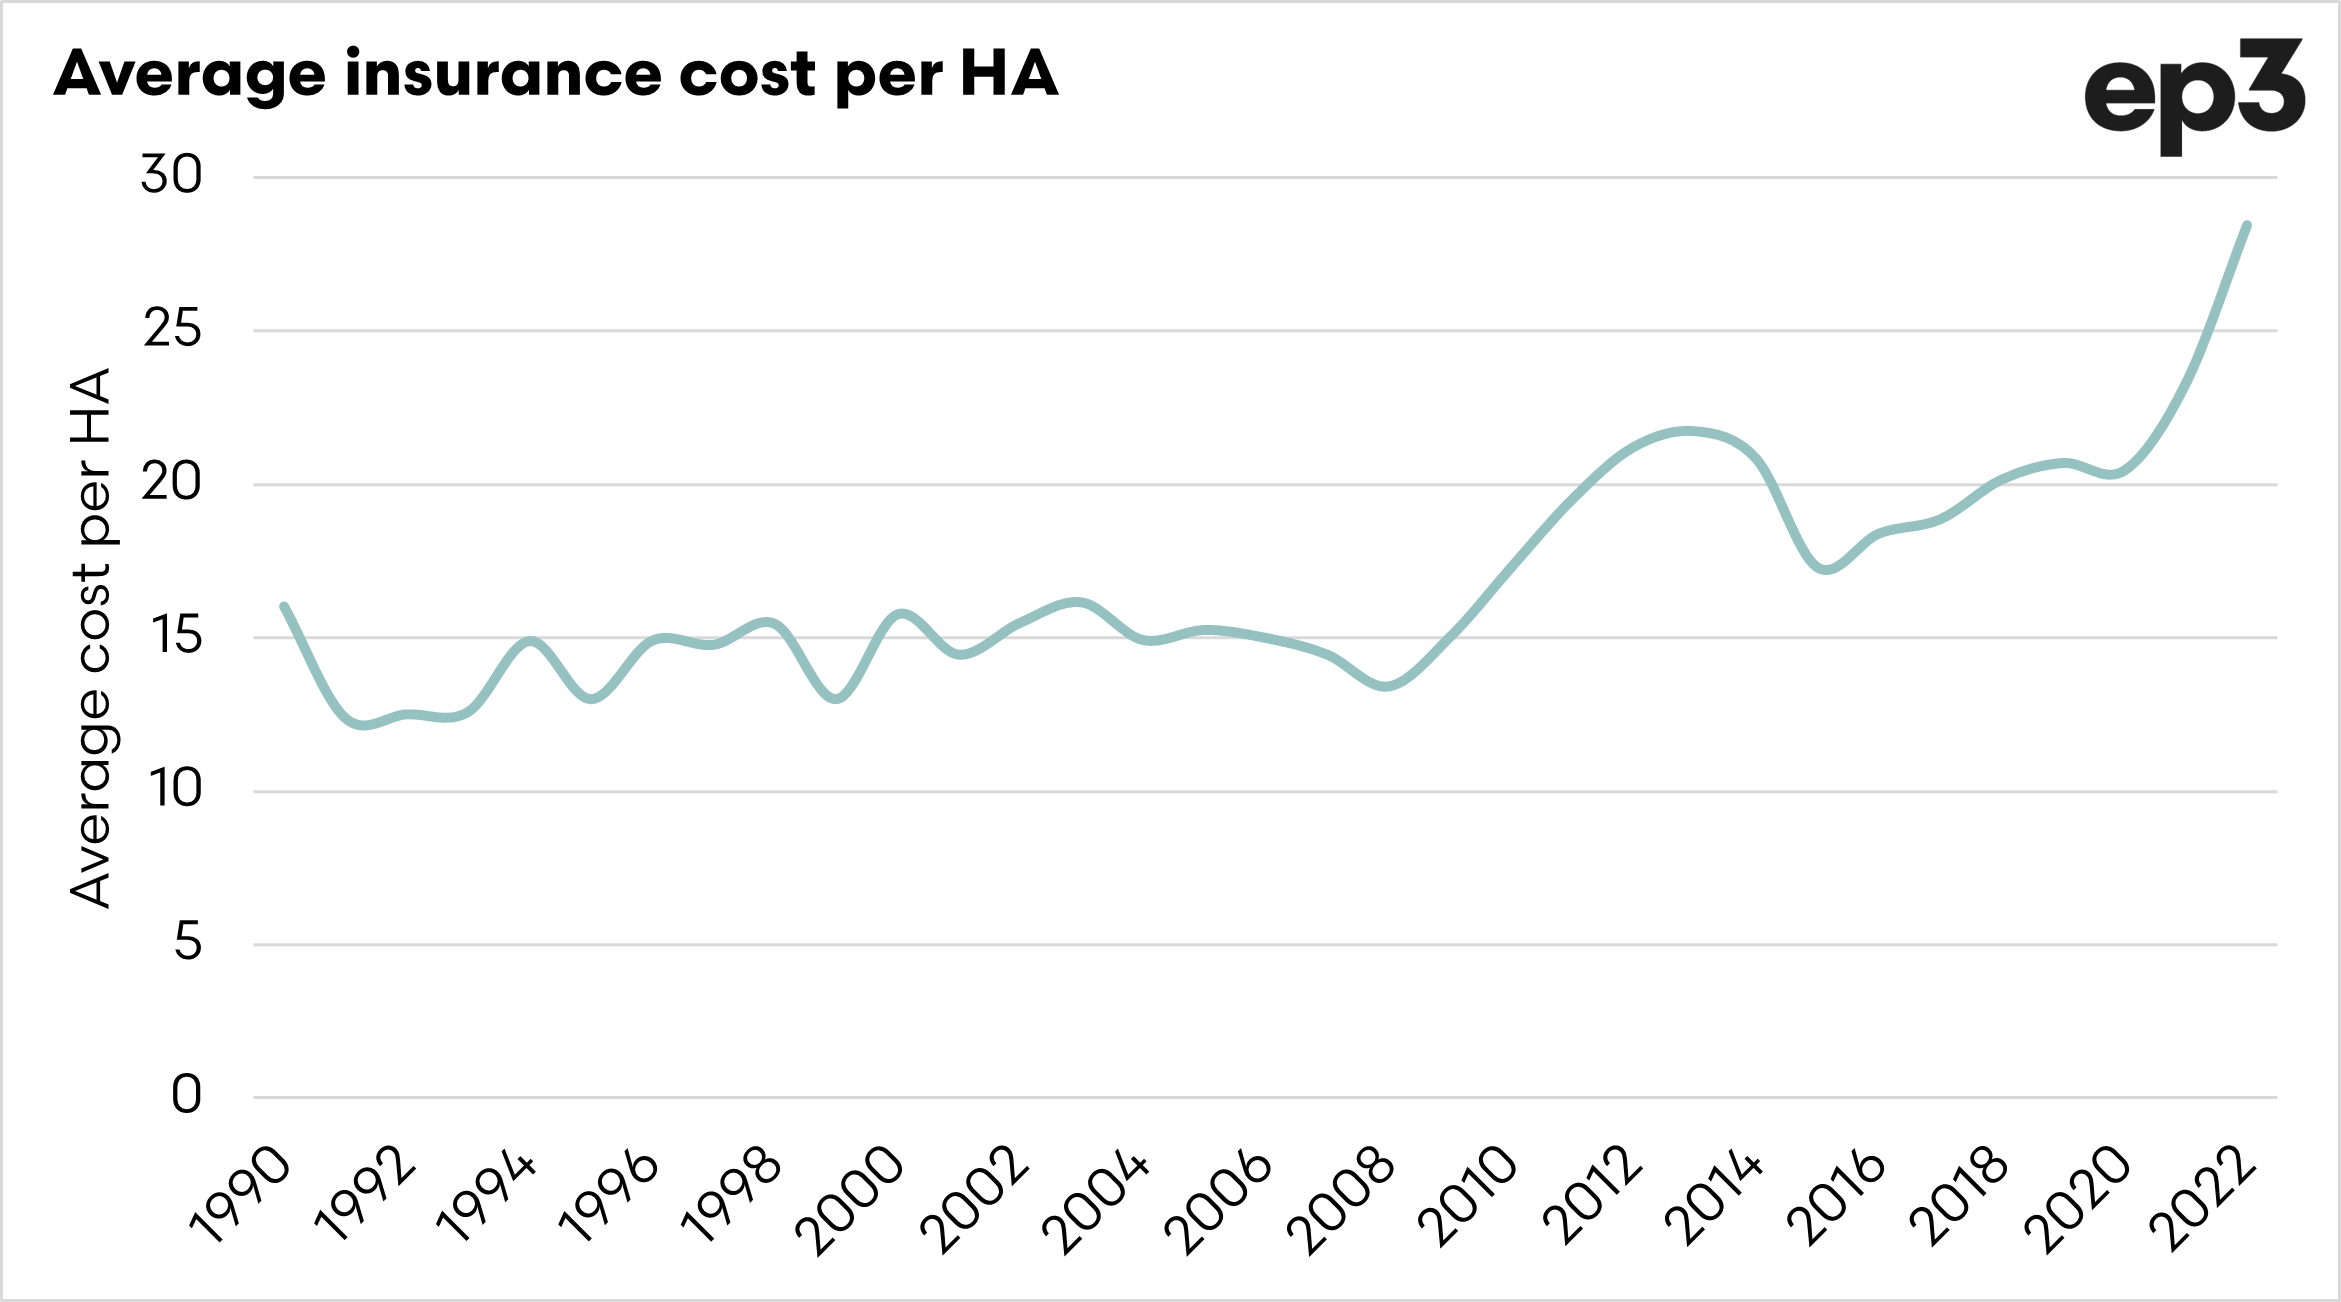
Suppose we work back to an average insurance cost per hectare. In that case, we can see that the cost per hectare to insure cropping has increased substantially.
From 2020 to 2022, the cost of insuring cropping per hectare increased by 40%. As we hear from many of our subscribers, insurance rates have increased, and they will vary around the country.
Calculating an insurance premium is based on the risk that the insurer holds. If there are more claims in a region, then the costs increase – on top of this, with higher machinery costs and higher grain pricing, the claims become expensive.
It is important to note that the data used in this article is averages across the nation. Still, it is intended to indicate the trend of insurance costs.