New Series: Farm Costs #2 – Energy
The cost of farming
Our regular readers will know that we do not limit our articles to farming outputs, such as grain or cattle prices, we take a whole of industry approach.
We regularly cover various topics impacting our overall profitability in agriculture, from freight to fertilizer.
I thought it would be worthwhile delving a little deeper into the costs of agriculture and looking at specific farm costs beyond the big ticket items.
These costs might not be all huge, but they add up.
The most straightforward formula for on-farm profit accounting is income multiplied by yield minus costs.
Income: The income component is the price received for the farm’s output. In cropping businesses, this is the income from sales of grain/oilseeds.
Yield: The yield is the volume of grain/oilseed produced for the given area.
Costs: The total costs of producing the crop are deducted from the crop income. These costs comprise costs that are fixed farm costs such as depreciation and management and variable costs that relate directly to growing a crop, such as chemicals, fertilizer and machinery running costs.

Farm Costs #2: Energy
In my view, agriculture is the conversion of energy to food. If we had limitless free energy, then we would be able to create vast amounts of food. The reality though is that energy is a huge cost, and it is in a different form depending upon the industry. So in this update, I wanted to look at the costs of energy in Australian agriculture.
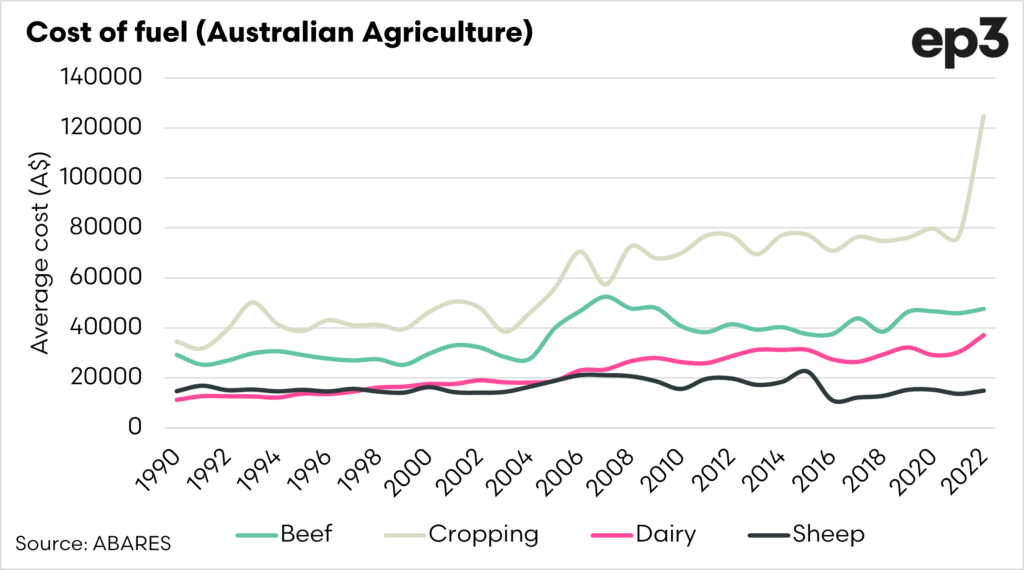
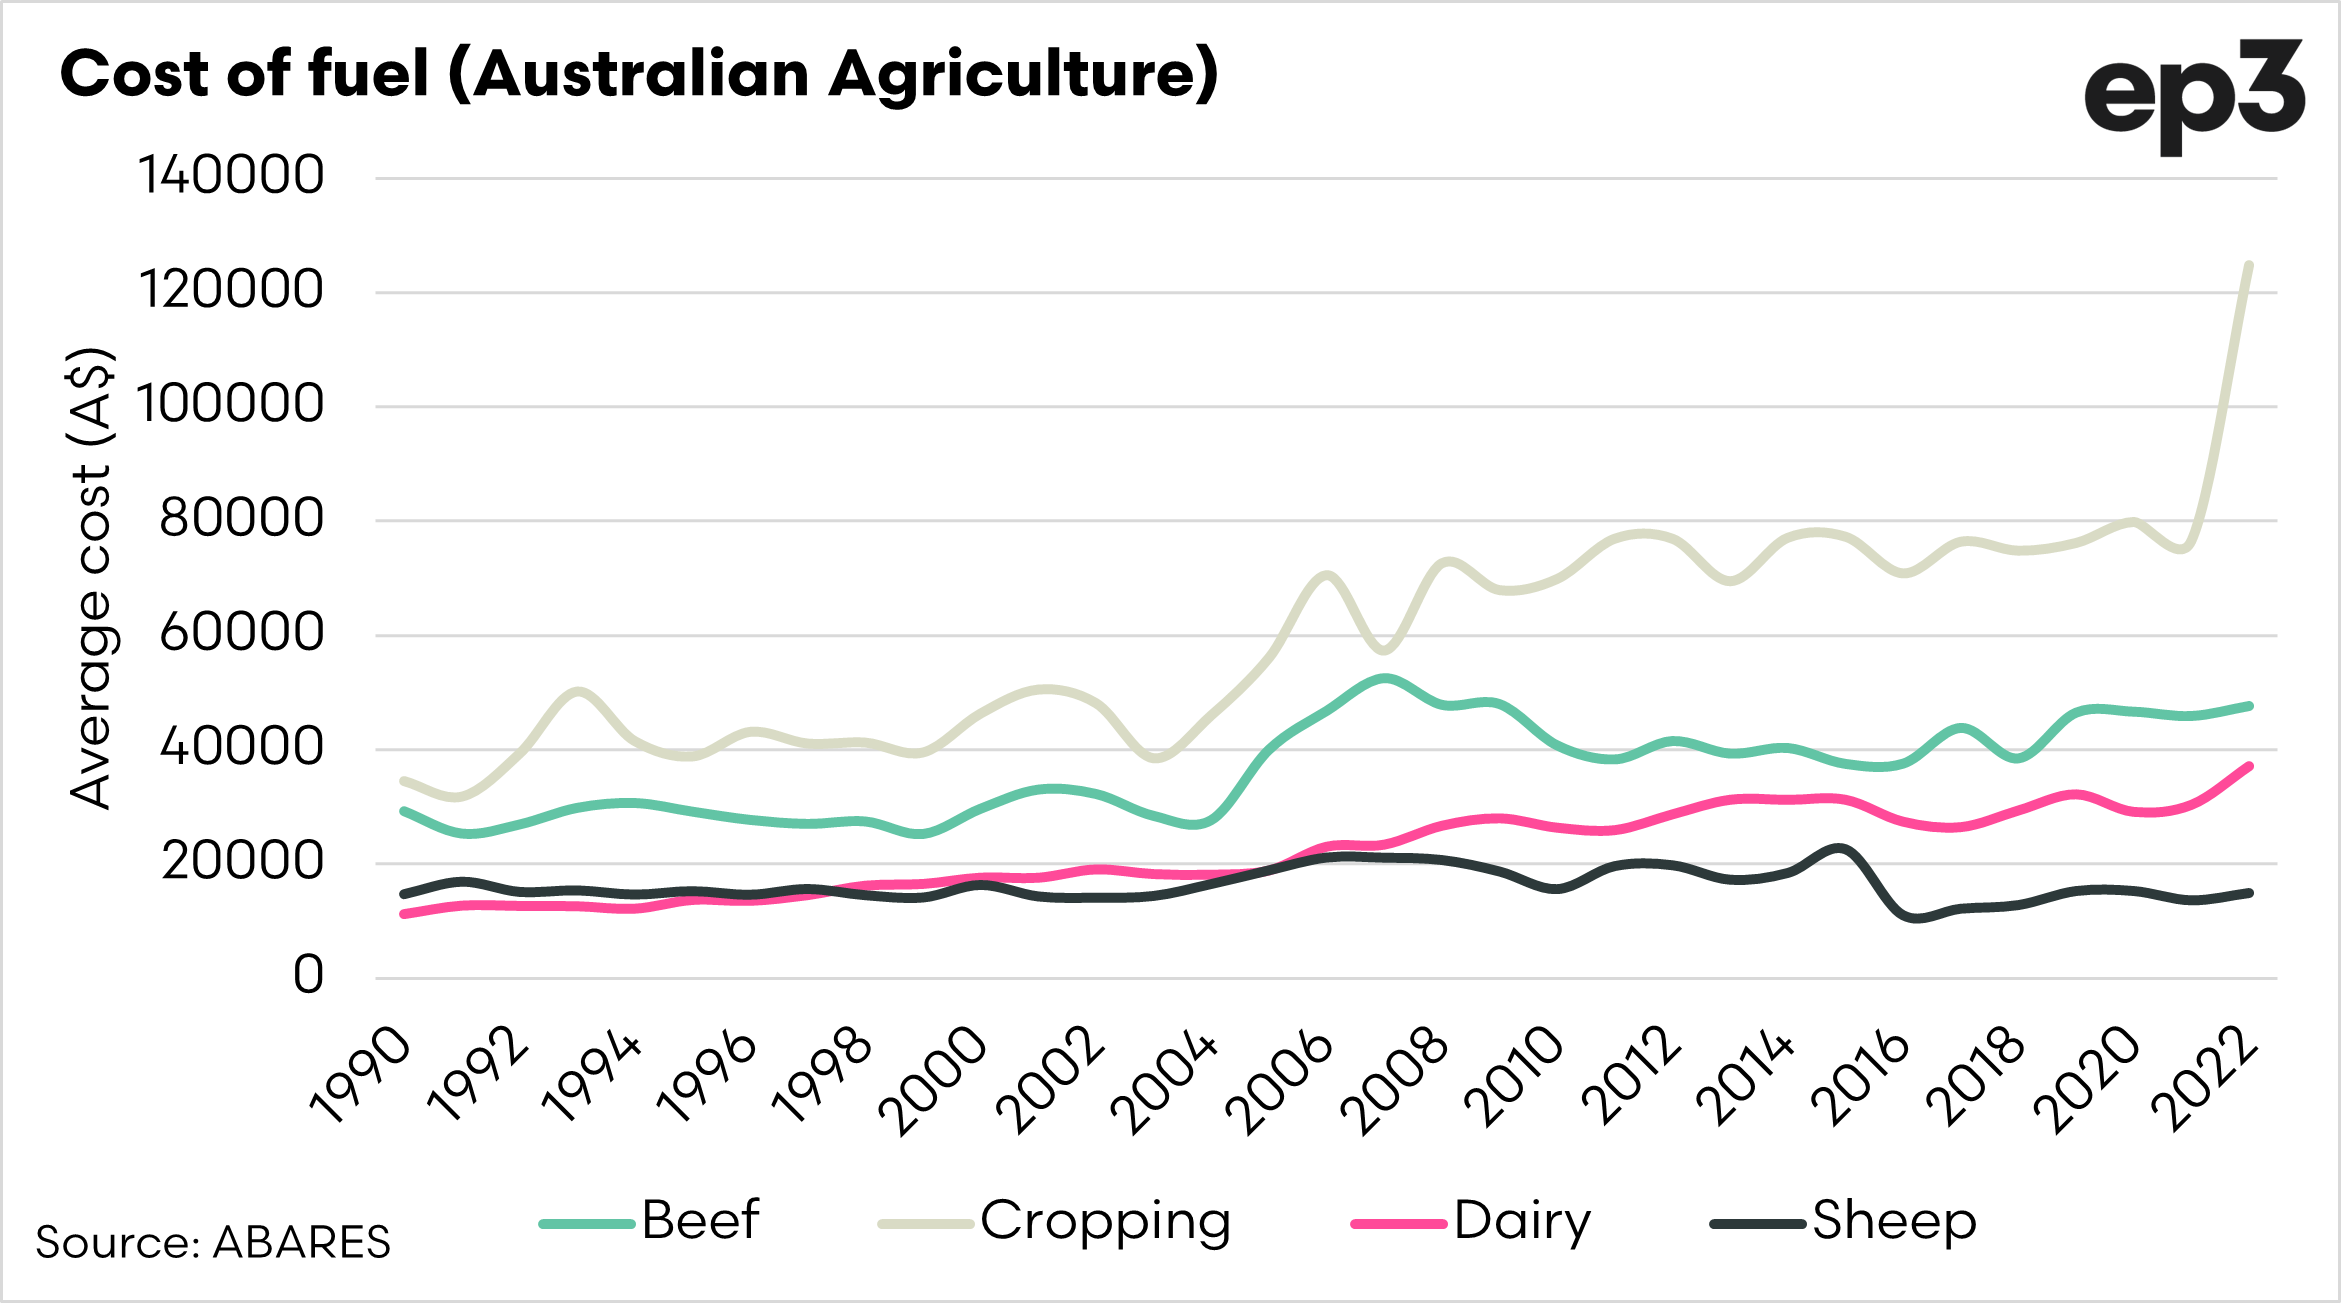
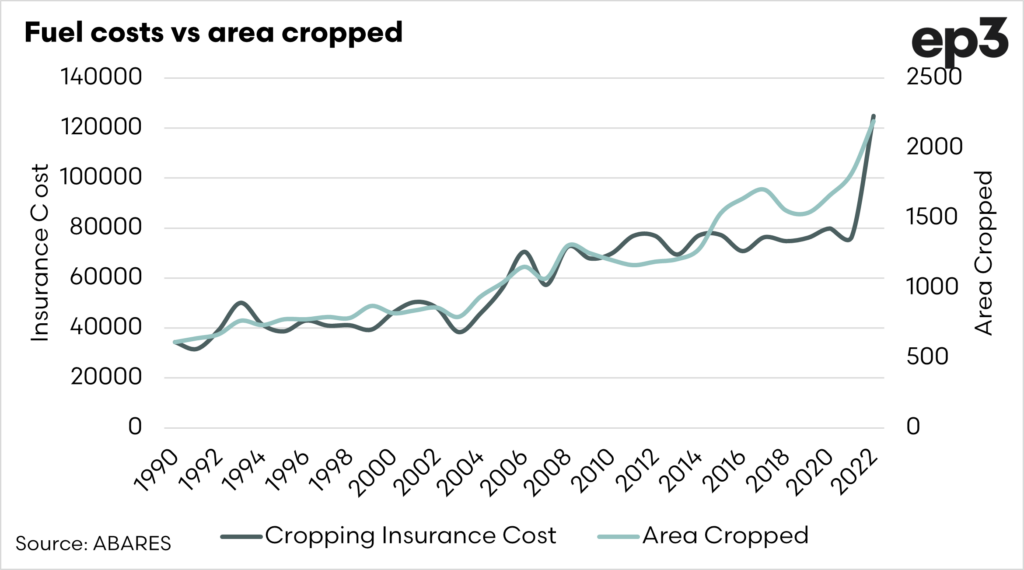
The chart above displays the costs of fuel (and grease) for the beef, cropping, dairy and sheep industries. It’s not a huge surprise to see that croppers are paying the largest amount in fuel, as they are the ones planting and harvesting huge acreages.
The other industries haven’t seen anywhere near the same level of increase in fuel spend. If we delve in a little closer (chart below), we can see that the reason for the increase in fuel spend (other than increased costs) are that the average area planted is increasing, therefore they are spending more.

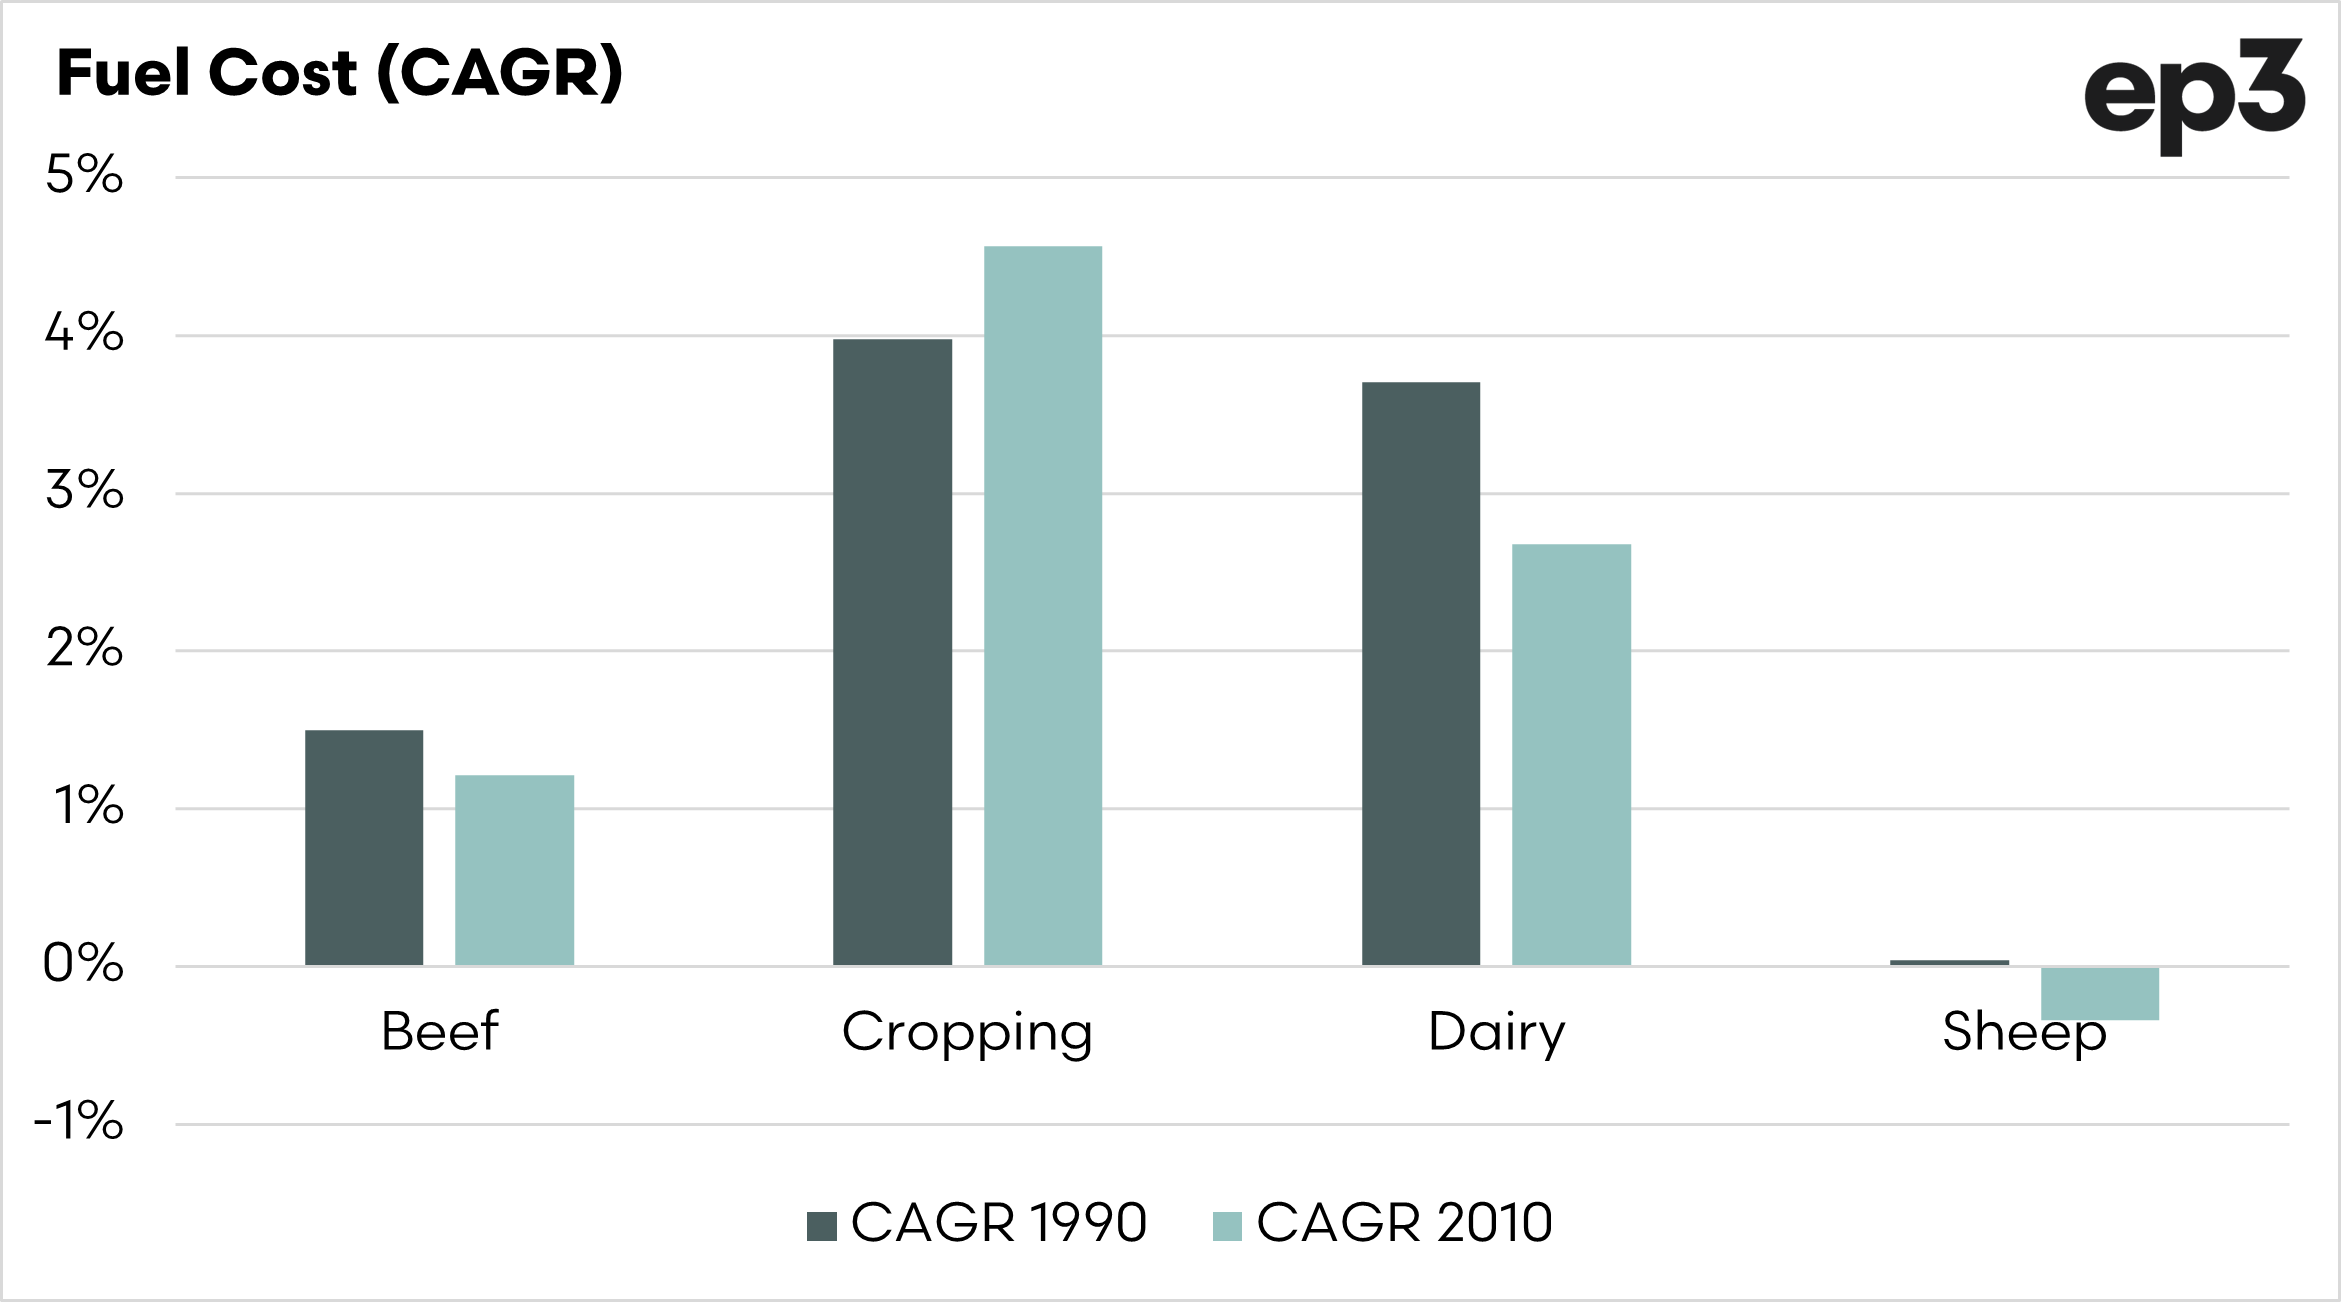
The compound annual growth rate is a good indicator to use to track the rate of growth, or return, over a period of time.
In the chart below, I have shown the compound annual growth rate from 1990 to present and from 2010 to present.
If we look at cropping, the CAGR was 4% for the full period but has increased to 5% since 2010. Large increases were also experienced in dairy.

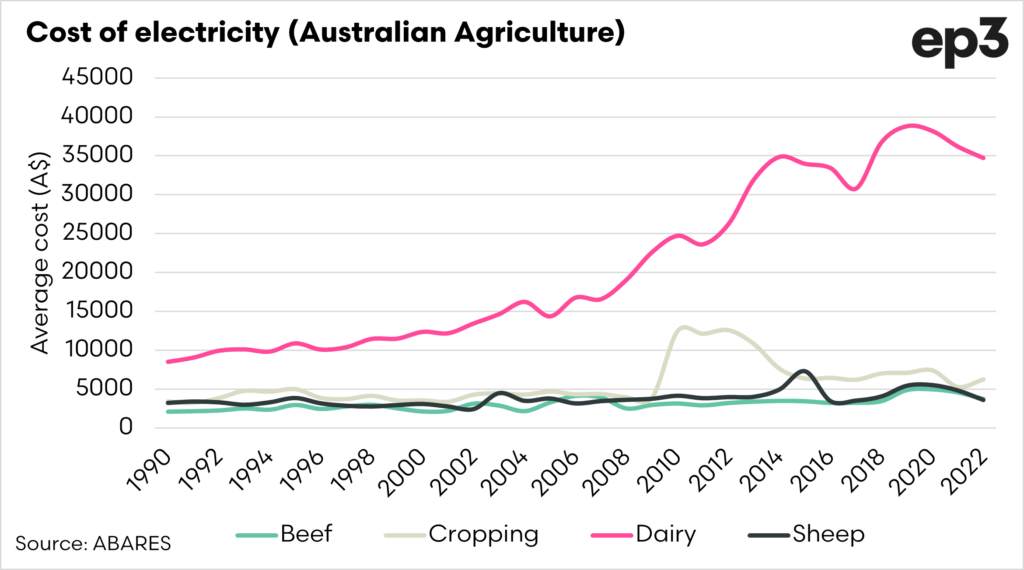
Dairy farmers are also getting hit with much higher electricity spending. The chart below shows the electricity spending for each industry. Dairy is a lot more stationary, with milking parlors that require a huge deal of electricity to run.
The cost of electricity in Australia (and around the world) is likely to increase as the transition to renewables increases, and this is something the dairy industry will have to take into account.