
Judging our urea price in Australia.
The Snapshot
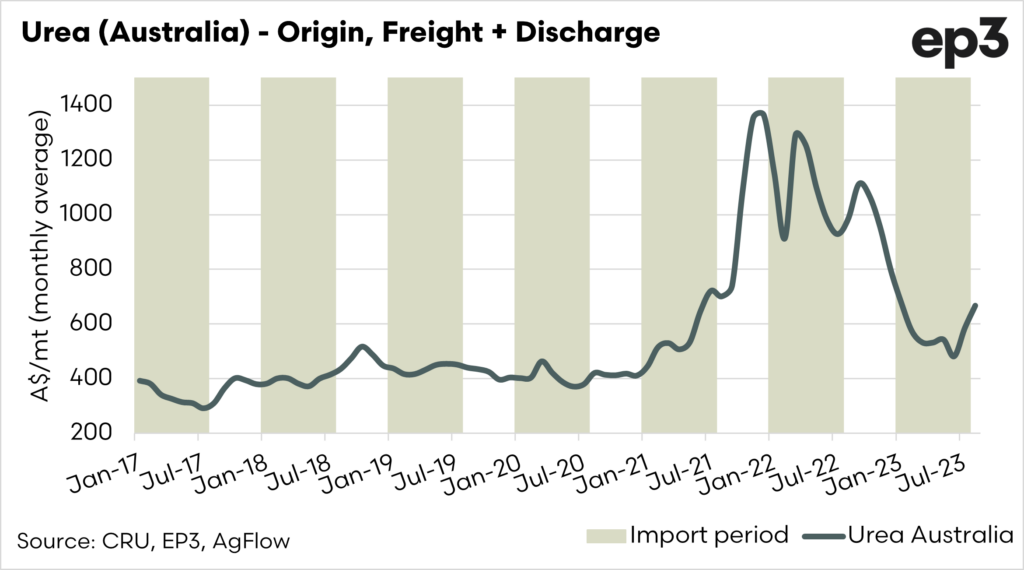
- We import the majority of urea from the Middle East.
- As there is an absence of fertilizer price transparency, we have produced a pricing model for the past six years.
- The current price for August is around A$670
- We have compared our pricing model to the actual imported urea price; this has a correlation of 0.91
- There is a lagged effect in that there is a timeframe between the spot price and when it is imported into Australia.
- This lagged effect is approximately three periods; when this is taken into account, the correlation rises to 0.98
- In the absence of transparent and publicly quoted pricing, our model provides a good insight into the cost of urea landed in Australia.
The Detail
Fertilizer prices are not transparent; unlike other agricultural commodities in Australia, it is difficult to get a handle on the price being offered. We have had fertilizer executives complain about our reporting of fertilizer pricing, but we feel that providing this information is valuable to ensuring that farmers in Australia are not suffering from an asymmetry of information.
So, let’s look a little closer at the price of urea in Australia.
We have produced a fair-value model for Australian urea. This model is the price of fertilizer landed in Australia, which we update each week.
This gives us a rudimentary value of how much urea costs the importer to get into the country at any given time. It is important to note that this does not include the cost of onward logistics, administration or margins.
It is merely there to indicate the cost of fertilizer in Australia and to view any trends. The current value for August is around A$670, up considerably from A$580 in July.

Is it accurate?
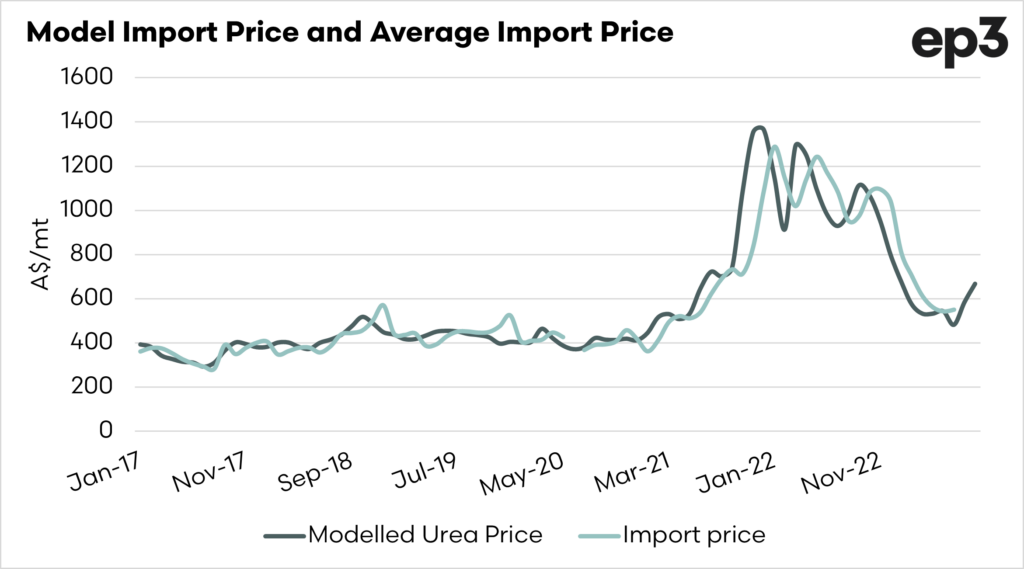
As an analyst, we constantly look at what we do and examine our numbers. The chart below shows the modelled urea price. I have also added in the actual import average price for urea.
This import average price is the value of all imports divided by the volume. This gives us a rudimentary value of imports into Australia on a national scale. The average import price in June was A$550/mt
The correlation between the two is 0.91. A perfect correlation would be 1, and zero correlation would be 0. A correlation of 0.91 would be considered extremely strong. Can we go further?

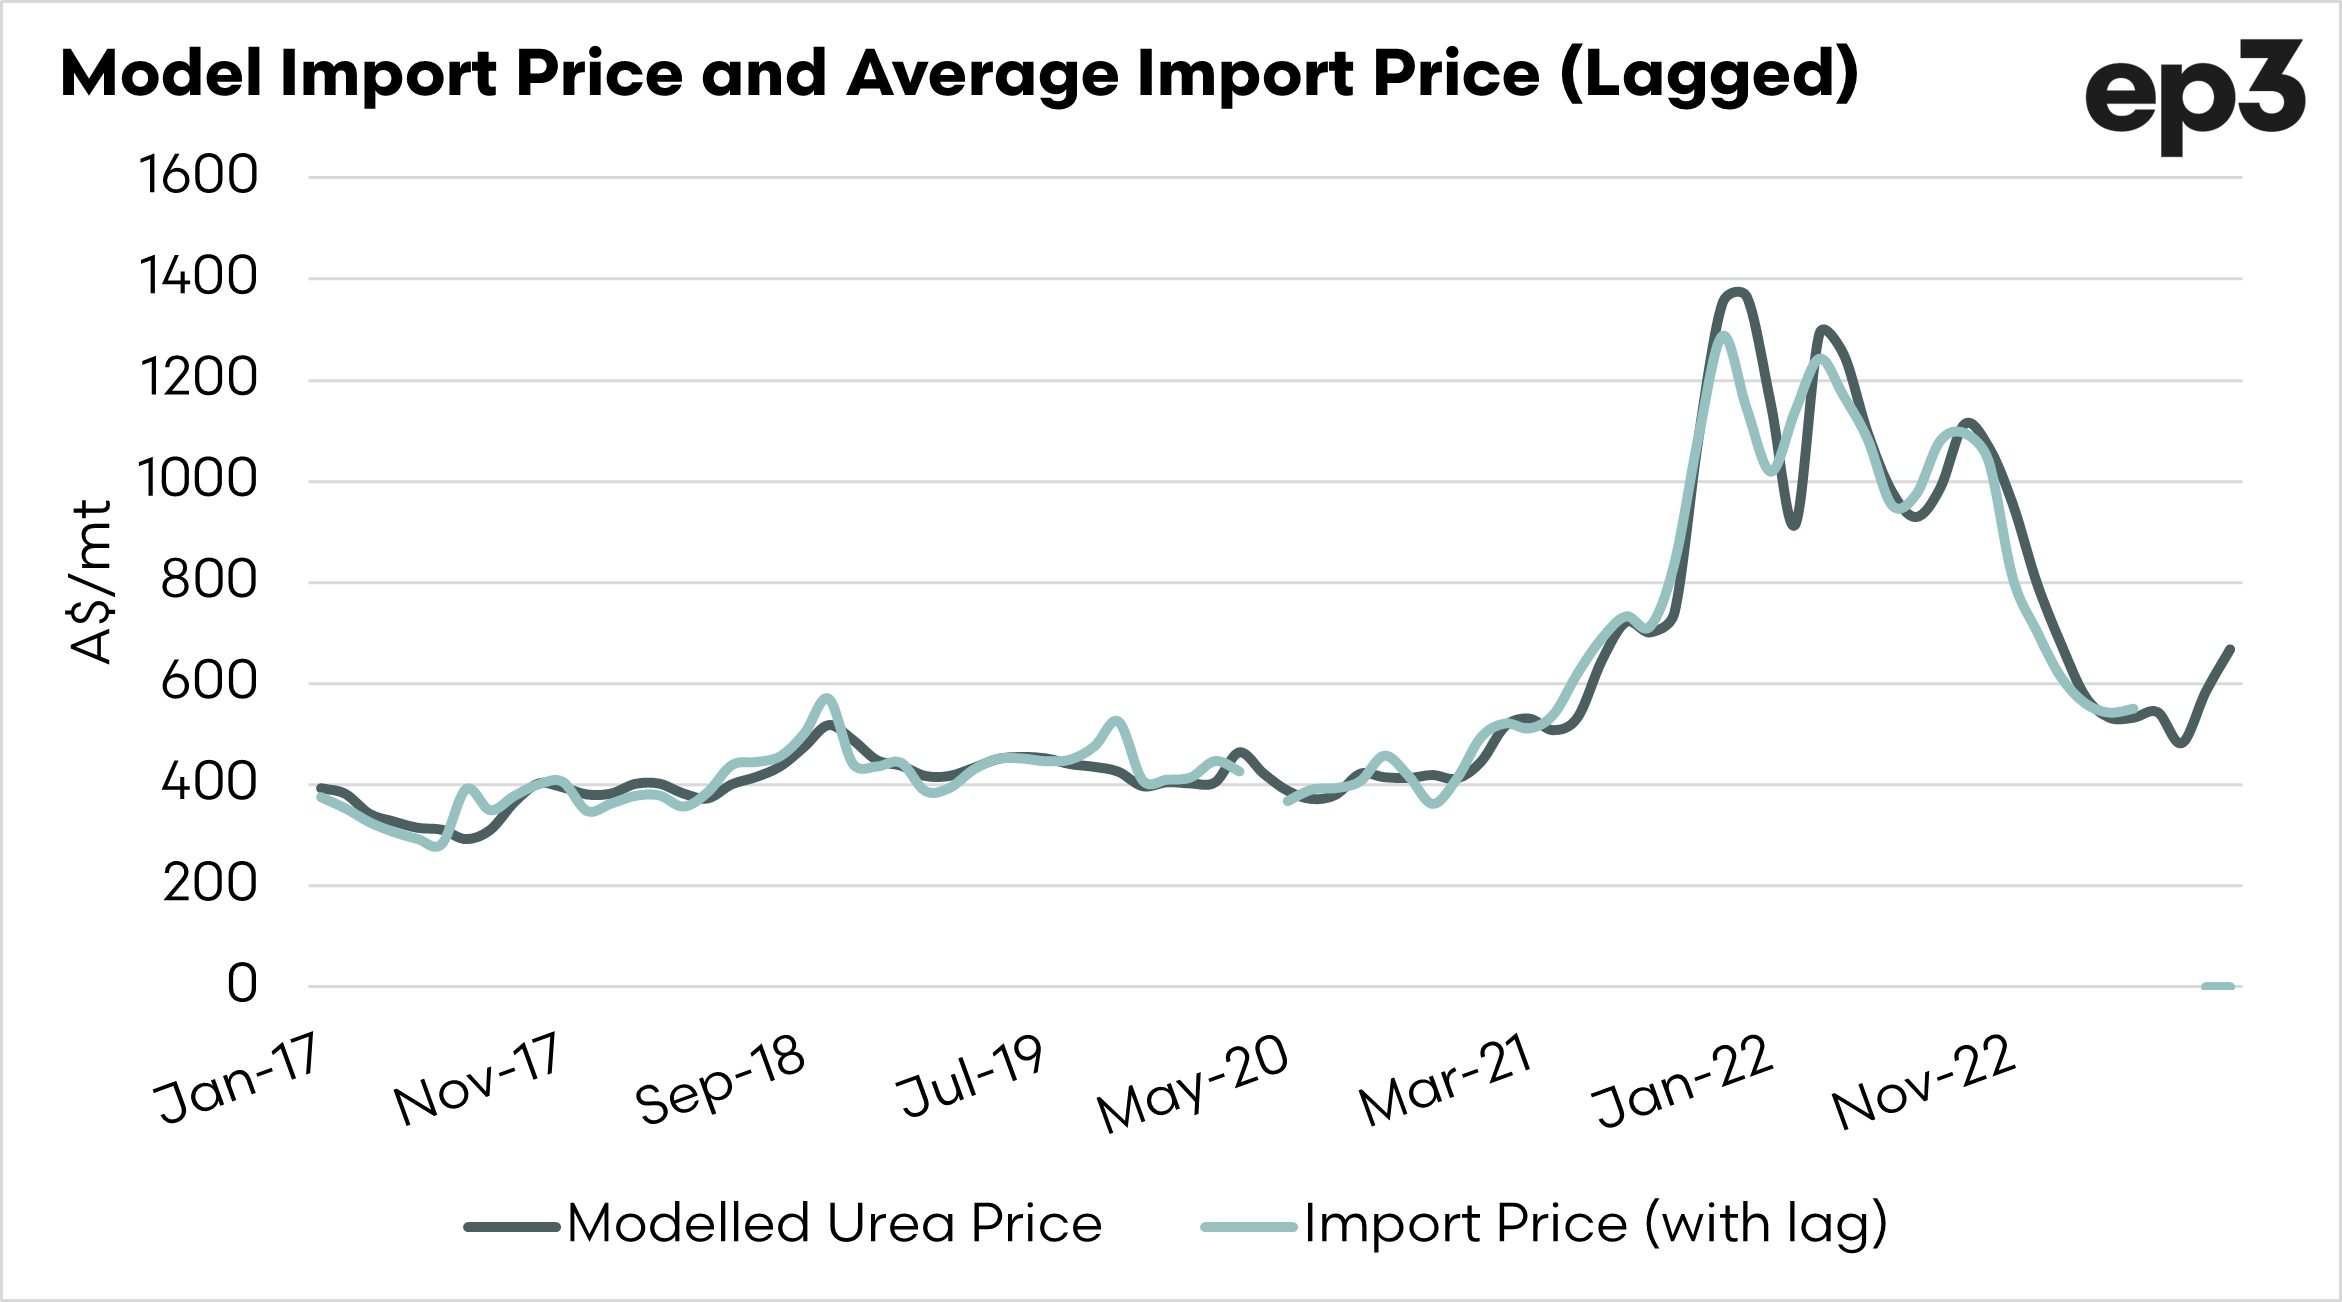
There is a delay. Importers will obviously not be buying, and the urea landing on our doorsteps the next day.
In the chart, I have applied a lagging effect of 3 periods. If you compare the two charts, it cleans it all up a bit.
The correlation now jumps to 0.98, about as close to perfect as we would expect to get. This improvement means that typically the price of our modelled urea imports will be reflected in the actual import price three months later.
If the model continues to show a strong correlation, as it has since 2017, then we will see the spot price reflected in the actual landed cost in three months’ time.

In the absence of anything better, our modelled urea price provides a solid indicator of the cost of importing urea into Australia; this is especially the case when we consider a three-month lag.
*We use the Middle East as a pricing point, as it reflects, on average, half of our imports of urea. They are also a major producer, so movements in their pricing will generally be reflected in the pricing achieved in the rest of the world.

