Urea Under Pressure: History Says Brace for Impact

The Snapshot
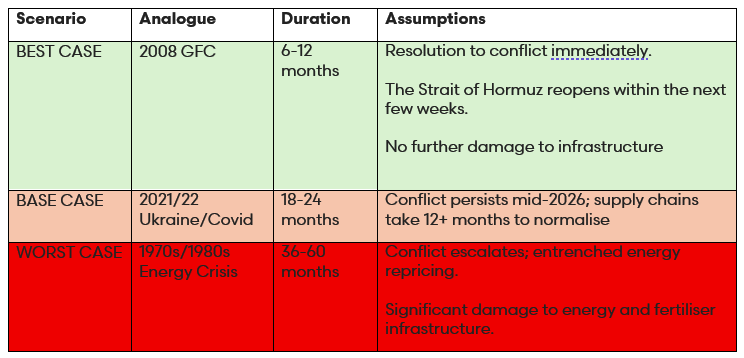
- Fertiliser price spikes historically last 6 months to 5 years, depending on whether the underlying energy shock resolves quickly or becomes structural.
- Current urea prices are well below historical peaks, but that is misleading when viewed in isolation.
- The urea-to-wheat ratio (1.83) is near record levels, sitting in the 97th percentile, signalling extreme affordability pressure.
- Farmers are being squeezed from both sides, with high input costs and relatively weak grain prices combining to erode margins.
- Even before the current conflict, fertiliser affordability had been deteriorating structurally since the early 2000s, meaning this is not just a short-term shock.
The Detail
How long can urea prices remain elevated? This is a question I have been asked multiple times over the past week by farmers and industry stakeholders. I have taken the time to look back at history to get some insights.
We all get focused on what is right in front of our faces, and that is seeding. This is understandable, but what about next year, or the following year?
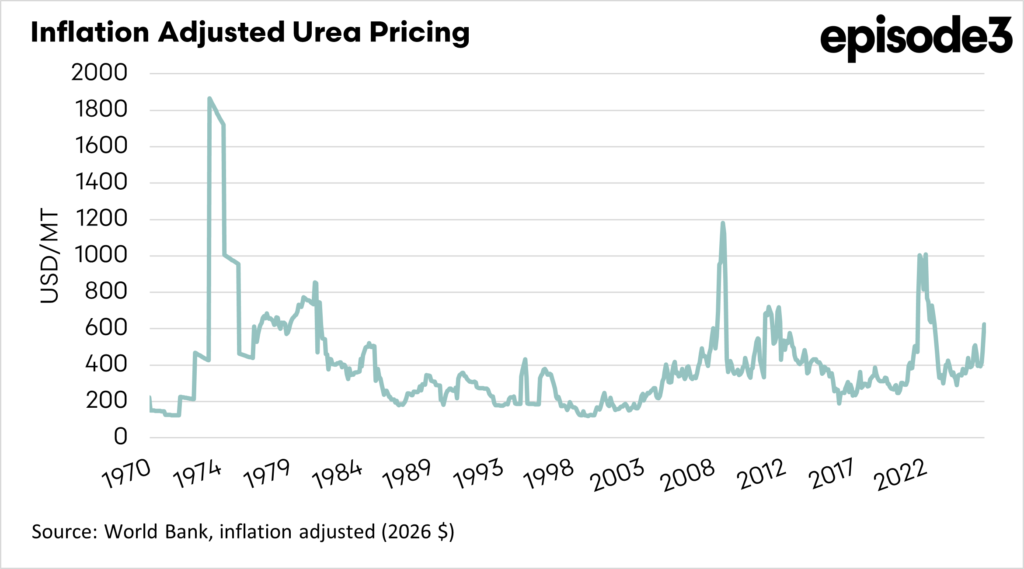
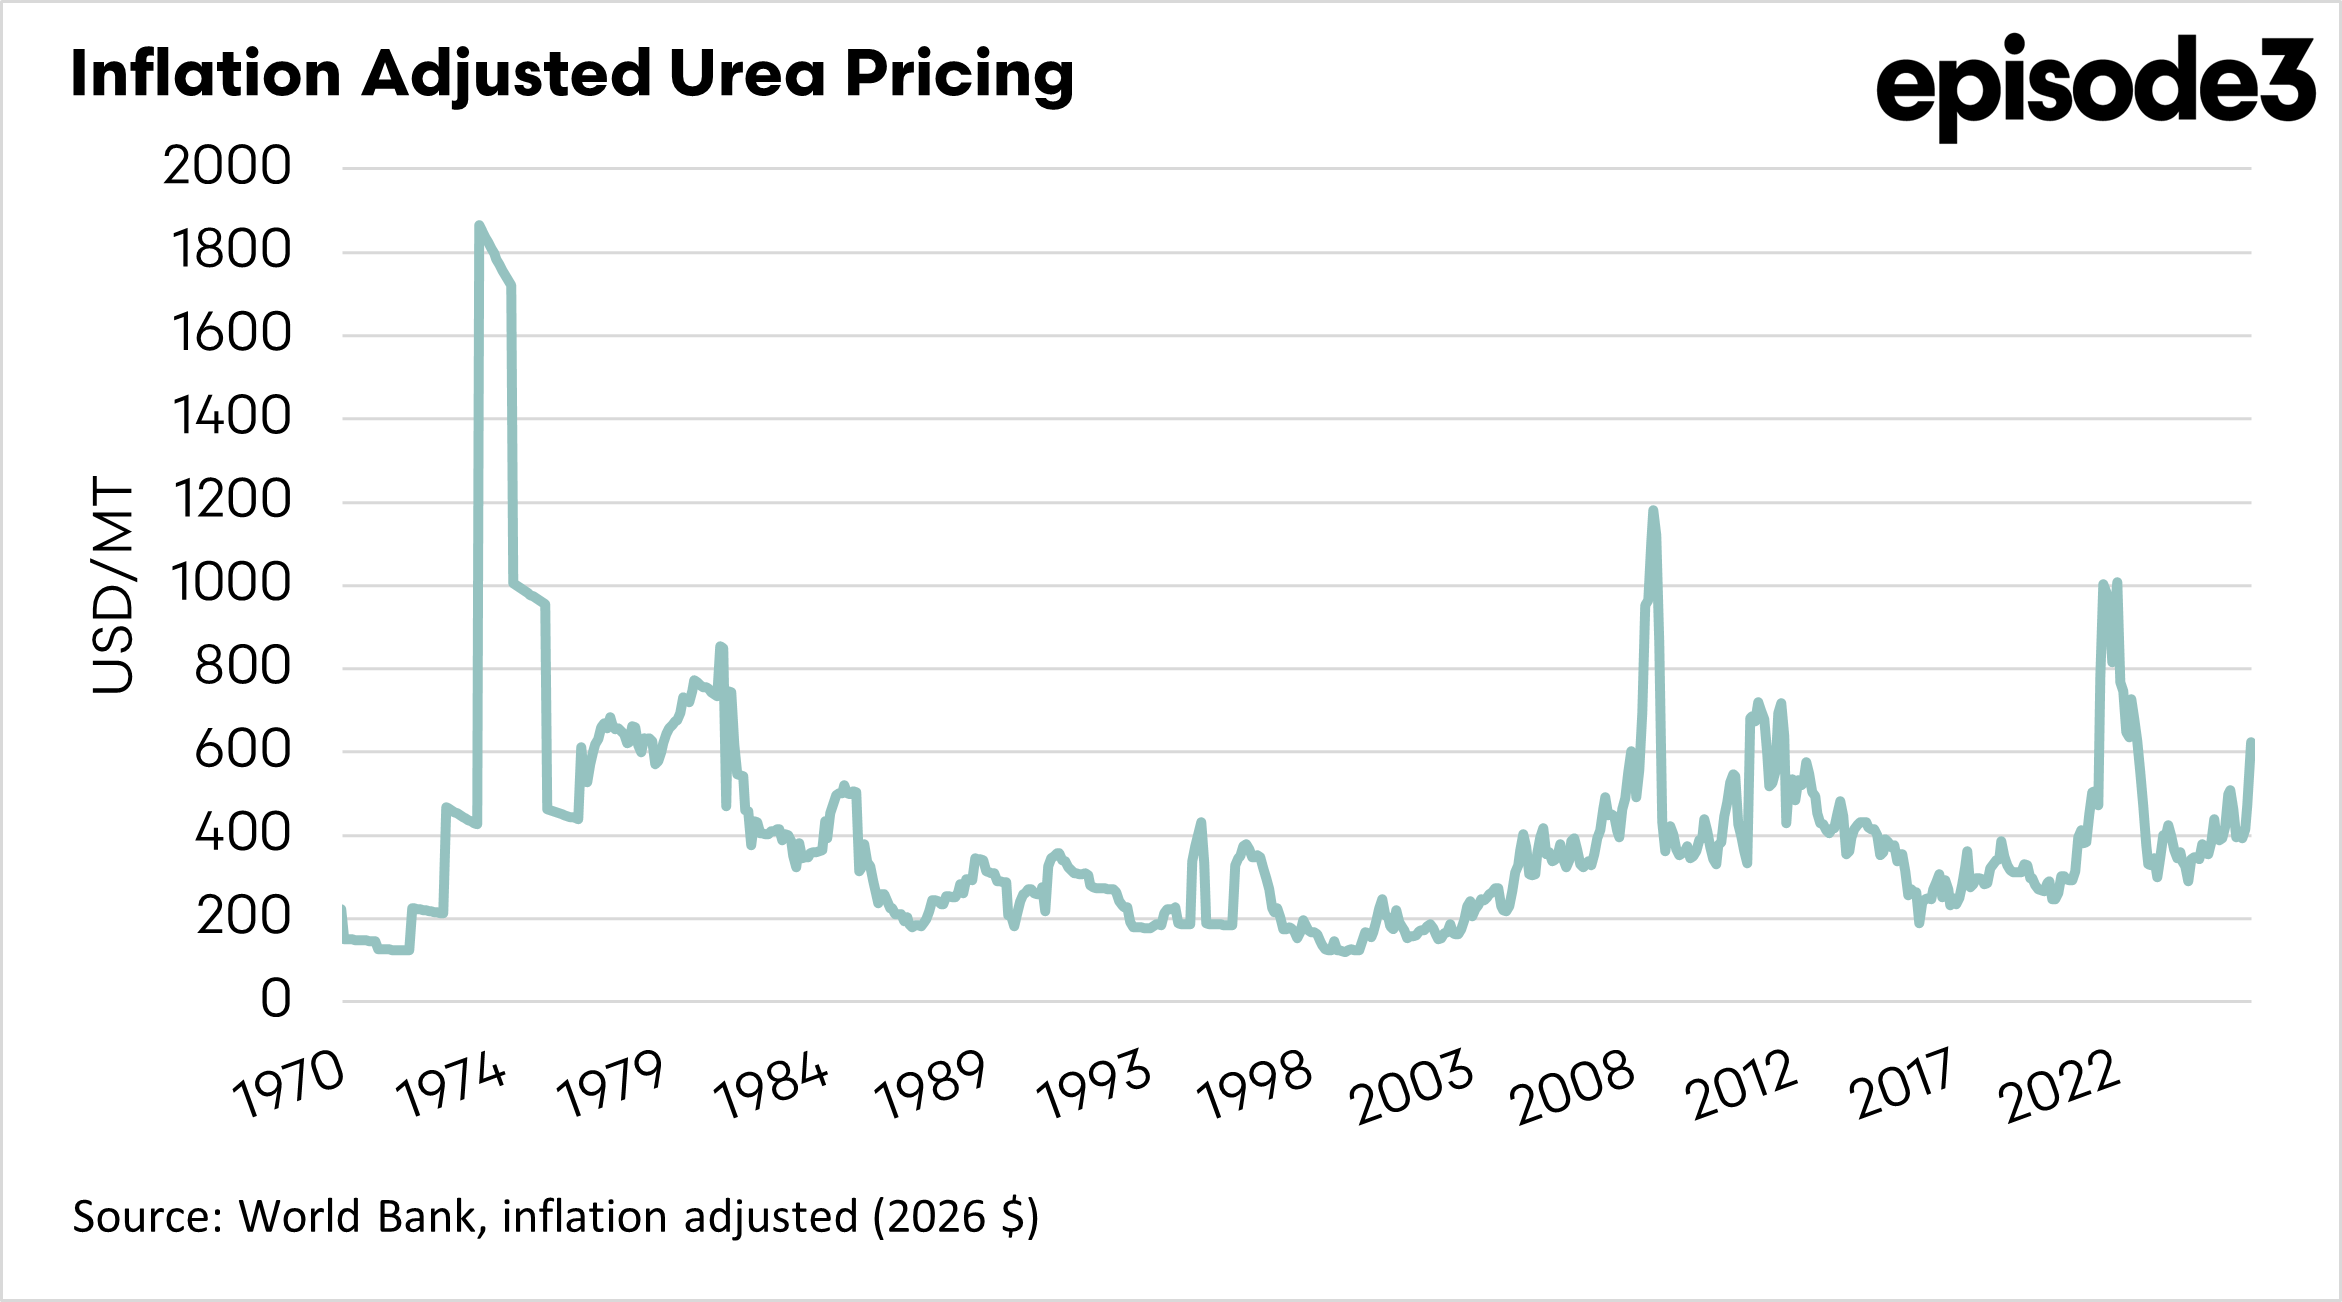
To do this, we can look at the history of urea pricing from the 1970s onwards. The short answer, based on 65 years of data, is that spikes driven by geopolitical energy shocks have ranged from six months to nearly five years. The honest answer is that the duration depends almost entirely on one variable: whether the underlying cause resolves cleanly or becomes structurally embedded in global energy markets.
How long can urea prices remain elevated? This is a question I have been asked multiple times over the past week by farmers and industry stakeholders. I have taken the time to look back at history to get some insights.
We all get focused on what is right in front of our faces, and that is seeding. This is understandable, but what about next year, or the following year?
To do this, we can look at the history of urea pricing from the 1970s onwards. The short answer, based on 65 years of data, is that spikes driven by geopolitical energy shocks have ranged from six months to nearly five years. The honest answer is that the duration depends almost entirely on one variable: whether the underlying cause resolves cleanly or becomes structurally embedded in global energy markets.
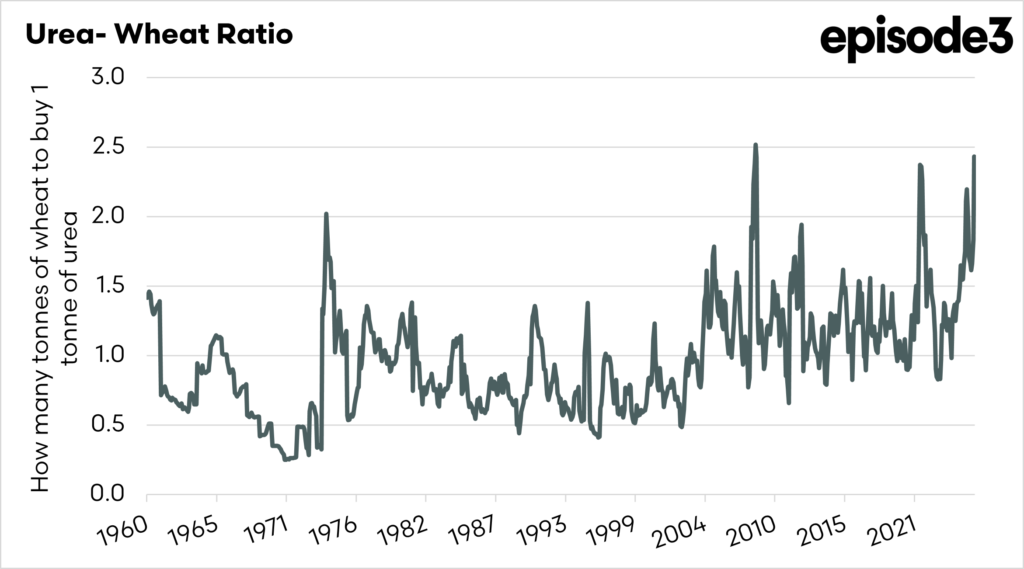

Urea unaffordability is getting close to records.
The urea-to-wheat ratio is currently sitting at 1.83, meaning a tonne of urea costs the equivalent of 1.83 tonnes of wheat. The long-run average since 1960 is 0.91. In plain terms, the ratio is currently at its 97th percentile. There has barely been a worse time in six decades for a grain farmer trying to work out whether the next bag of urea is worth putting on.
The reason this metric is so damning is that it captures both sides of the squeeze simultaneously. Urea is elevated in real terms (76th percentile), while wheat is historically depressed (16th percentile). It is not just that inputs are expensive. Output prices are also low by historical standards. The combination is what makes the current environment structurally difficult, and that structural problem predates the current conflict by years.
The ratio first broke sustainably above 1.0 around 2002, during the commodity ‘supercycle’, when energy prices began permanently upward repricing of fertiliser inputs. It averaged 0.74 in the cheap-input era of 1986 to 2001. It has not been below 1.0 for any sustained period since. The Middle East conflict has pushed it to near-record levels, but it was already heading in the wrong direction before it began.
So, based on the past, how long could this elevated pricing last?

The historical record
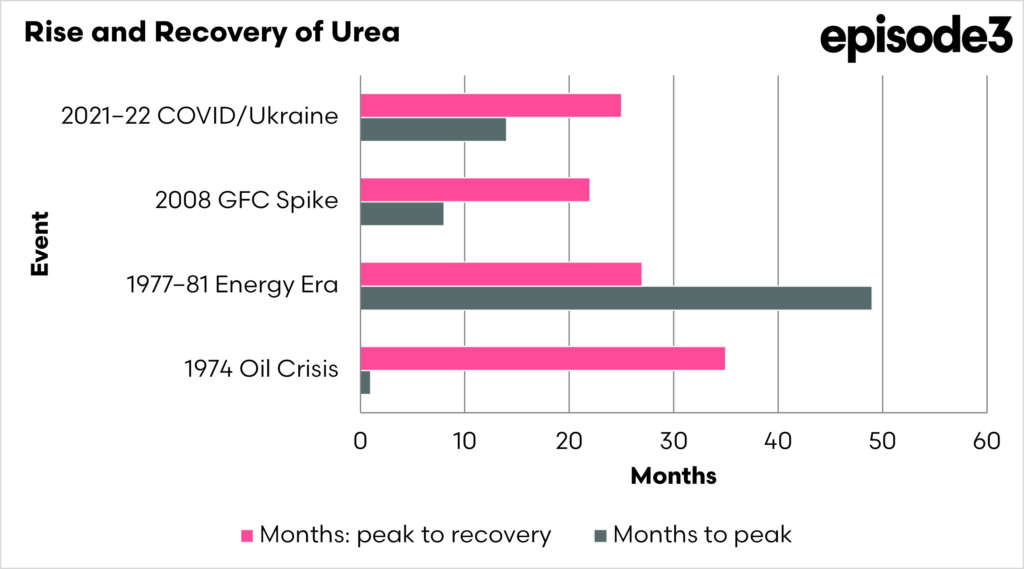
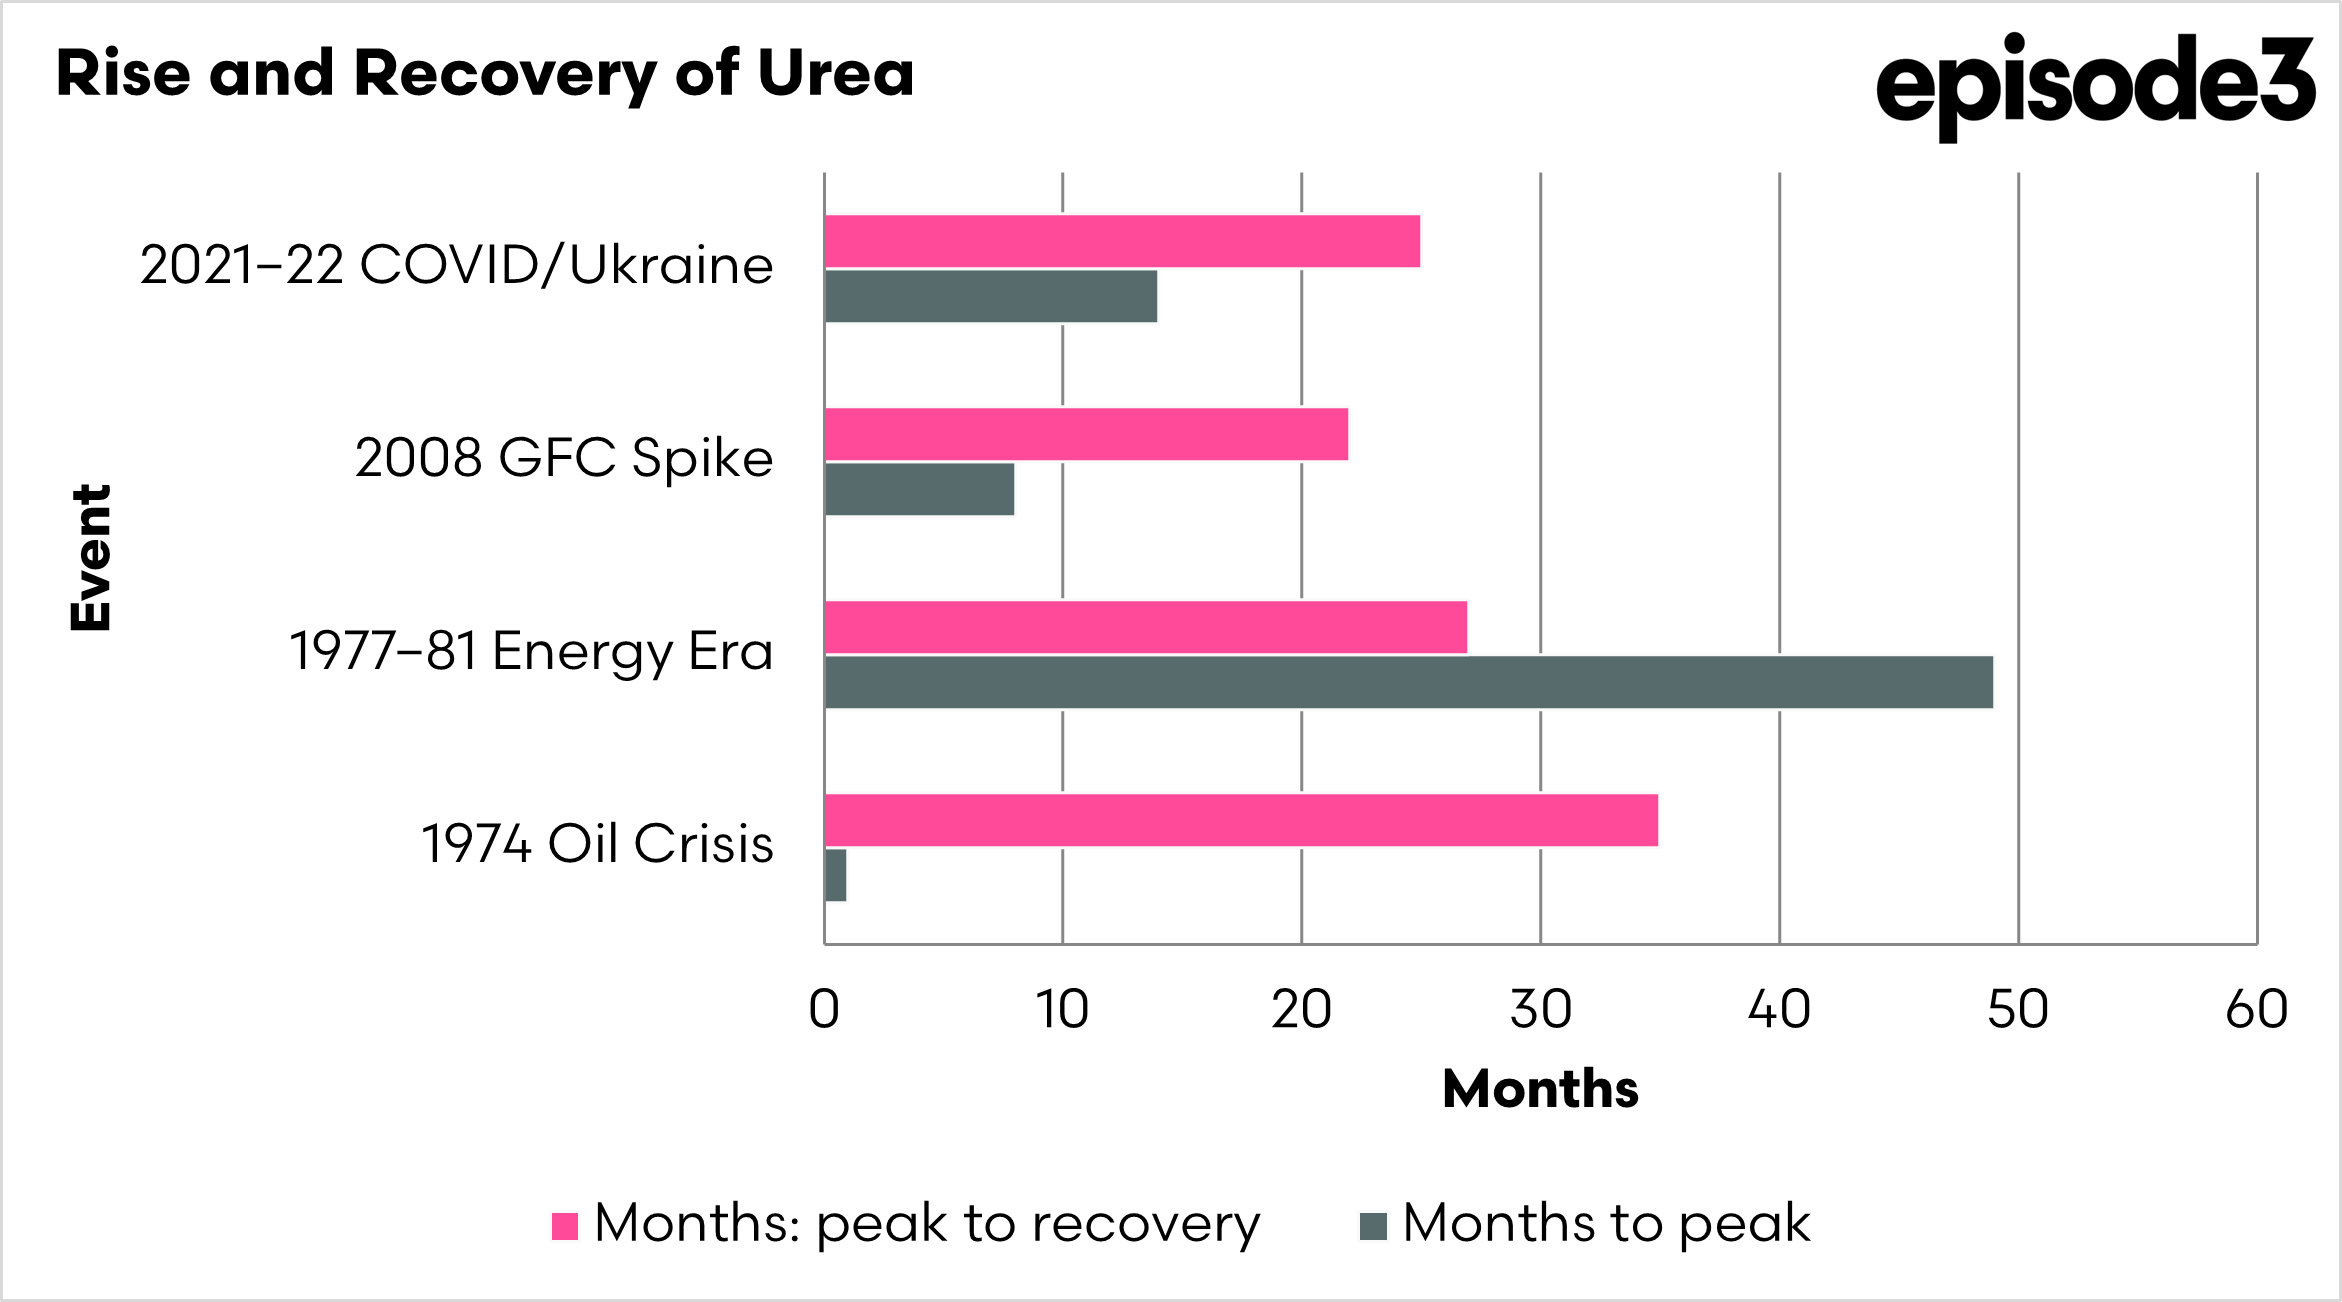
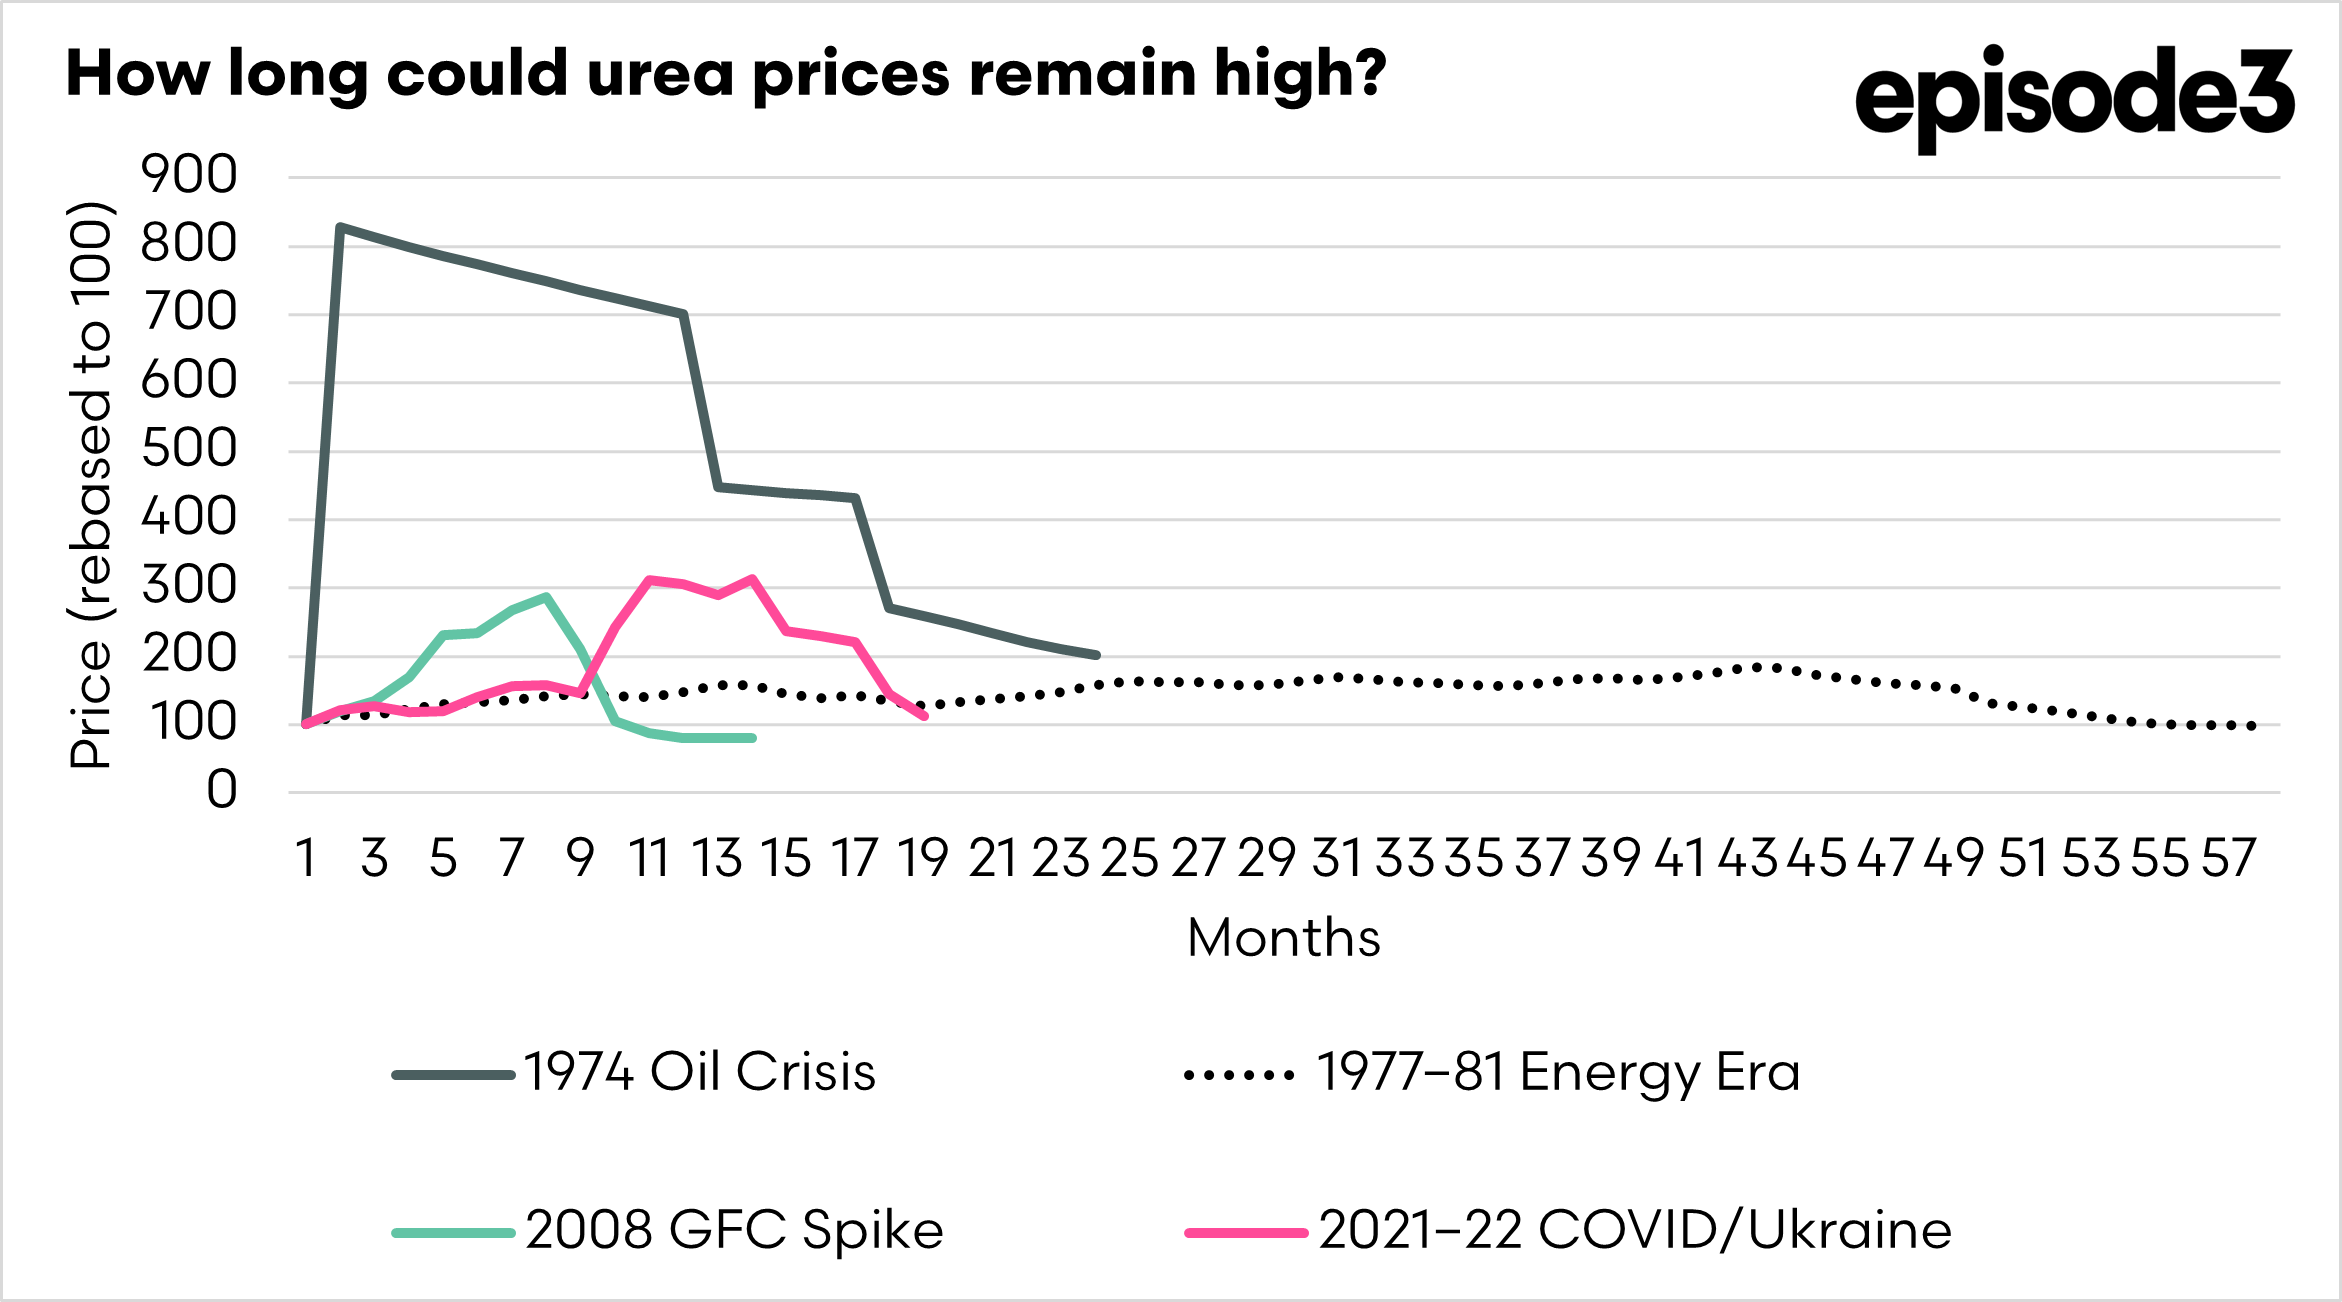
There are five major peaks that stand out between the 70s and today. Each of these price peaks has parallels to the events we are experiencing today.
1974 oil crisis24 months elevated
The OPEC embargo sent real urea prices to US$1865 per tonne, a record that still stands today. But the spike itself, while extreme, resolved within two years once global energy markets found a new equilibrium and producers ramped up output. It ended because it had a definable cause and conclusion.
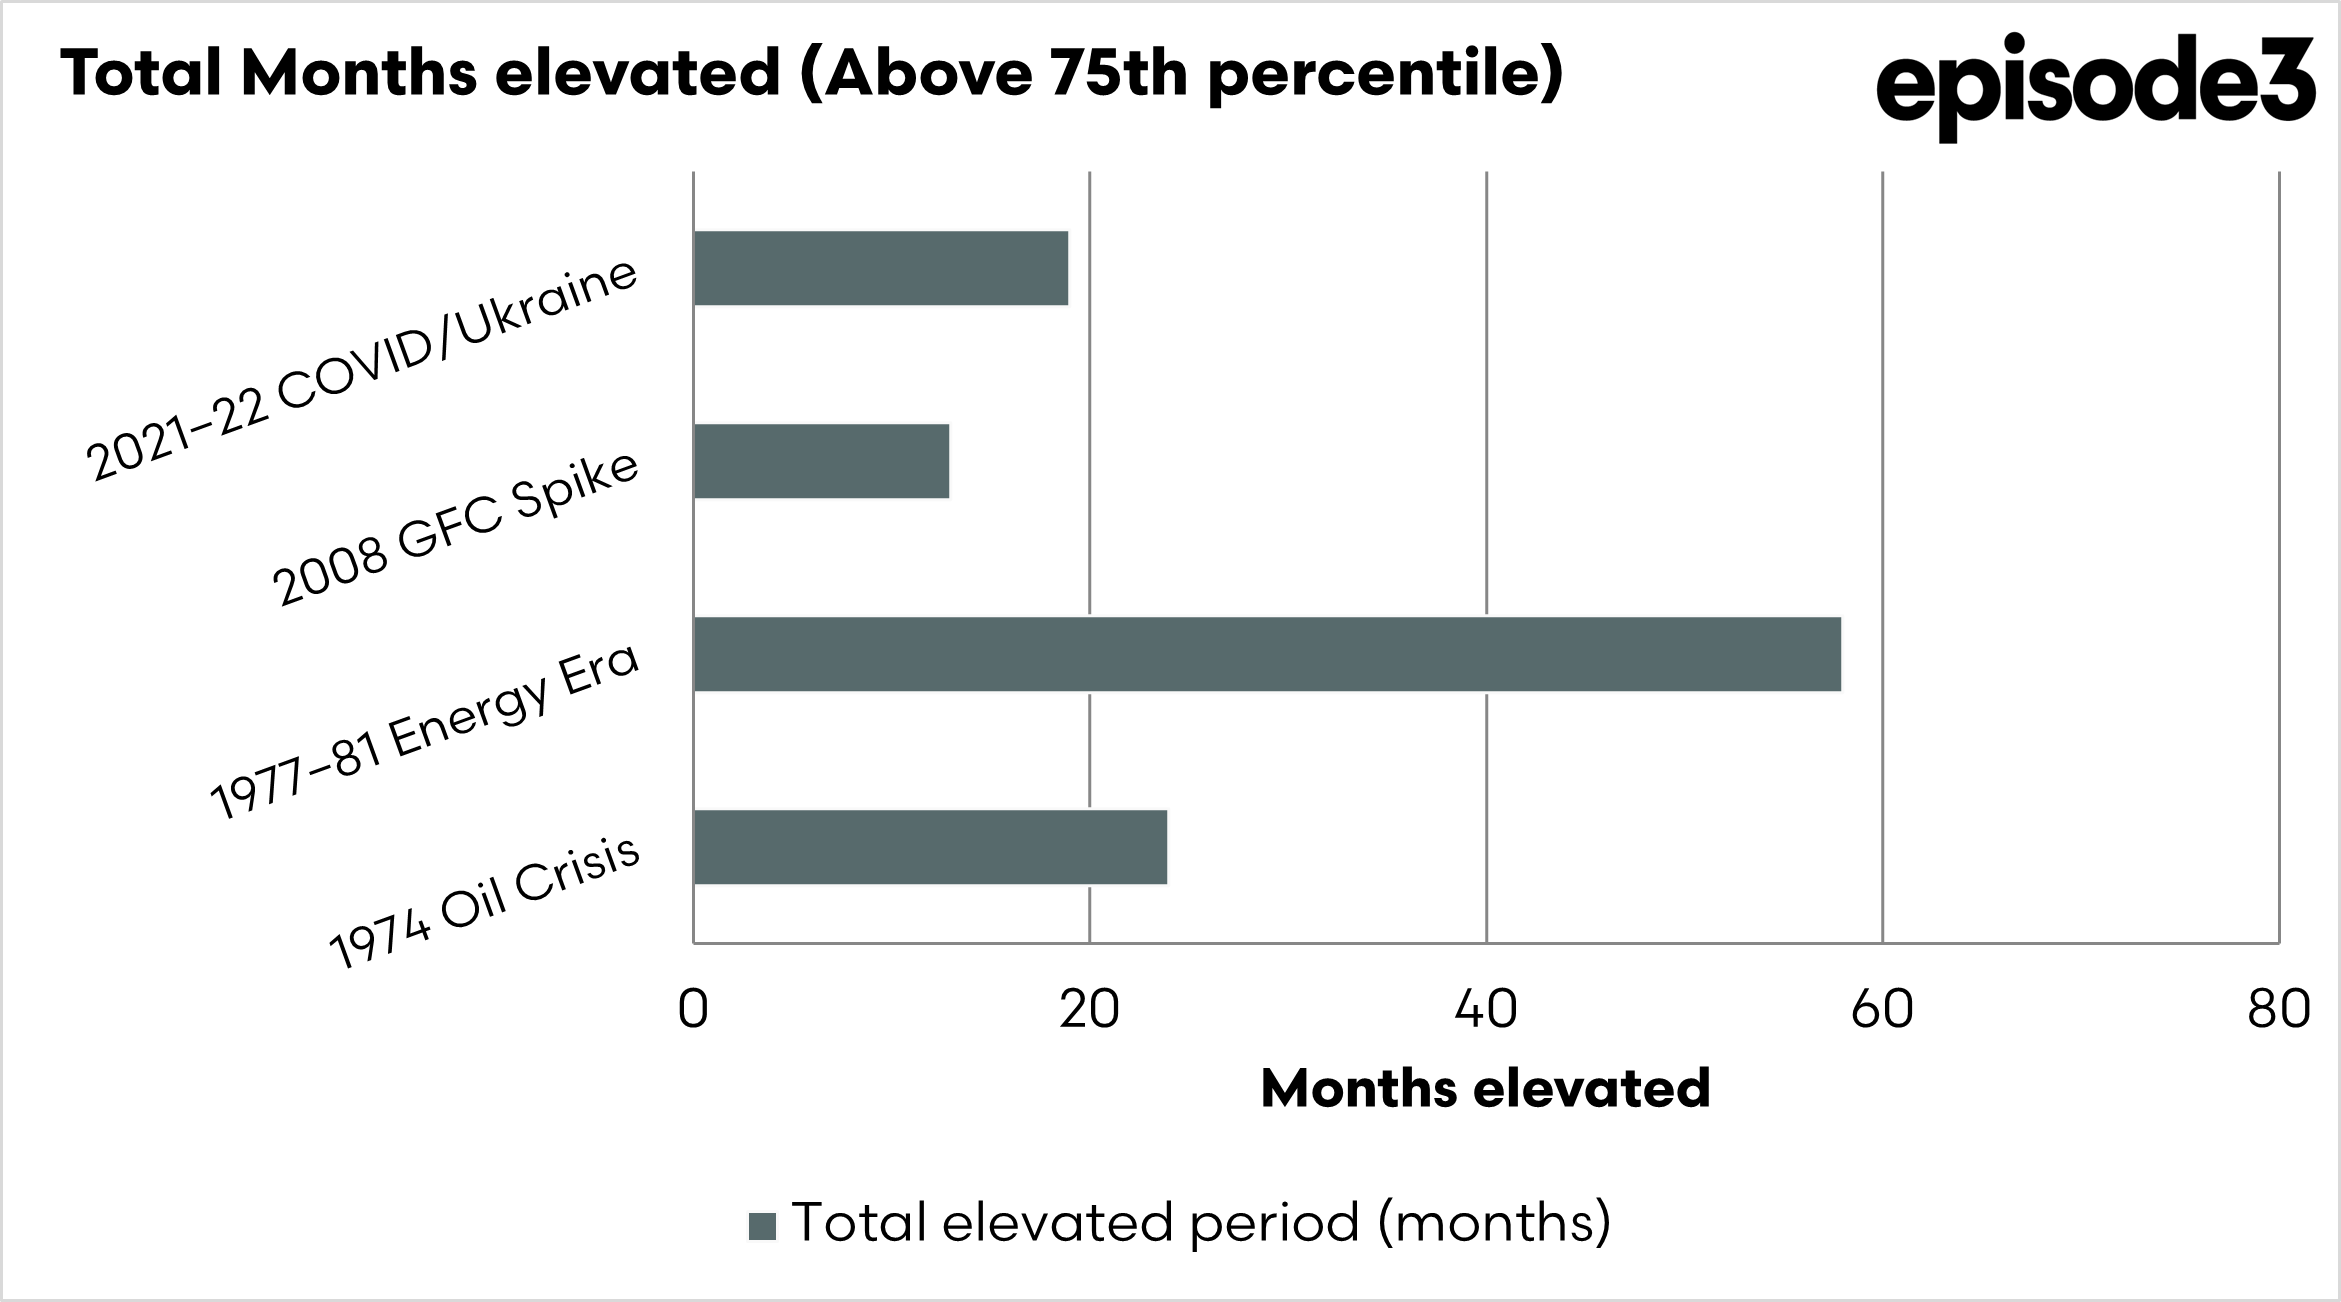
This event resulted in 24 months of elevated pricing.
1977–81 energy era
This is the bear-case analogue, the one that should give pause. It was not one event but a sequence: the second oil shock of 1979 layered onto still-elevated energy costs from 1974, with no single resolution point. There was no clean end to the crisis, only a slow grinding normalisation over nearly five years as energy markets gradually restructured. The peak price reached US$855 per tonne in February 1981, and it took a further 27 months after that to fall back to pre-crisis levels.
This event resulted in 58 months of elevated pricing.
2008 GFC spike
The fastest resolution in the dataset. Urea rose 186% in real terms to US$1180 per tonne, then collapsed almost as fast. The mechanism was financial rather than physical: when global credit markets froze and demand cratered, commodity prices snapped back hard. Prices peaked in August 2008 and had largely normalised within six months. The lesson here is that demand destruction can resolve a spike faster than any diplomatic effort.
This event resulted in 13 months of elevated pricing
2021–22 COVID/Ukraine
The most recent and arguably most instructive analogue. Urea rose 286% over 22 months before peaking at US$1009 per tonne real in April 2022. It then took a further 25 months to fully unwind. The complicating factor was physical, not financial: supply chains did not just get disrupted, they had to structurally reorganise. New shipping routes had to be established, new supplier relationships built, and war-risk insurance normalised. Even after the immediate crisis eased, the cost of doing business in disrupted trade corridors remained elevated.
This event resulted in 19 months of elevated pricing.