Will freight sea freight rates help farmers?

Freight
At EP3, we keep an eye on freight rates as often as we look at everything else. Freight is clearly important as we export most of our produce, and import most of our inputs. Freight movements have large impacts upon end results.
So as we move into 2022, let’s have a look at what is happening.
Bulk
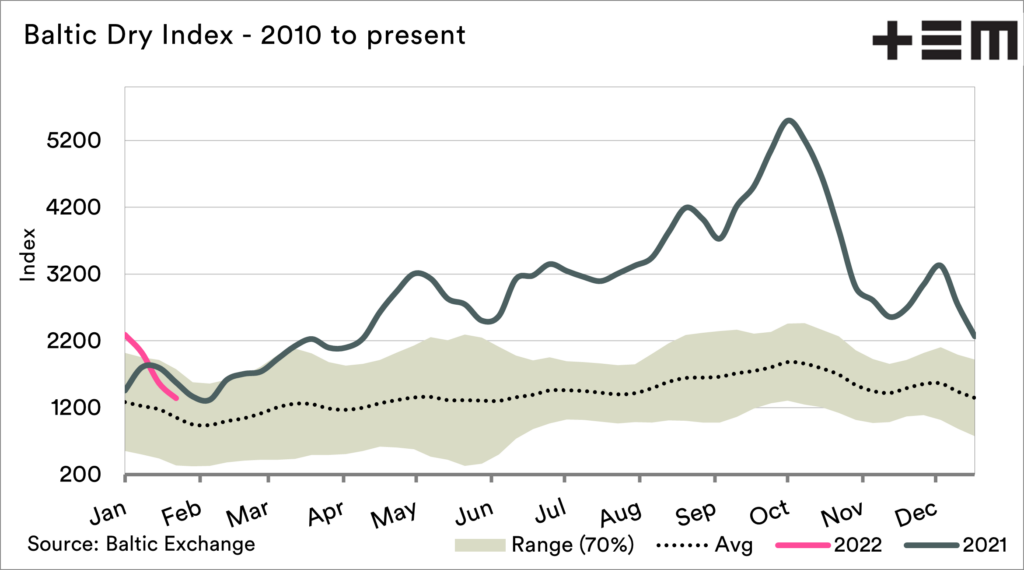
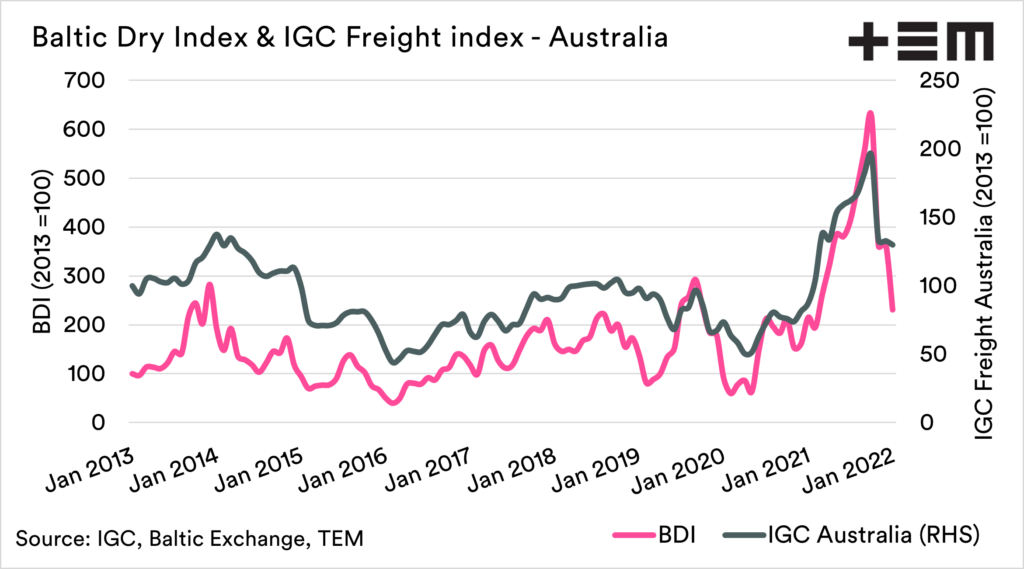
The dry bulk market is significant as it is fundamental to our exports of grains but also our imports of fertilizer. The Baltic Dry Index (BDI) is an important indicator of bulk freight rates. The BDI rallied throughout 2021. This was off the back of strong demand for commodities, especially coal and iron ore.
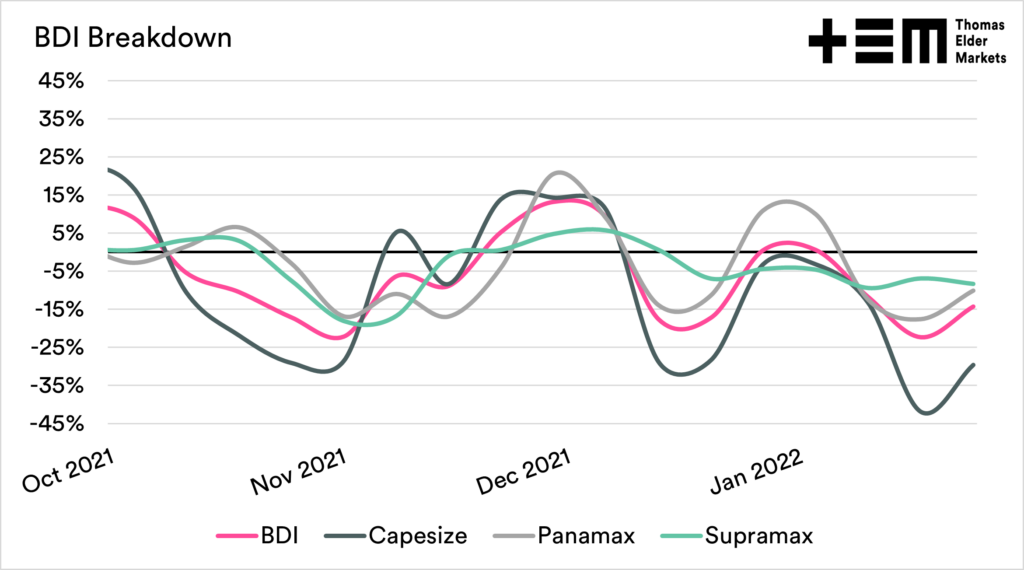
The dry bulk market has come under pressure from the highs of October. One thing to bear in mind is that BDI is a composite index of different sized vessels. All vessel classes have fallen, but Capesize has been where the majority of the fall has occurred. The Capesize vessels are largely used for minerals (coal/iron ore). There has been a reduction in demand for iron ore in China and reduced exports from Indonesia, resulting in diminished demand.
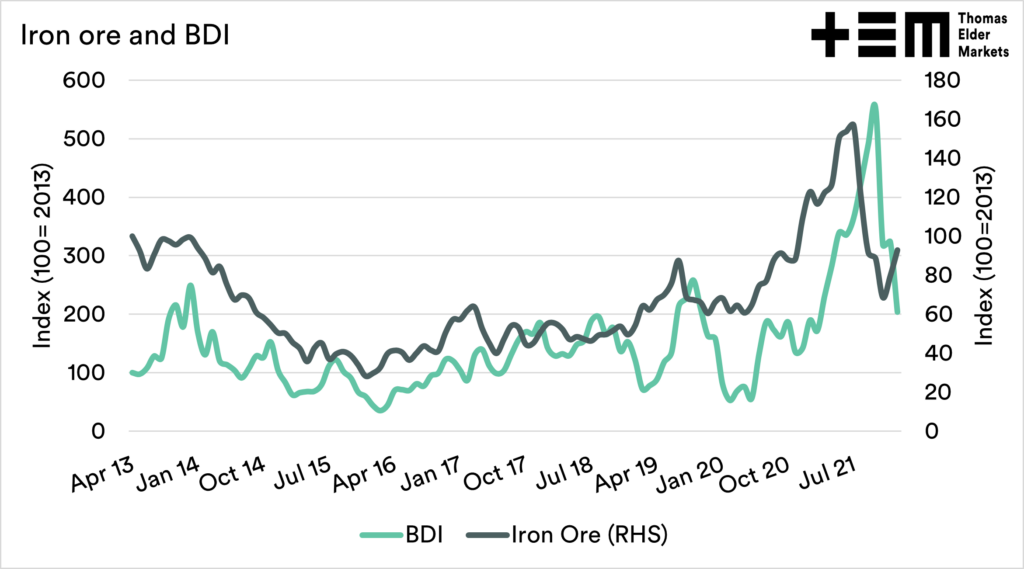
The third chart below shows a rebased BDI and Iron Ore index from 2013 to the present. This shows the relationship between Iron ore and the BDI. The trends of the two tend to move with one another quite closely. This is important as the BDI (and potentially ore) secondary role as a lead economic indicator. A higher BDI is considered by many to be a proxy for global growth, as bulk carriers transport the underlying commodities required for the production of, well, everything.
What does it all mean for farmers? The smaller (relatively) vessel sizes mainly used by the grain/fert industry have not fallen at the same rate as the larger vessels. However, the price has fallen, which should flow through to cheaper freight rates for our outgoing products and the fertilizer coming into the country.
The secondary use as an economic indicator could point towards slower economic growth, which is generally poor for agriculture, leading to less consumption. We shall see in the coming year if there is a slowdown after the rapid recovery in 2021.
Containers
Containers operate in a completely different market to bulk and should always be treated separately.
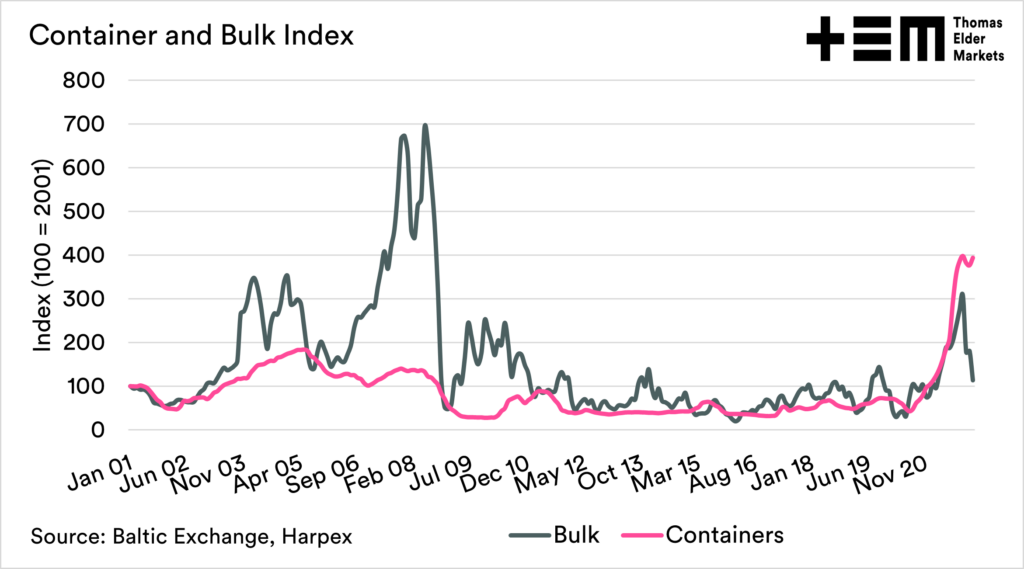
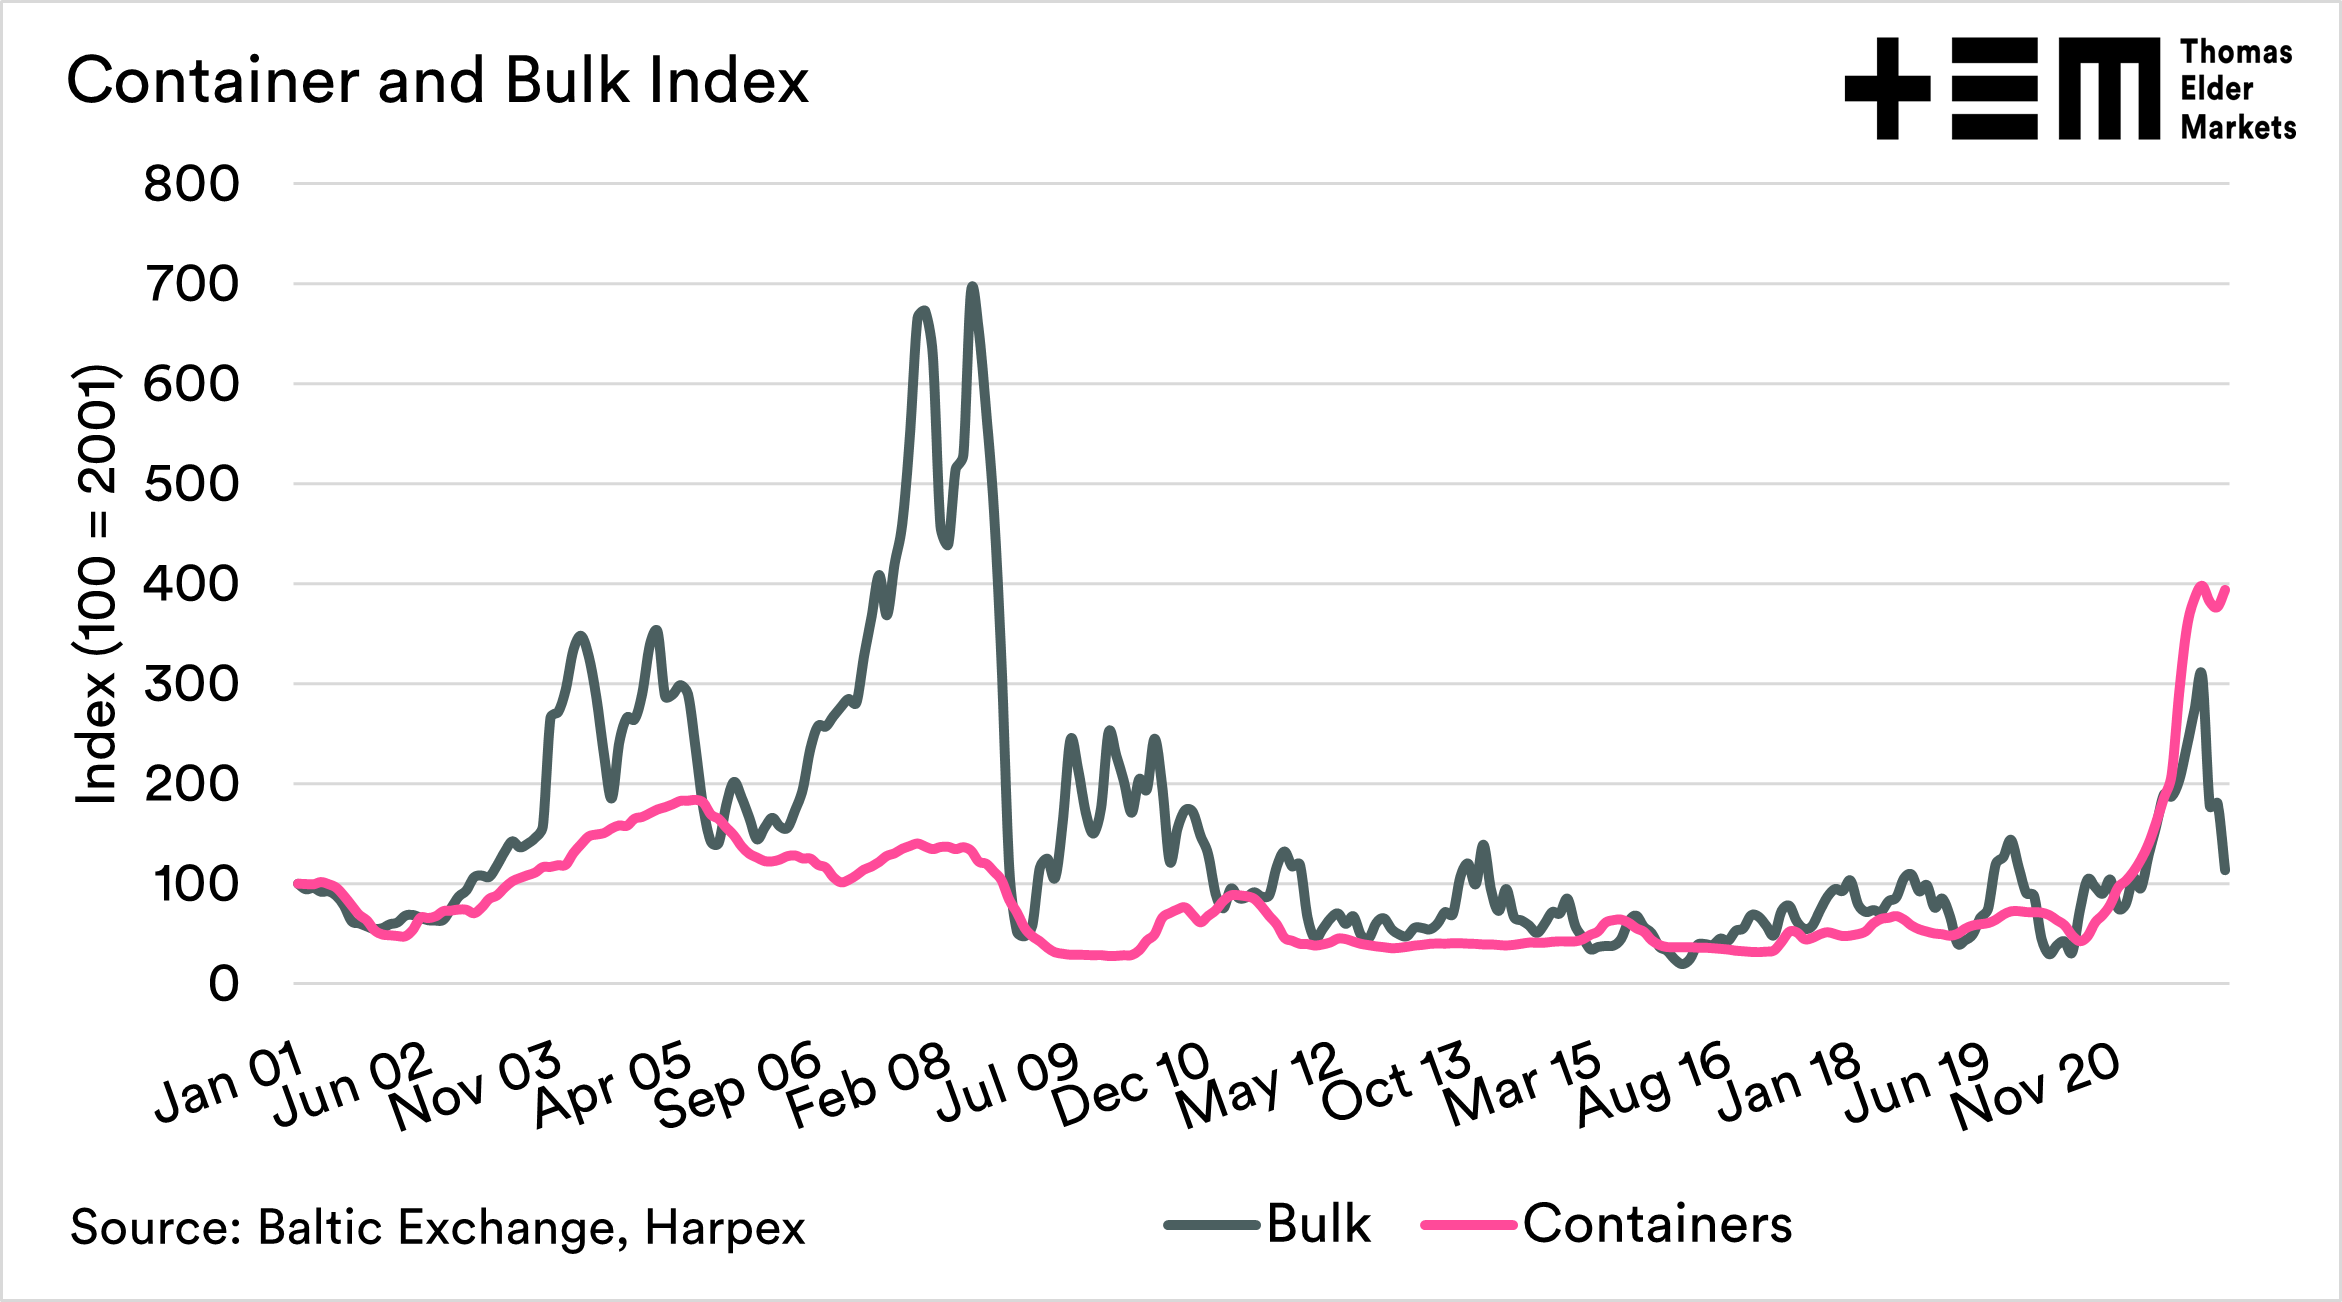
The first chart below shows an index of bulk vs container pricing from 2001 to the present. Containers follow some of the trend movements of bulk. When growth increases, then containers rise due to demand. Containers are at huge pricing levels; unlike the bulk rates, containers have not really lost much steam.
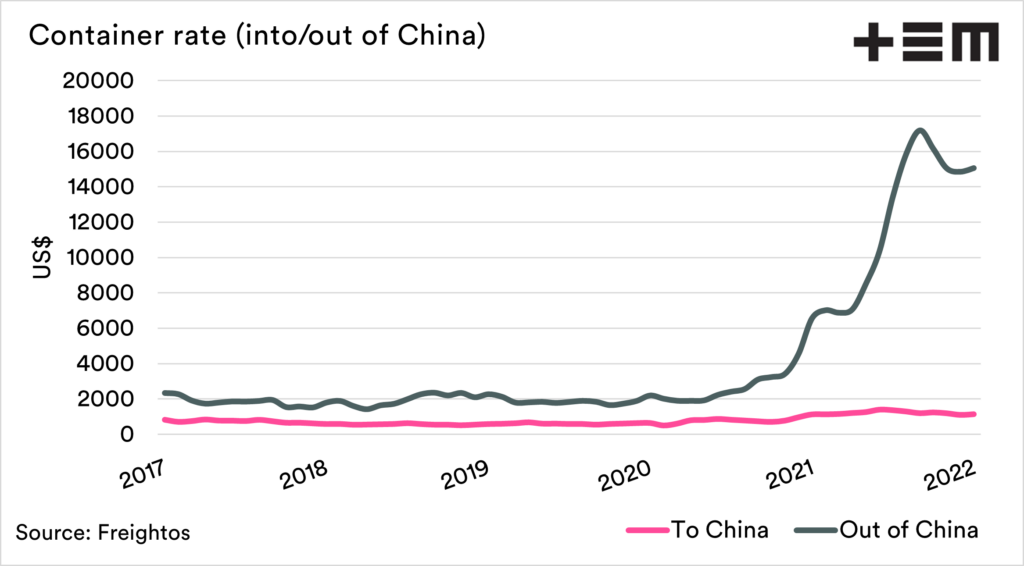
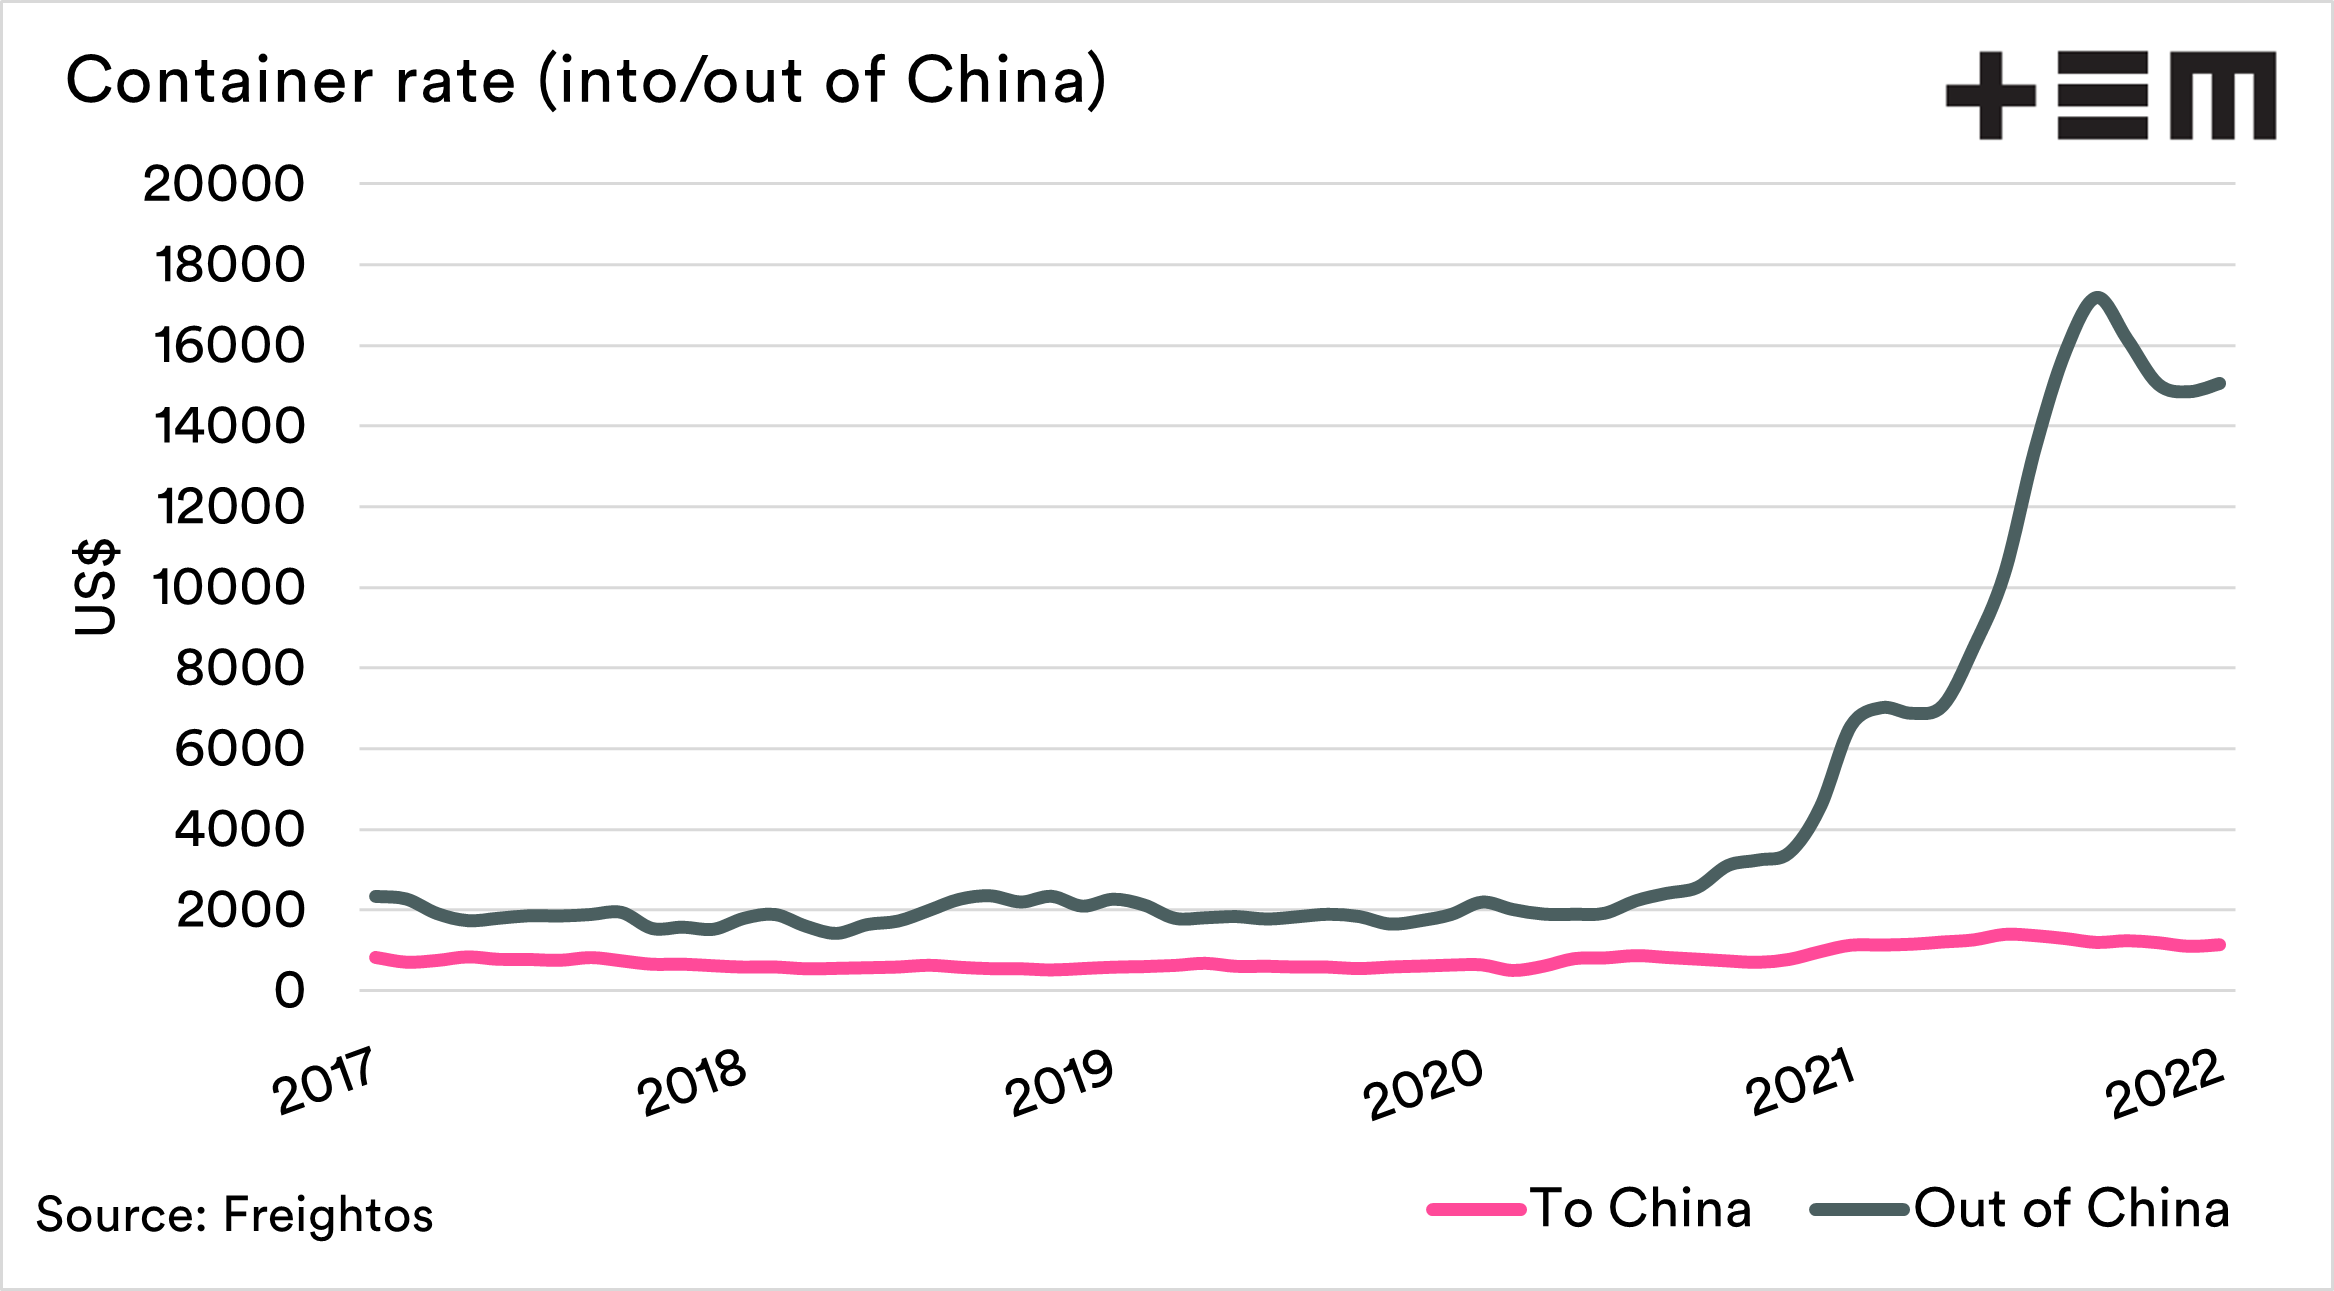
The second chart shows an average of the rate into and out of China. We can see that the demand is largely centred around China – that is where the worlds consumer goods are coming from.
In theory, we may see a fall in containers in the coming months. If we think of bulk as being a lead indicator of growth, a downturn in growth could see less demand for the contents of boxes. This is just conjecture at the moment but something to examine over the next half of the year.
All products moved by containers are facing higher costs, the biggest being pulses, fibres and meat. Containers remain a struggle with difficult access to empty boxes and extreme rates for movements. This has led to longer lead times for parts etc.

