
Analysis in decline

The Snapshot
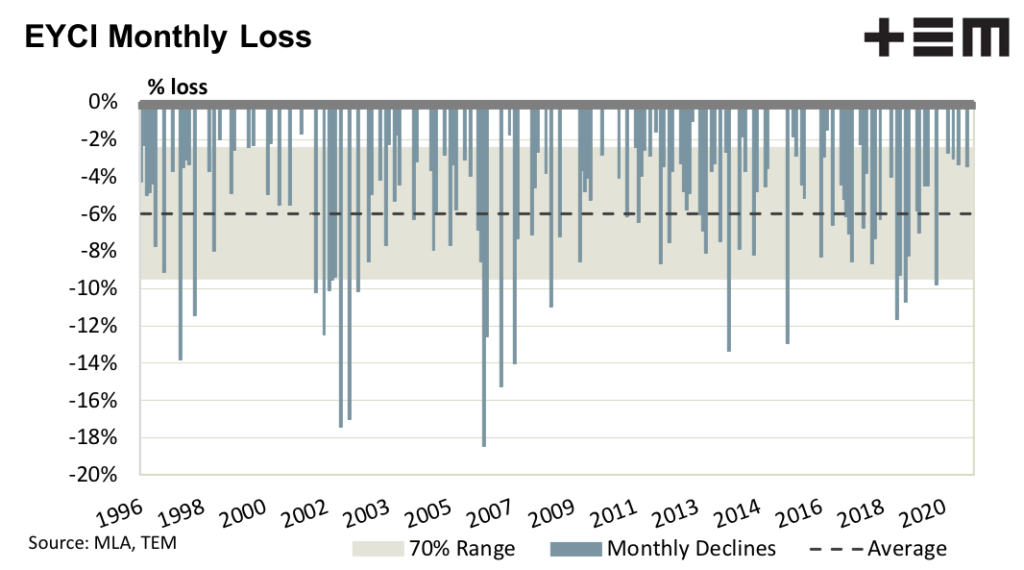
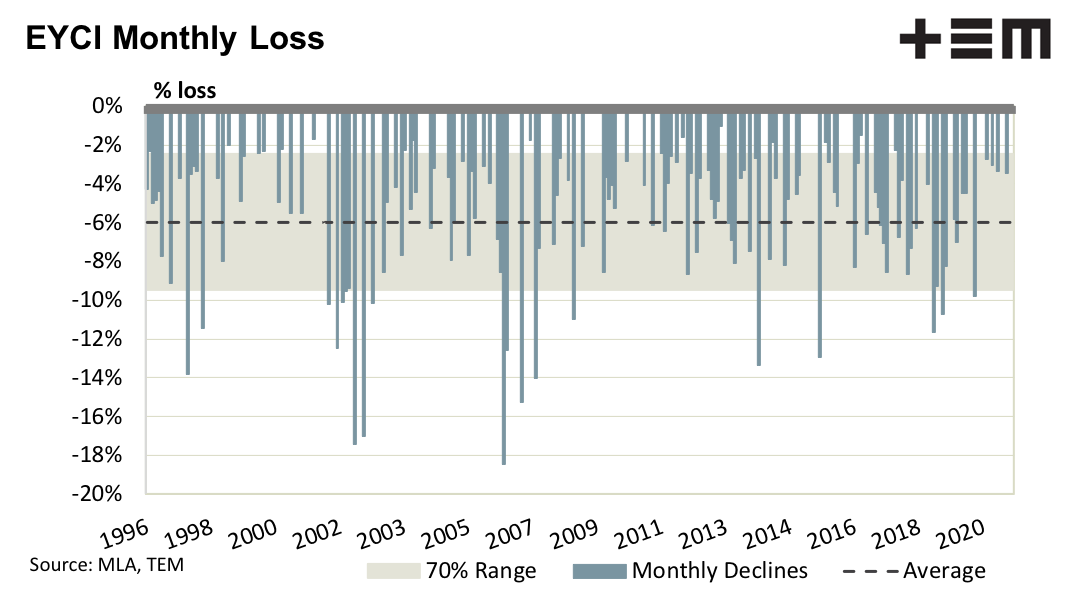
- A focus on the months where EYCI price declines were present shows that declines have been of a 6% magnitude on average, with a 70% range between 2% decline and 9% decline.
- Singular monthly declines of 10% or more could be considered quite abnormal and rarely occur in successive months.
- Since 1996, there was only one instance when the EYCI declined by 9% or more each month, and that magnitude decline lasted for only three successive months.
- Indeed, you would have to lower the monthly decline threshold to 4% or more to find a time when prices declined for five consecutive months, and this has happened only once since 1996.
The Detail
The Episode3 team was lucky enough to be featured on the ABC Victorian Country Hour yesterday with new host, Warwick Long, talking about the Eastern Young Cattle Indicator (EYCI). We fielded a query on some analysis undertaken recently based on the view of an “orderly decline of 10% for the next four to five months” as a possible scenario for the EYCI. We also fielded many direct queries on this matter to the EP3 website contact us page from our subscriber base, so we thought it was worthy of some detailed analysis.
At the time our gut feeling was that this price decline scenario was excessive and potentially scaremongering. Rather than just resting on a feeling based on an anecdotal view of the market we thought it better to actual crunch the numbers and model what has happened to month on month price changes to the EYCI since it began being reported by Meat and Livestock Australia in 1996.
Analysis was undertaken on daily EYCI prices to measure the monthly high and monthly low, determining if the market was rising or falling and by what percentage each month. As the chart of the results shows monthly declines on the EYCI beyond 10% aren’t very common, and rarely occur successively even for two or three months, let alone as much as five months in a row.
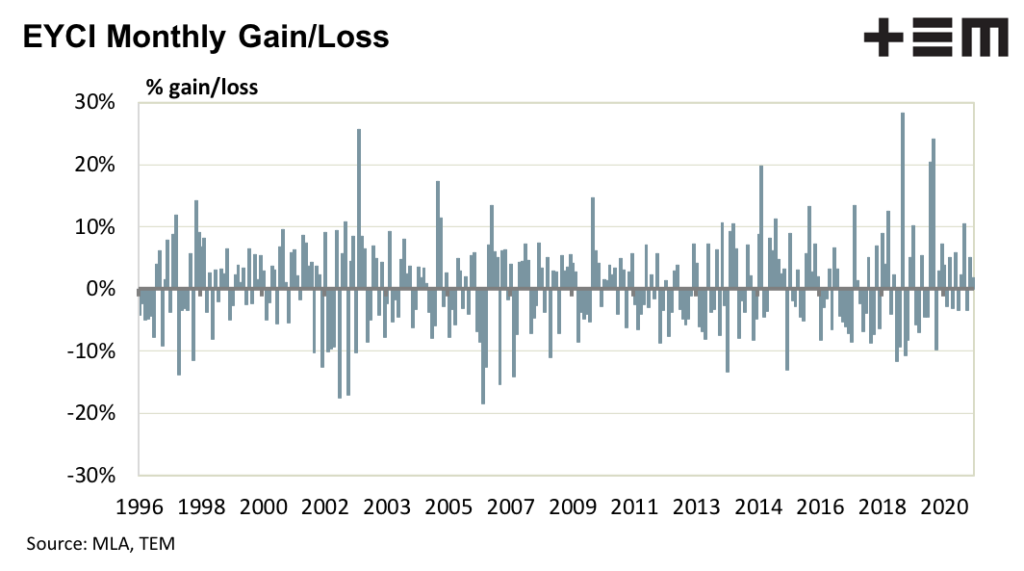
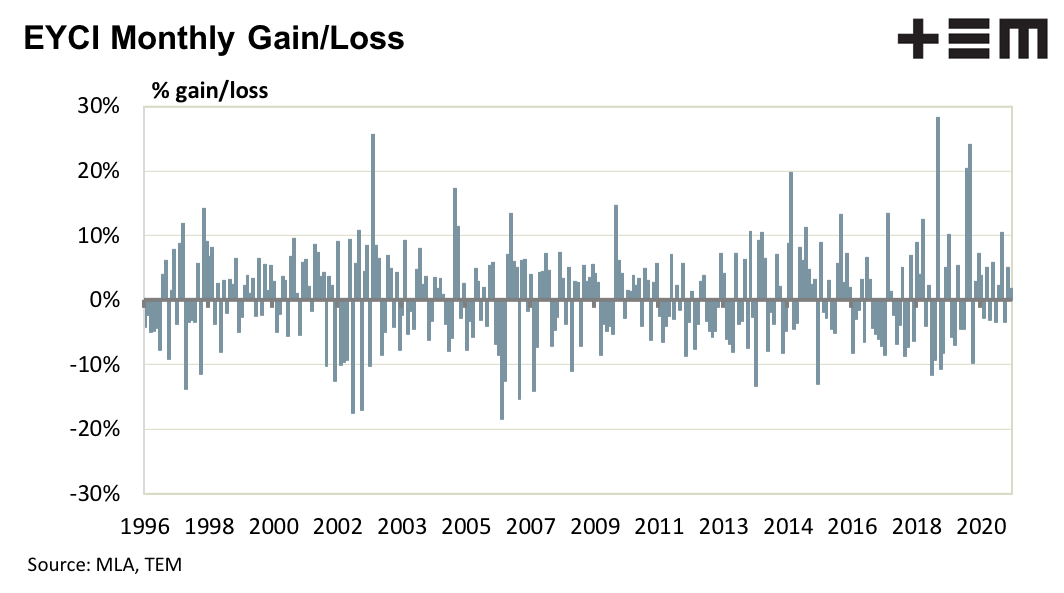
Focusing just on the months where price declines were present we can see that on average declines have been of a 6% magnitude, with a 70% range between 2% decline and 9% decline. This highlights that for 70% of the time since 1996, during a month when the EYCI declined, the fall was between a range of 2-9%, therefore declines of 10% or more could be considered quite abnormal.
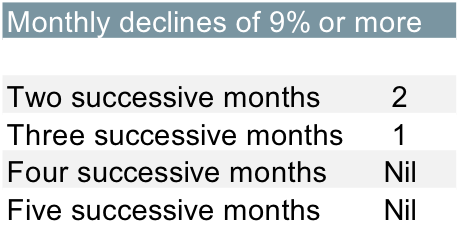
On the question of successive declines, an assessment was undertaken to see how common were abnormal price declines (i.e declines of more than 9% over the month) over two, three, four and five successive months.
Since 1996 to present there has only been two successive two month periods were the EYCI declined by 9% or more. There was only one instance when prices declined by 9% or more that lasted for three successive months and no instances where declines of this magnitude were recorded for four or five successive months.
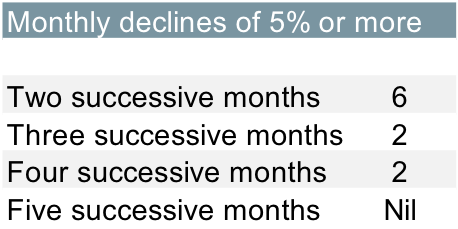
Adjusting the magnitude of the threshold of decline from 9% to 5% indicates that successive monthly price declines become more common, but they are still a fairly low number of instances where this has spanned a number of months.
There have been six times since 1996 where the EYCI declined 5% or more for two consecutive months. Similarly, declines of 5% or more, over three and four months successively have only occurred twice and it has never occurred over five consecutive months.
Indeed, you would have to lower the monthly decline threshold to 4% or more to find a time when prices declined for five consecutive months, and this has happened only once since 1996.
In summary, the suggestion that the EYCI could stage an “orderly decline of 10% for the next four to five months” doesn’t appear to be based on anything backed by data, nor rigid analysis.
It feels more like a back of the envelope arbitrary decision to pick a nice round number, like a 10% decline, and as the historical data shows its a very unlikely scenario to occur.