Are we there yet?

Market Morsel
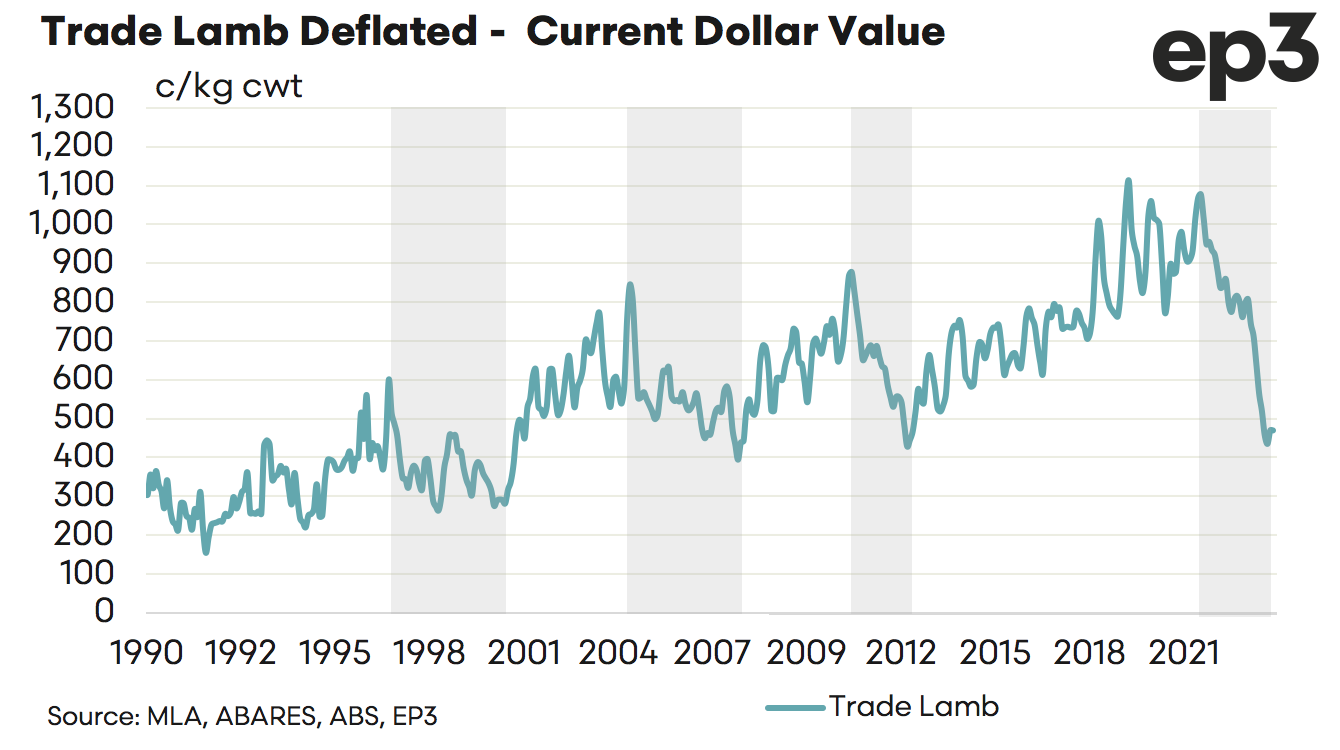
Earlier in the week we took a look at some deflated prices for livestock. The lamb chart showed a pretty good uptrend in pricing from the early 1990s with steady growth in lamb export markets gradually supporting higher and higher sale yard prices.
However, the uptrend wasn’t without its cycles of peaks and troughs. Prior to the current correction in lamb prices there were three other downtrends in the market seen since 1990 (see the grey shaded area on chart below). Two of these periods the lamb price decline lasted around 40 months (April 1997 to October 2000 and July 204 to October 2007) while the other was a good bit shorter at 20 months (March 2011 to November 2012). The current down trend has been in place 24 months.
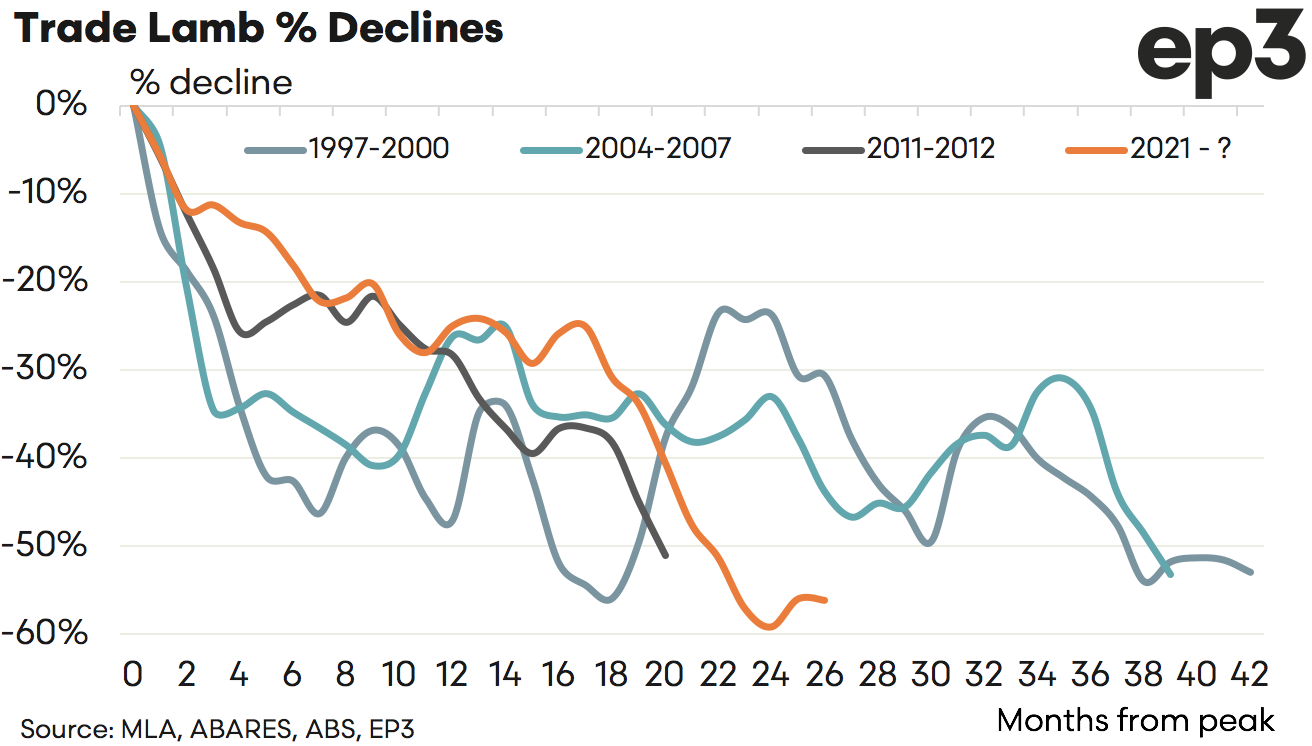
Analysis of the last three downtrends compared to the current price decline in lamb pricing shows that while the timeframe for the correction varied between 20 to 40 months the magnitude of the falls in percentage terms was pretty similar.
The 1997 to 2000 decline saw a 53% price decline over a 42 month period and the 2004 to 2007 decline saw a 53% price drop over a 39 month period. Meanwhile the 2011 to 2012 downturn in lamb pricing saw a 51% drop over a 20 month period.
The current downtrend has seen lamb prices drop by 59%. Personally I think thats enough pain for sheep producers but we are still yet to go through the spring lamb flush for this season. Let’s hope that most of the market correction has already eventuated and any further downward price pressure will be kept to a minimum. During October 2023 the trade lamb market has climbed higher, perhaps the worst of the price correction is over.
Note – percentage price declines have all been calculated using deflated lamb pricing, so that prices from peaks to troughs are adjusted for inflation and reflect current dollar values for lamb.


