
Ch ch ch changes.
The Snapshot
- The EP3 beef processor margin model moves from a $/head calculation to a Beef Processor Profitability Index (BPPI).
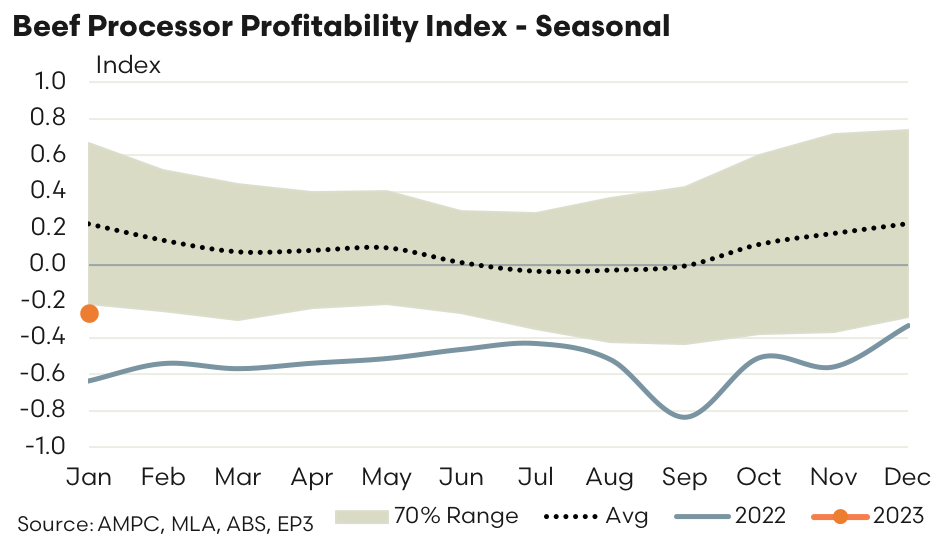
- Since 2000 the monthly BPPI demonstrates a normal historic range between -0.3 to 0.5, with movements outside this range considered to be uncharacteristic of normal trading conditions.
- The last quarter of 2022 saw the BPPI head toward a more normal trading scenario, lifting from -0.84 in September 2022 to -0.33 in December 2022.
- January 2023 has the BPPI opening at -0.26, the best position the index has been in since June 2020.
The Detail
It has been a few months since we covered the theoretical beef processor margin model at Episode3.net. We’ve been a little reticent to publish on it regularly as we often get a swag of queries from people hung up on the absolute dollar per head figure, rather than focusing on the trend in profitability (which we think is more important).
In order to overcome this issue, we have transitioned the model to calculate beef processor profitability as an index rather than an average dollar per head figure. The monthly trend to the Beef Processor Profitability Index (BPPI) since 2000 demonstrates that the final quarter of 2022 saw an improved trading environment for Australian beef processors as the domestic cattle prices eased while beef export values managed to hold ground, or in some export destinations beef values increased.
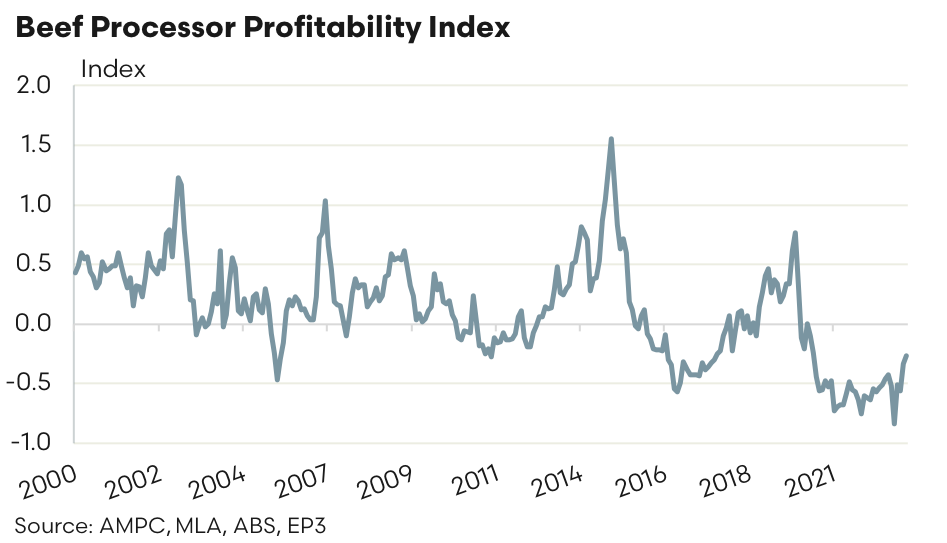
As a rough rule of thumb the BPPI has spent 70% of the time over the last two decades trading between -0.3 to 0.5, which could be considered the “normal state of affairs” for beef processors. From September 2022 to December 2022 the BPPI lifted from -0.84 to -0.33, so the final quarter of 2022 saw the profitability of beef processors nearly back to normal. The seasonality chart shows that January 2023 has the BPPI opening the season at -0.26, and this represents the best position beef processors have been in since June 2020.
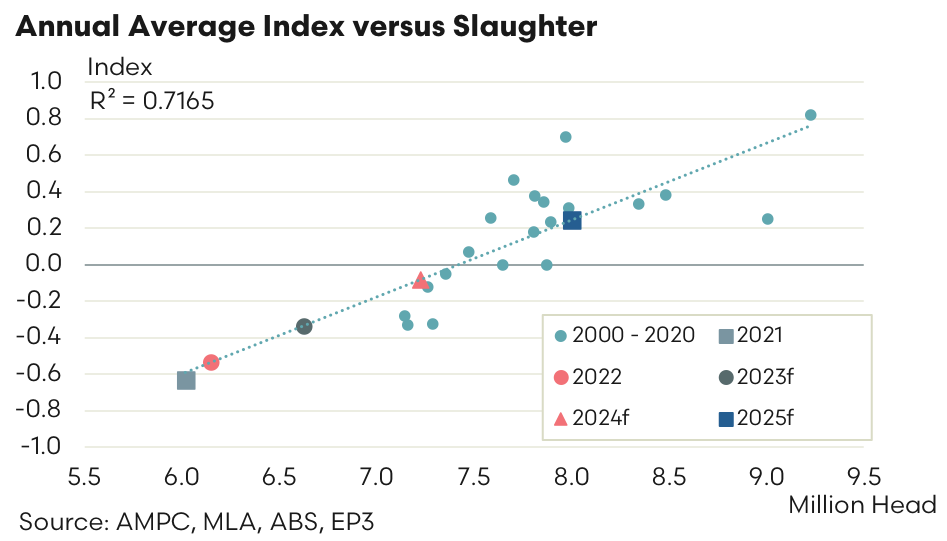
Analysis of the annual average BPPI versus annual Australian cattle slaughter volumes demonstrates that there is a fairly strong correlation between slaughter volumes and processing profitability, with an R-squared measure of 0.7165. Generally speaking, annual slaughter levels nearer to 7.5 million head seems to be the threshold between a positive or negative BPPI.
Meat & Livestock Australia (MLA) are not forecasting annual cattle slaughter to get above 7.5 million head until 2025, according to their most recent beef industry outlook. Annual slaughter of 6.625 million head in 2023 suggests an annual BPPI of -0.34, based upon the line of best fit on the scatter plot below. Increased slaughter volumes into 2024 has the BPPI close to breakeven, while annual slaughter of 8.0 million head into 2025 puts domestic beef processors well and truly back in the black.
Please note this processor index is based upon a theoretical processor margin model and is purely representative of the Australian beef processing sector. A BPPI in negative territory does not suggest that all processors are losing money, similarly a BPPI in positive territory doesn’t suggest that all processors are making money. A more useful reading of the BPPI would be that a negative index suggests a tougher processor trading environment, versus a positive BPPI which is reflective of a more beneficial processor trading environment.