East meats West

Market Morsel
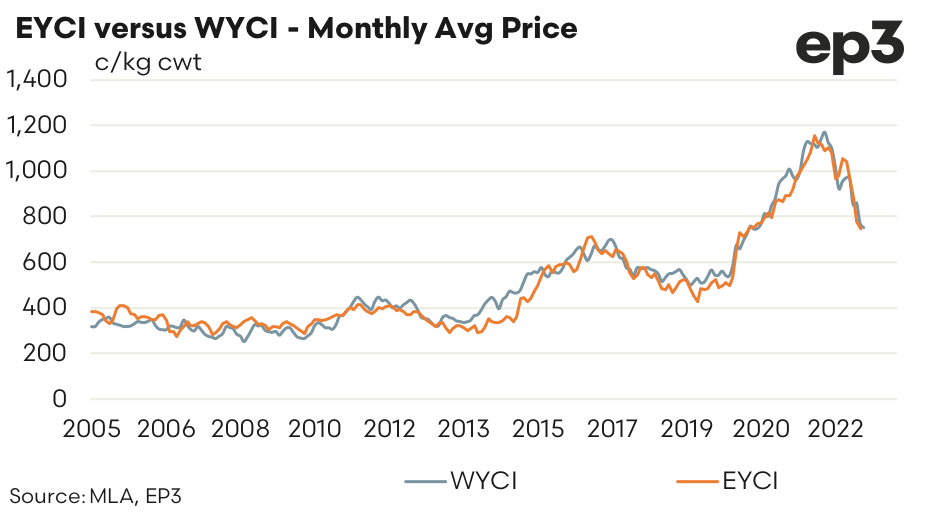
It is an interesting question, “Does the Eastern Young Cattle Indicator (EYCI) and the Western Young Cattle Indicator (WYCI) follow each others price movements”? A glance at the monthly average price chart seems to suggest that they do, over time. However, a closer inspection of the month to month price changes demonstrate that there are reasonable periods of time (in some cases spanning many months) when the two young cattle indicators do not move in tandem.
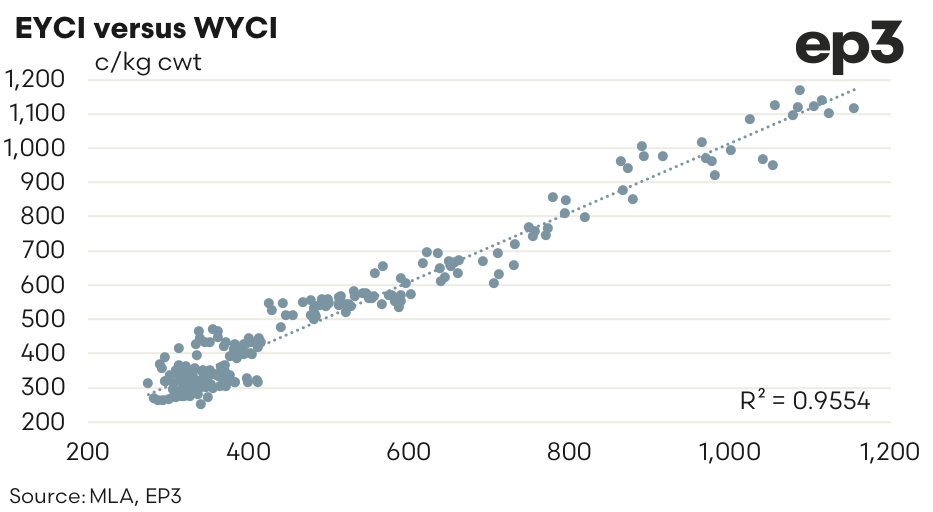
There is a trap for beginners when comparing price indicators to each other using a scatter plot and Pearsons correlation coefficient (also known as the r-squared). Comparisons of nominal prices for commodities that demonstrate a price trend (like the EYCI and WYCI) using a scatter plot and r-squared can sometimes overstate the correlation because these price indicators are “non-stationary”. In simple terms the description “non-stationary” means that there is a trend present and the r-squared calculation is overstated due to the trend following nature of these commodities.
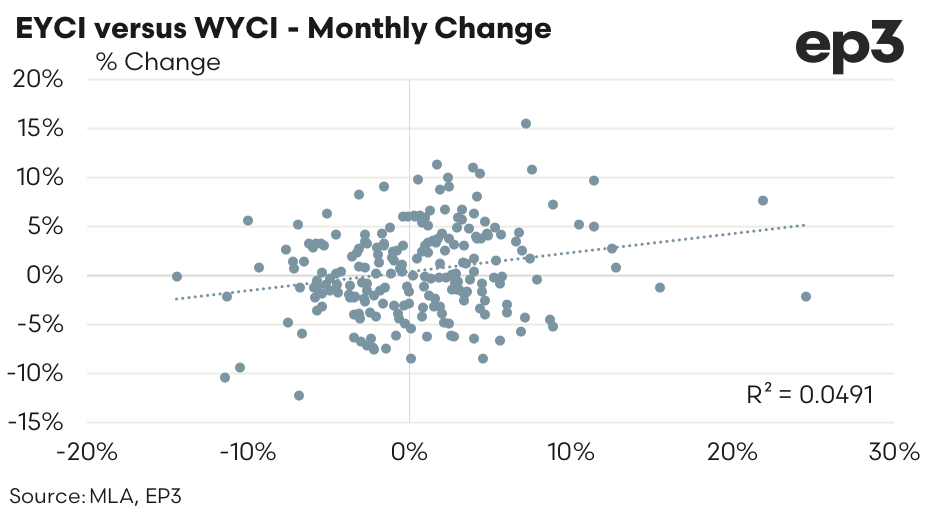
It is far more accurate to measure the change in price over a period in time (for example monthly) to determine if the two commodities being compared actually move in the same direction over the time frame being examined. In the case of the monthly EYCI to WYCI price we can clearly see that the correlation measure based on the price (in c/kg cwt) shows a very high r-squared of 0.9554. However, when we analyse the r-squared based on the monthly price change (in % change terms) we can see that the r-squared measure drops significantly to 0.0491, which suggests that over the month the EYCI and WYCI hardly ever move in the same direction.
This begs the question, “Is there a time lag perhaps between the EYCI and WYCI movements, and if so how long is it”?
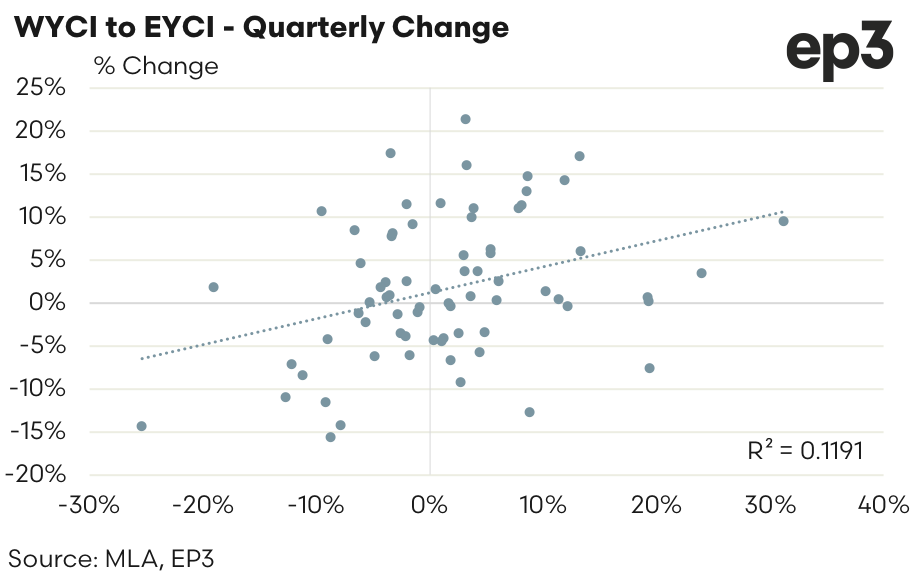
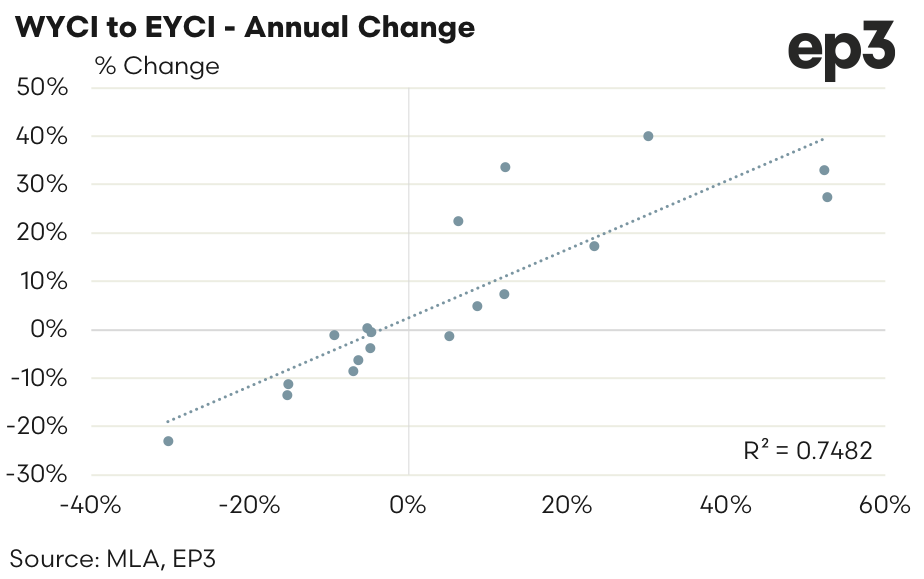
Analysis of the quarterly price change shows that the r-squared doesn’t get much better moving to just 0.1191, which suggest that the EYCI and WYCI price movements still don’t often align even after a 3-month period. Indeed, we have to assess over the whole year before we start to see any consistent correlation score between directional price movements. The r-squared measure when assessing annual price changes between the EYCI and the WYCI of 0.7482 shows that given enough time the young cattle markets on each side of the country eventually come into alignment, in terms of directional price movements.