
Four seasons in one day
The Snapshot
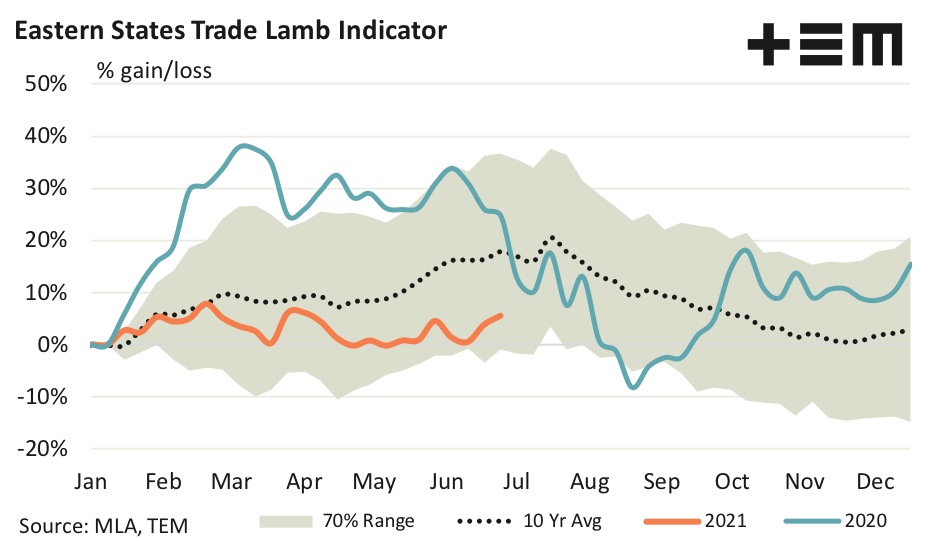
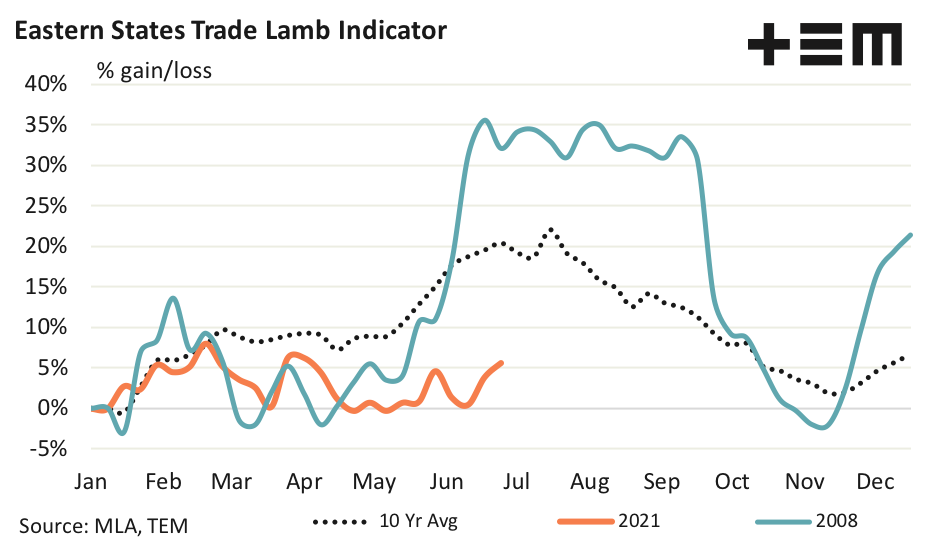
- The ESTLI most often gains through the first half of the season, usually reaching a peak during late Winter around 20% higher than where prices began in January.
- The first quarter of 2021 started in a promising fashion with the ESTLI reaching toward a 10% gain into March. However, since mid-March the 2021 trend has underperformed the ten-year average pattern.
- During 2006 the winter price gains failed to materialise in June, just as we have seen this year. Despite the slow start in 2006 the ESTLI managed to achieve a 17.4% price gain by mid-July.
- Assuming a similar pattern of price gains this season, as seen in 2006, this could take the ESTLI to 945c/kg cwt.
The Detail
It has been a relatively subdued season for the Eastern States Trade Lamb Indicator (ESTLI) thus far. The seasonality of price gains and losses The first quarter of 2021 started in a promising fashion with the trend following the ten-year average pattern reaching toward a 10% gain into March. However, since mid-March the 2021 trend has underperformed the ten-year average pattern.
As the average trend highlights the ESTLI most often gains through the first half of the season, usually reaching a peak during late Winter around 20% higher than where prices began in January. However, each season can be quite different, as the 2020 pattern demonstrates, with price gains or losses exceeding the normal fluctuations that could be expected according to the 70% range boundary and peaking or falling earlier or later than the average trend would predict.
The 70% range highlights where price gains or losses for the ESTLI have varied throughout the season for 70% of the time over the last decade, giving a visual perspective of what could be considered relatively normal price behaviour.
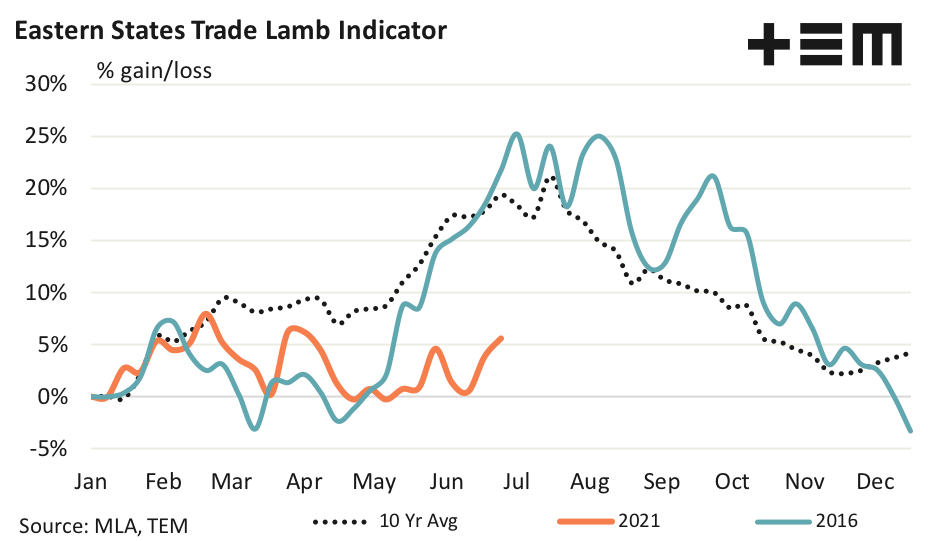
Looking back at price gain or loss seasonality over the last two decades we have picked out four seasons that have shown a level of similarity of pattern with the current year. The most recent season that demonstrated similar gains and losses to 2021 was the 2016 season. Indeed, up until May the timing of price rises and falls, including their magnitude, had been relatively similar.
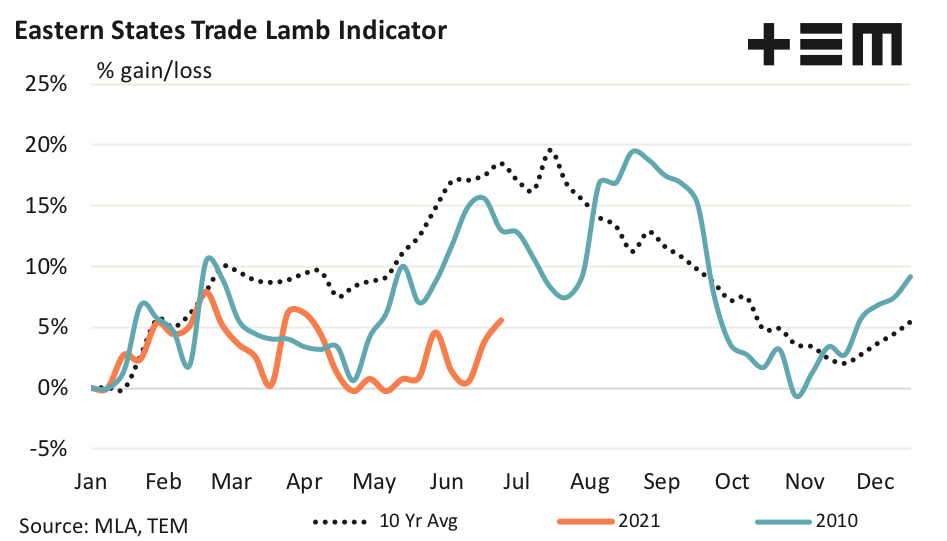
However, throughout June the similarity has begun to diverge with the current year’s pattern not keeping pace with the strong gains seen during June of 2016. The 2010 and 2008 seasons also showed remarkable similarity to 2021, until May. Again, the strong gains in the ESTLI often seen in June saw the seasonality patterns begin to diverge.
The 2016, 2010 and 2008 seasons managed to see winter price peaks in the ESTLI 20% to 35% higher than where the indicator started the year in January. These are price gain magnitudes consistent with the levels that could be expected based on the ten-year average pattern and the upper boundary of the 70% range which shows that price increases between 20% to 35% are not uncommon during the July to August period.
The fourth and final seasonal comparison highlights the close gain/loss relationship shared with the 2006 and 2021 pattern, which is yet to deviate. During 2006 the winter price gains failed to materialise in June, just as we have seen this year. Despite the slow start to the seasonal winter peak in 2006 the ESTLI managed to get close to the 20% gain region, achieving a 17.4% price gain by mid-July.
Assuming a similar pattern of price gains this season, as seen in 2006, this could take the ESTLI to 945c/kg cwt based on the 806c/kg level that we started 2021. While producers will likely welcome the trend similarity between 2021 and 2006 staying intact until August they are probably not as keen to see the same magnitude of price loss seen during the spring flush of 2006 this year.
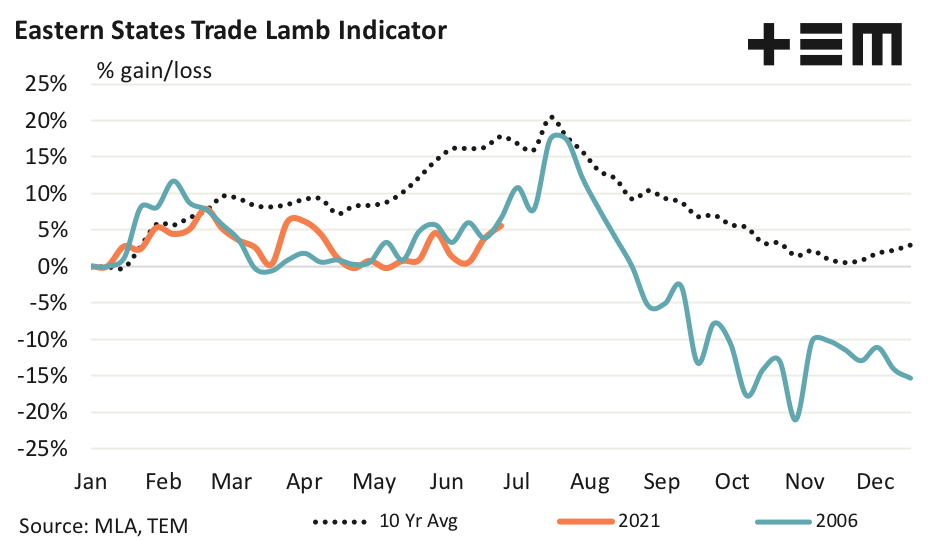
By November 2006 the ESTLI had given away all of the previous months gains and had dipped 20% under the levels set in January. A similar magnitude fall this year would take the ESTLI back towards the 650c/kg region.
Before we start ringing the panic bell it would be remiss not to remind the reader that a 20% fall during spring in the ESTLI is beyond the 70% range that is usually seen and therefore less common. As the 70% boundary demonstrates it is more likely to see falls back nearer to where the season began or 10% to 15% below the January price. This would suggest a maximum spring low between 685c/kg, at worst, or nearer to 750c/kg cwt, at best.