Its the vibe
Market Morsel
We have been working on some more simple ways of demonstrating current saleyard throughput volumes, relevant to historical levels and have settled on looking at average weekly saleyard throughput over the last four weeks, then expressing that as a percentile index based upon the last five years of throughput data. We hope that this gives a quick snapshot of how saleyards across the states are sitting in terms of livestock volumes being yarded.
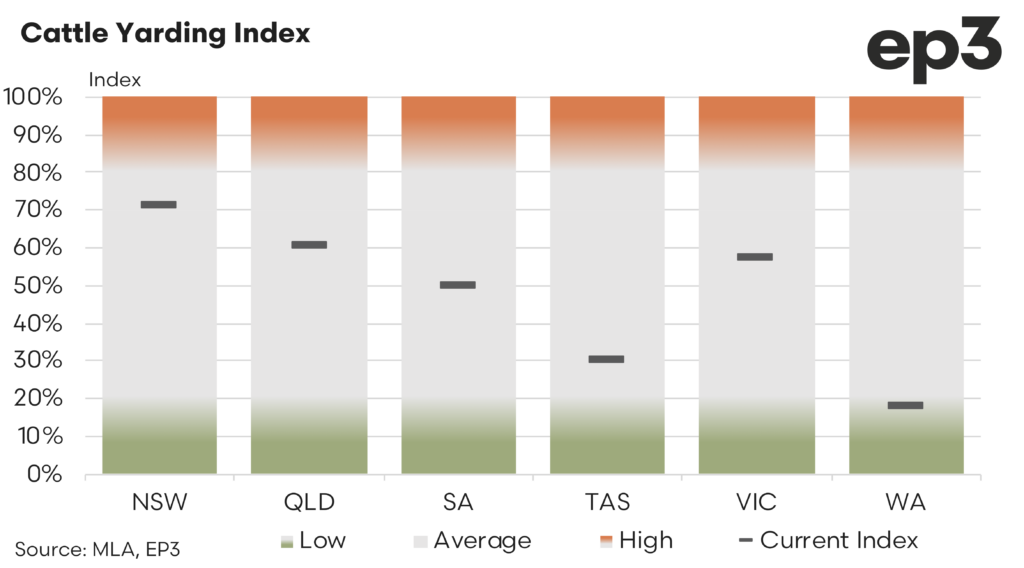
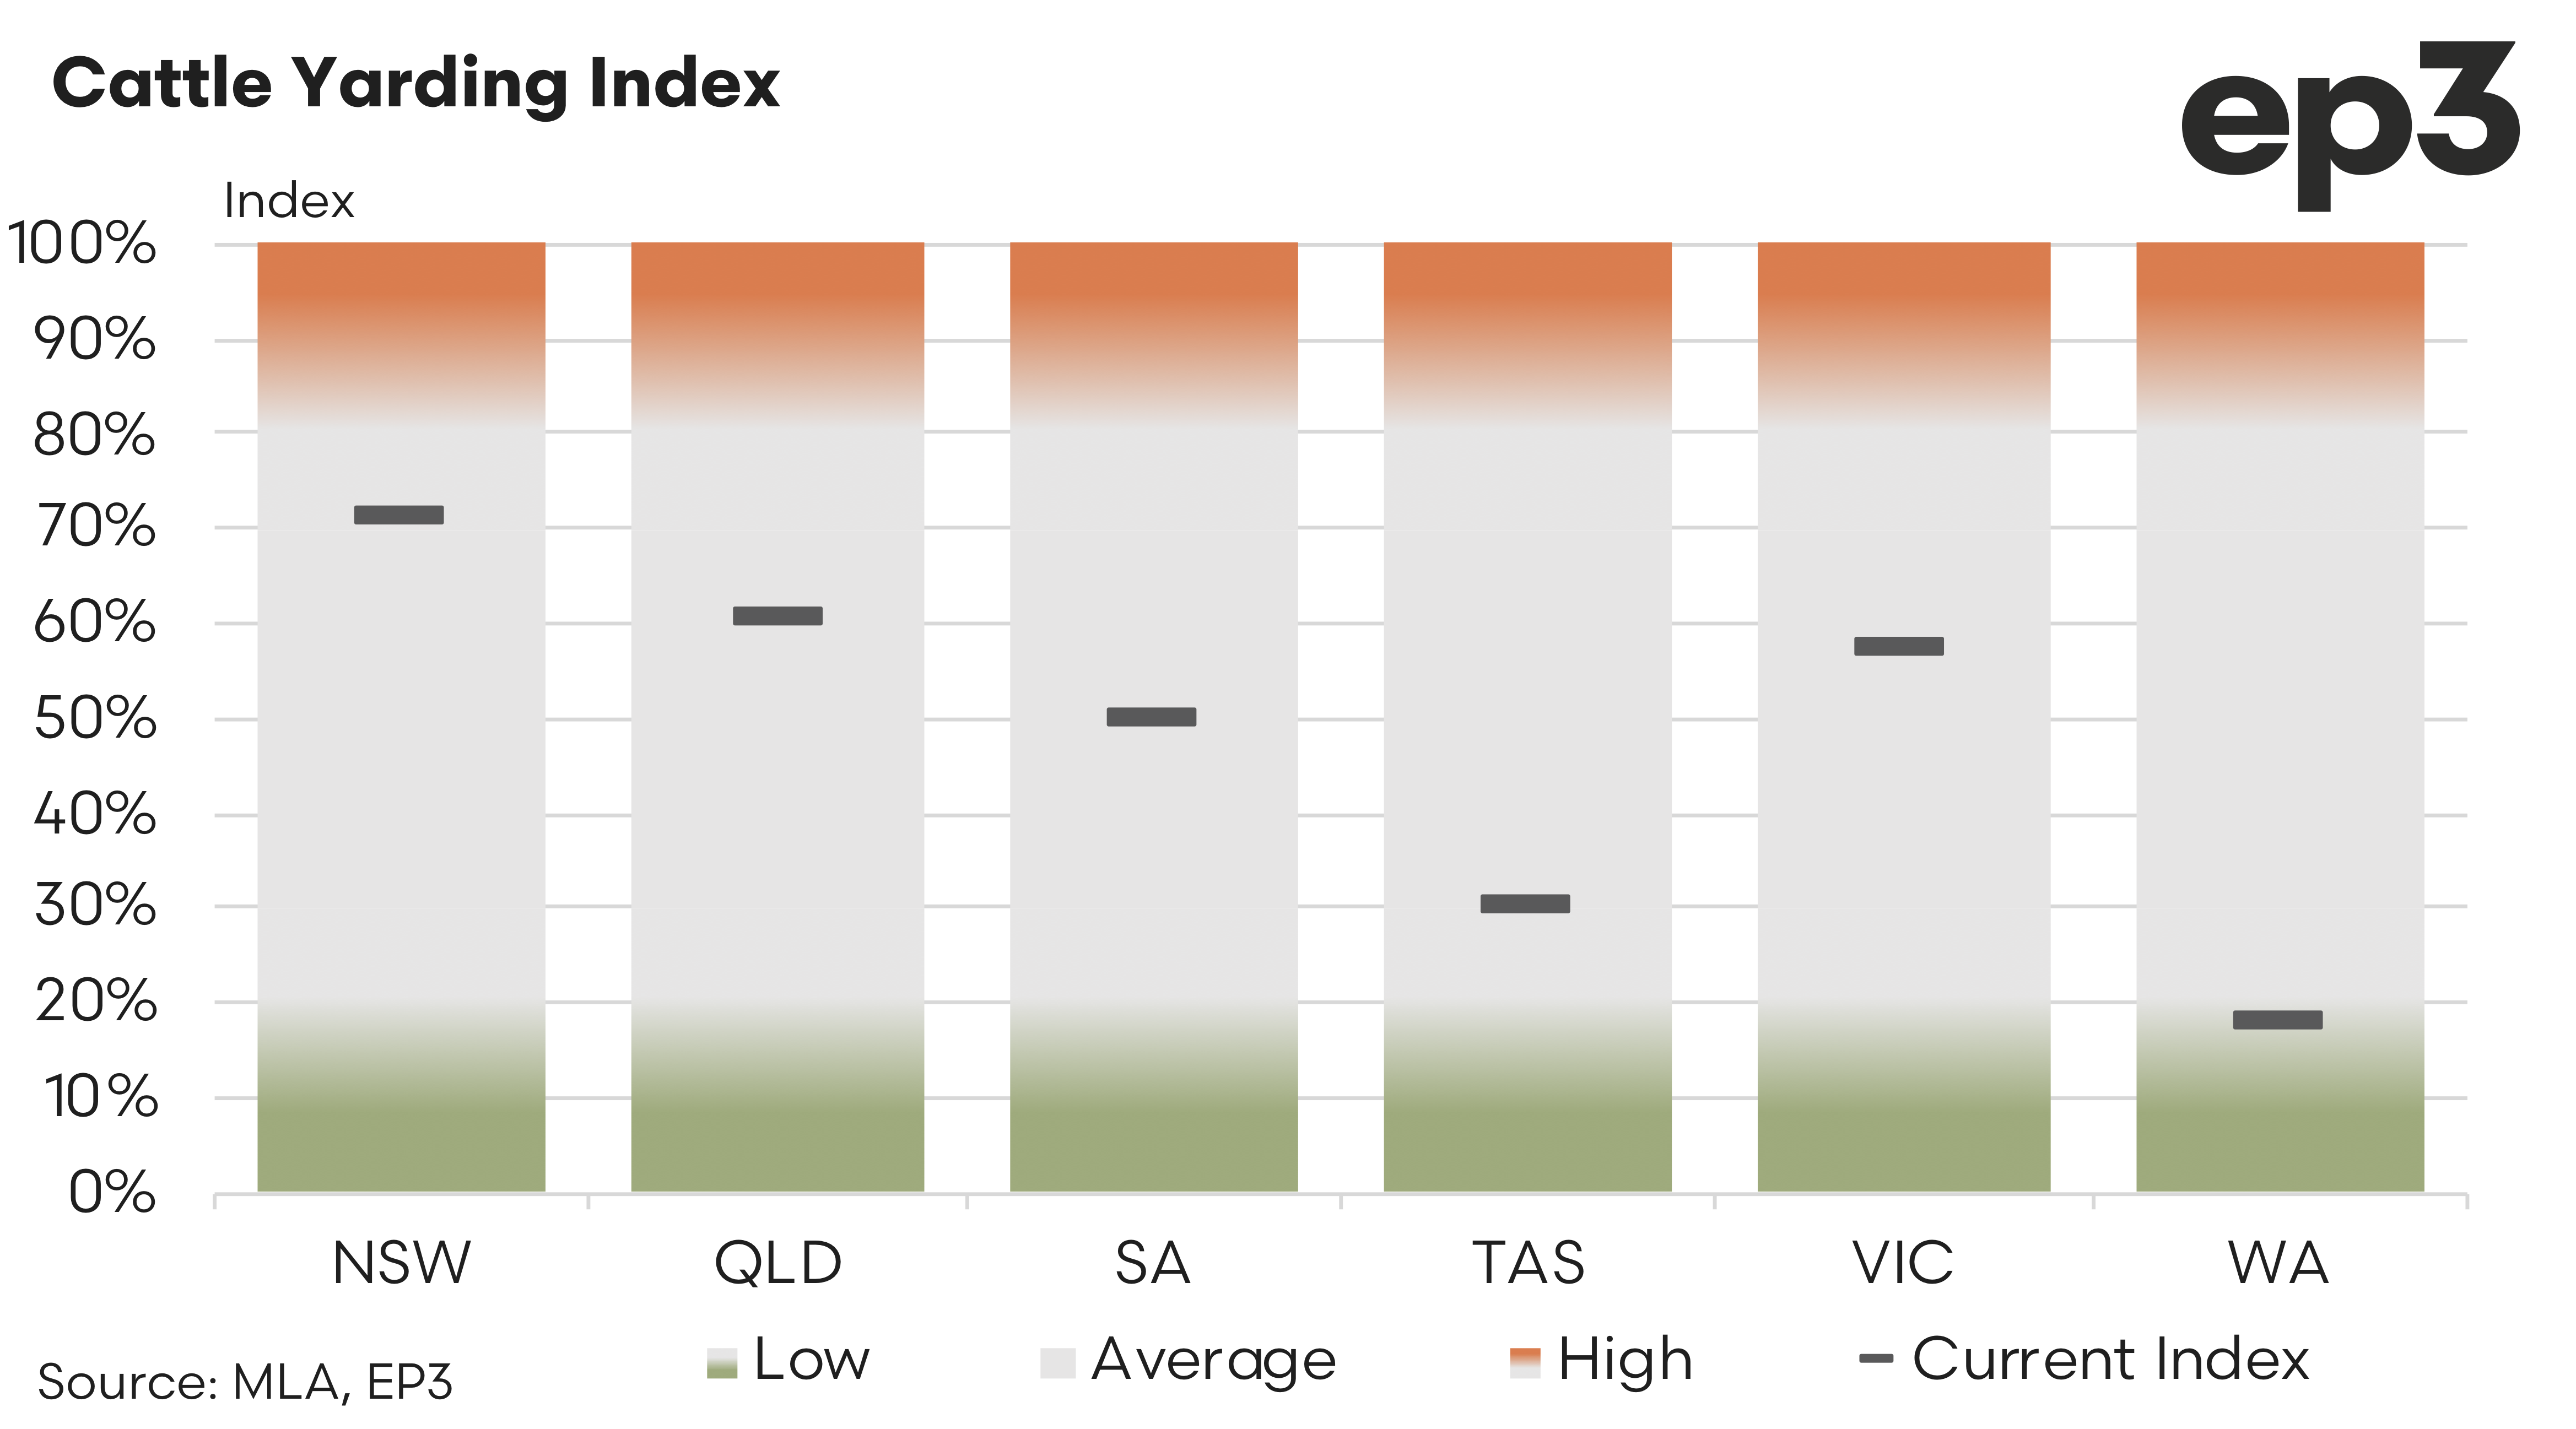
Starting with cattle the data shows NSW saleyards are the tightest sitting at around 71% of historical throughput. Victorian and Queensland yards are sitting either side of 60%. South Australian cattle throughput is fence sitting at 50%, meanwhile Tasmanian cattle yarding levels are close to a third of historic volumes. Sale yard throughput of cattle in WA is the lowest index of all the states sitting at just 18%.
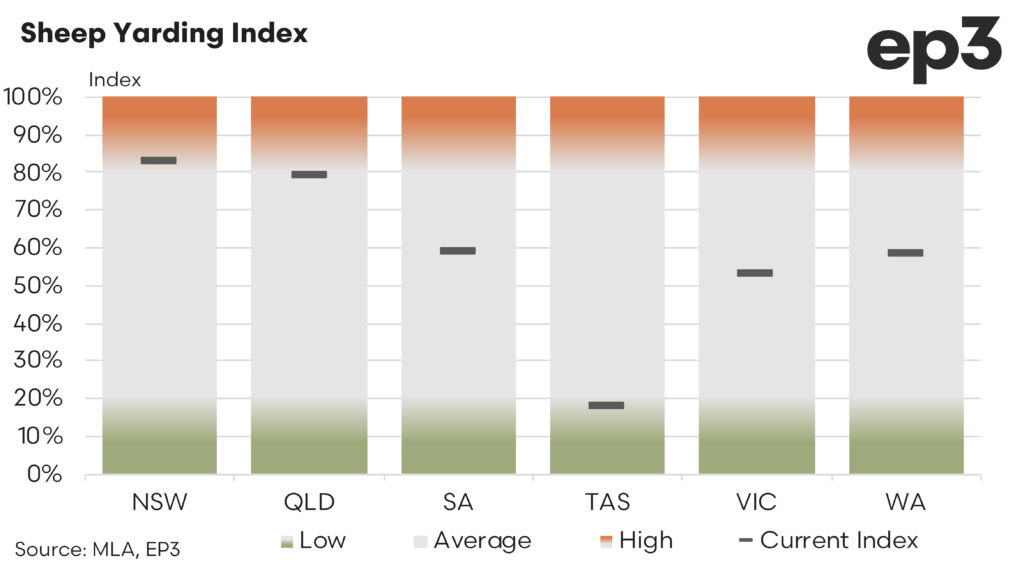
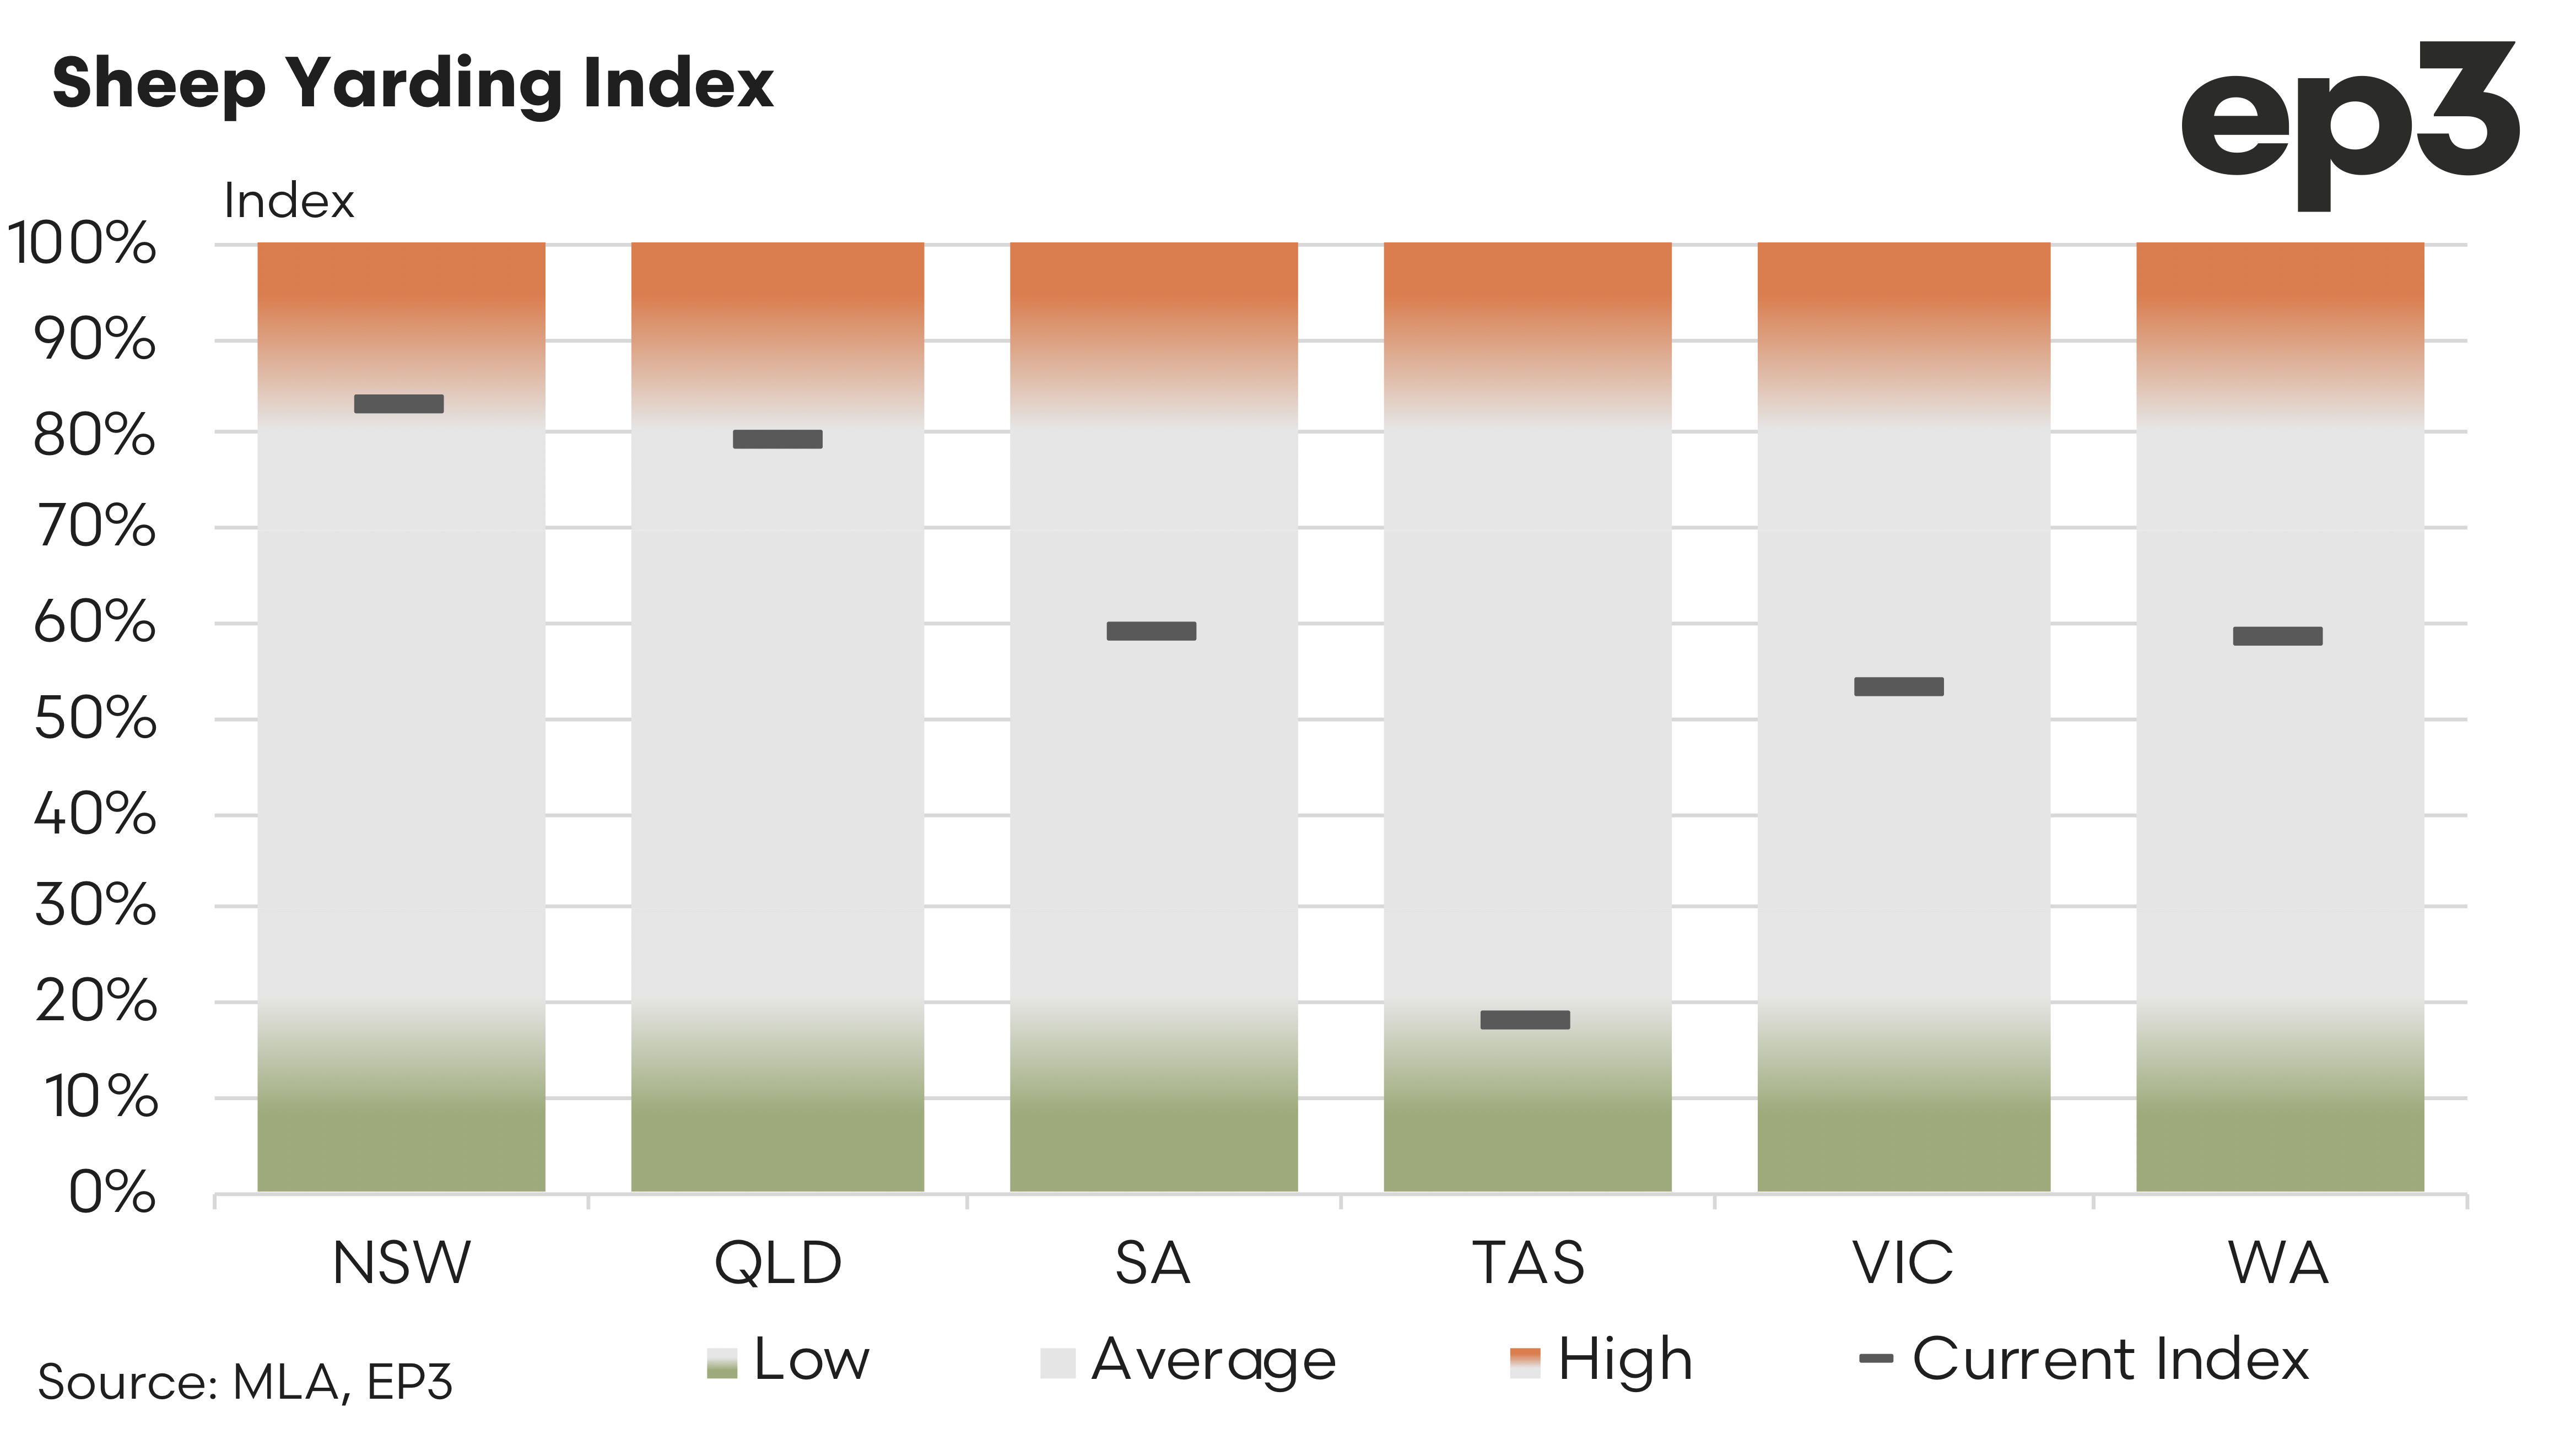
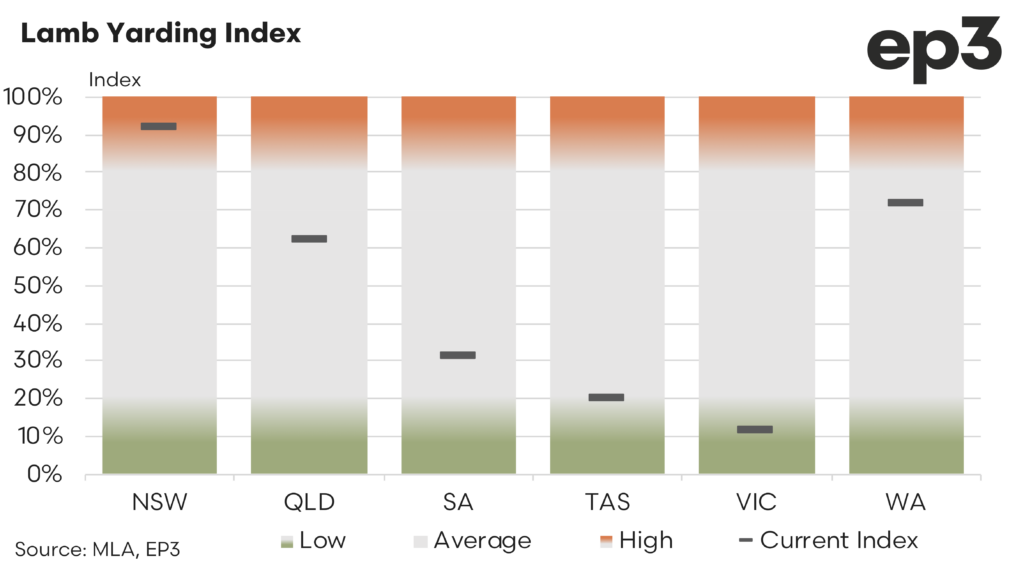
Space is starting to feel a little tight across NSW sale yards for sheep throughput volumes with an index ranking of 83%, but lamb throughput levels in NSW are running even stronger with an index score of 92%. South Australia and WA have reasonably firm sheep yarding levels both nearer to 60%. However, SA spring lamb numbers are yet to present in a strong manner with a percentile rank of just 31%. In contrast WA lamb yarding is much firmer sitting at 72%.
Tasmanian sheep and lamb yarding levels are both relatively low, on 18% and 20%, respectively. Meanwhile Victoria is a bit of a contrasted picture with sheep yardings relatively moderate at 53% and lamb throughput yet to recover from the winter lull in supply with an index of just 12%.

