Market Morsel: Flush comparison
Market Morsel
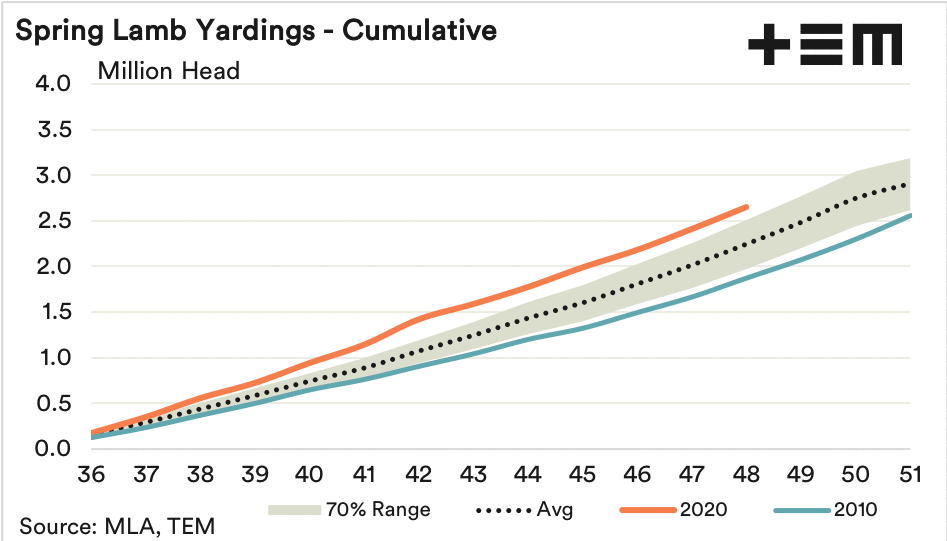
The cumulative weekly east coast lamb yarding levels from the start of spring (week 36) are running ahead of the ten-year average trend and above levels that could be considered normal, based on the 70% range boundary. The GIF image below scrolls through the spring flush season, comparing 2020 to each season from 2010 onwards to allow a visual comparison over the last decade of spring lamb throughput.
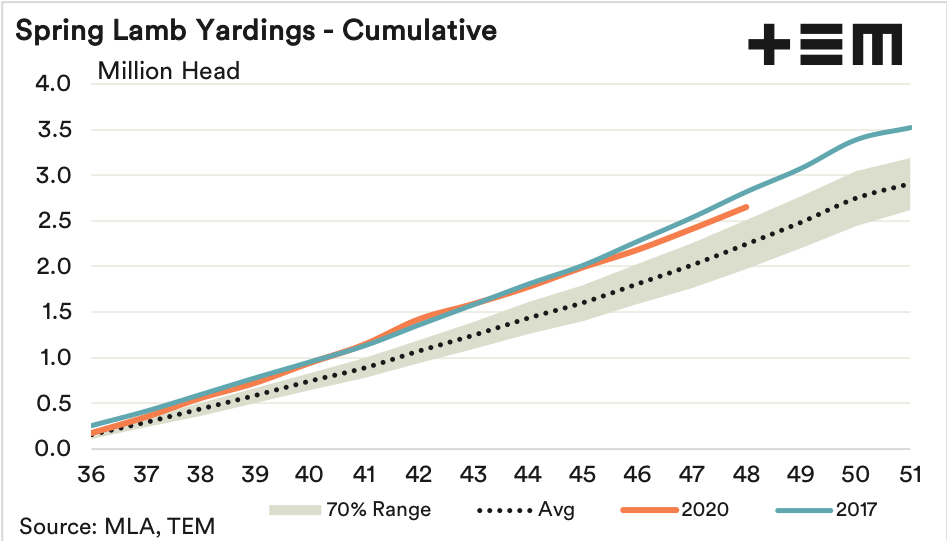
Analysis of the last decade shows that the current pattern of the flush is most similar to the 2017 season, running well ahead of the average trend. Although in recent weeks the lamb volumes presented at the saleyard have started to creep lower than the 2017 pattern.
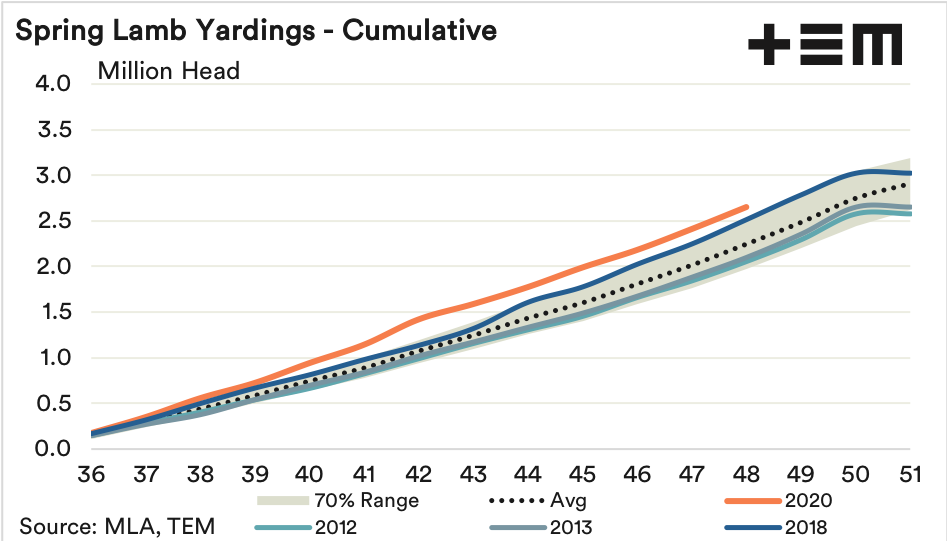
Based on the cumulative pattern set in previous years there is likely to be another 550,000 to 600,000 head of lamb still to come for the remainder of the 2020 season, bringing the total number of lambs yarded on the east coast since the start of September to close to 3.2 million head. Unless we see a year like 2012, 2013 or 2018 when the December lamb yarding numbers eased toward the year end.