Market Morsel: Just go with the flow, dude!
Market Morsel
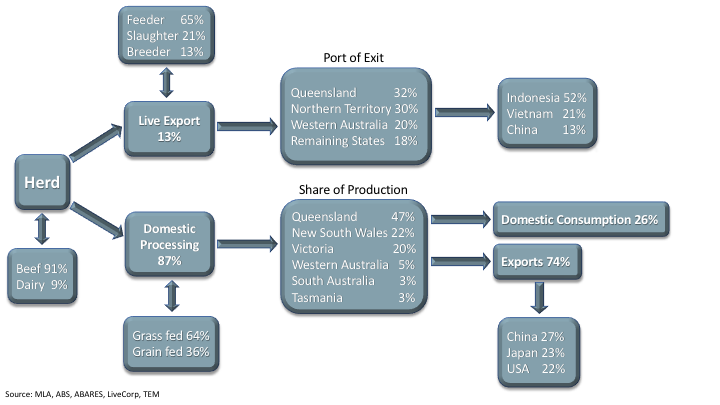
The beef industry trade diagram below outlines the flow of beef product across the Australian industry for the 2019 season and identifies key segments of the supply chain, including their relative proportions to each other.
The Australian cattle herd was estimated at 24.7 million head in 2019, 91% of the herd is classified as beef cattle while 9% is determined to be dairy cattle. Domestic adult cattle slaughter in 2019 was calculated at 8.5 million head representing 87% of annual cattle turnoff. The remaining annual cattle turnoff is directed to the live cattle export sector, representing 13% in 2019, or 1.3 million head.
Total Australian live cattle exports consist of 65% feeder cattle, 21% slaughter cattle and 13% breeding stock. In 2019, 32% of the live cattle that exited Australia did so by ports based in Queensland. Ports in the Northern Territory represented 30% of live cattle consigned, while Western Australian ports saw 20% of live cattle turned off pass through their system. Indonesia was the primary destination for Australian live cattle exports in 2019 representing 52% of the total volumes, followed by Vietnam at 21%.
In terms of annual domestic cattle processing volumes, 64% is considered grass-fed while 36% has spent time in a feedlot. Queensland holds the largest share of processing volumes with 47% of the total national cattle slaughter occurring within this state. New South Wales and Victoria processed 22% and 20% of cattle slaughtered in 2019, respectively.
Total Australian beef exports in 2019 represented 74% of the annual cattle production (approximately 1.8 million tonnes carcass weight), with the balance of 26% consumed domestically. China was the top destination for Australian beef product in 2019 at 27% of beef export volume market share, followed by Japan at 23%.