Market Morsel: Real value of lamb and mutton

Market Morsel
Earlier today we ran the deflator over cattle prices, converting nominal prices over the last six decades into 2022 dollar values. This short update provides the same inflation adjusted historic pricing for the Eastern States Trade Lamb Indicator (ESTLI) and East Coast Mutton.
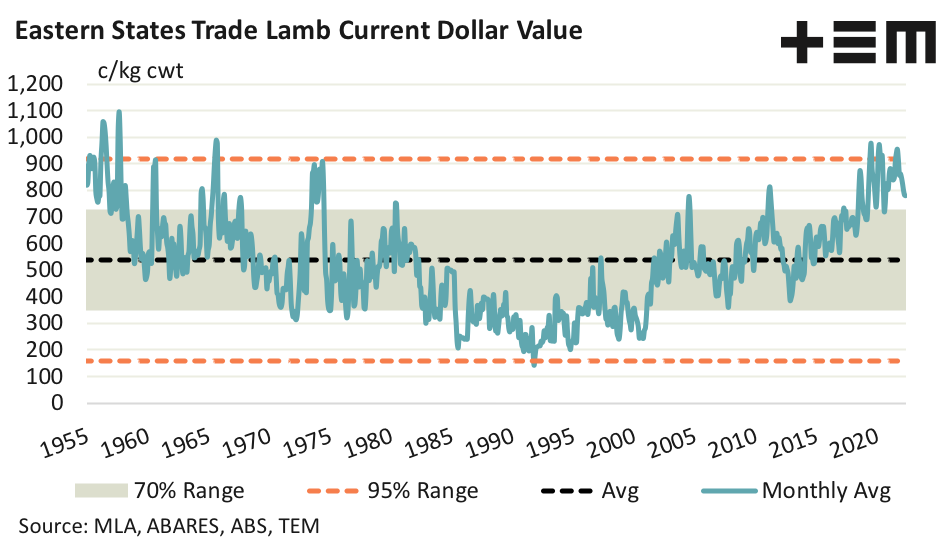
The recent peak in deflated terms for the ESTLI was in July 2019 at 977c/kg cwt (in 2022 dollar values), but you would have to go back to August 1957 to have witnessed the all time deflated peak, when the ESTLI hit 1097c/kg cwt in current dollar values. At present the ESTLI is sitting at 775c/kg cwt, nearly 21 % lower than the recent peak and 29% under the 1957 record.
Historic deflated price analysis shows that the long-term average level for the ESTLI has been 538 c/kg cwt and the indicator has spent 70% of the time, since 1955, between 348c/kg to 728c/kg cwt. Price movements below 160c/kg or above 920 c/kg would be considered extreme, with just 5% of historic price fluctuations occurring outside of this range.
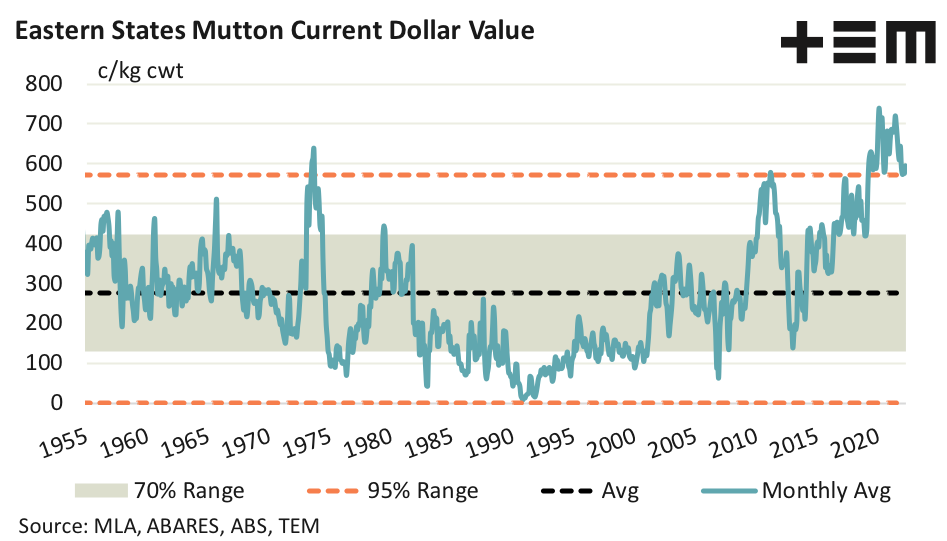
The all time inflation adjusted peak for East Coast Mutton occurred much more recently. Indeed, on a deflated basis, it was in March 2020 when the mutton indicator hit 738c/kg cwt in 2022 dollar values. Currently the East Coast Mutton indicator is 590c/kg cwt, which is outside of the extreme range. Historic deflated mutton price movements above 572c/kg cwt have only occurred 5% of the time, since 1955.
The long-term deflated average for East Coast Mutton sits at 276c/kg cwt, in 2022 dollar values. Meanwhile, the 70% range for mutton is between 130c/kg to 425c/kg cwt. Current mutton pricing seems a long way away from the normal range, as outlined by the 70% region. It begs the question if the growing offshore demand for mutton, particularly from China, could be pushing mutton pricing towards a “new normal”.


