May you live in interesting times

The Snapshot
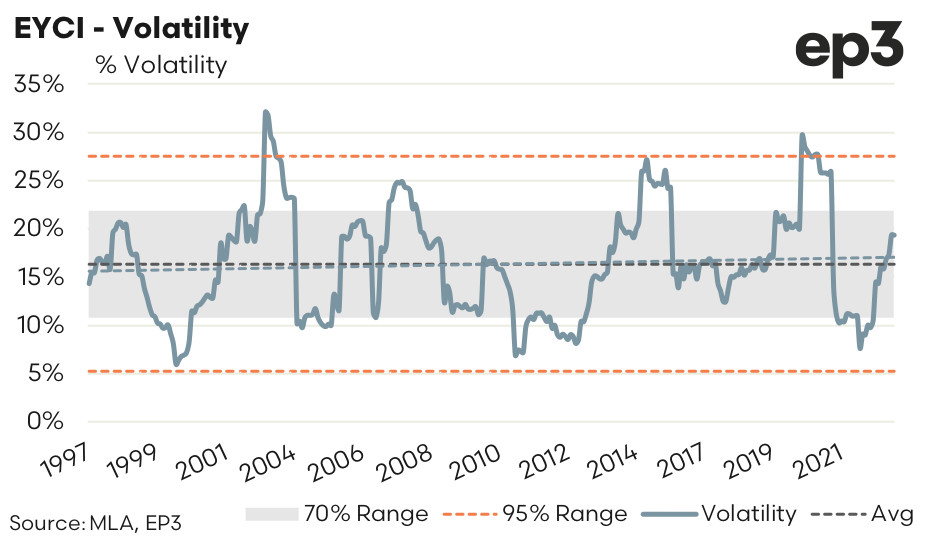
- EYCI volatility usually ranges between 11% to 22%, and has averaged a reasonably stable long term volatility measure of around 16% since 1997.
- Volatility below 5% or above 27% would be considered extreme and occurs relatively rarely.
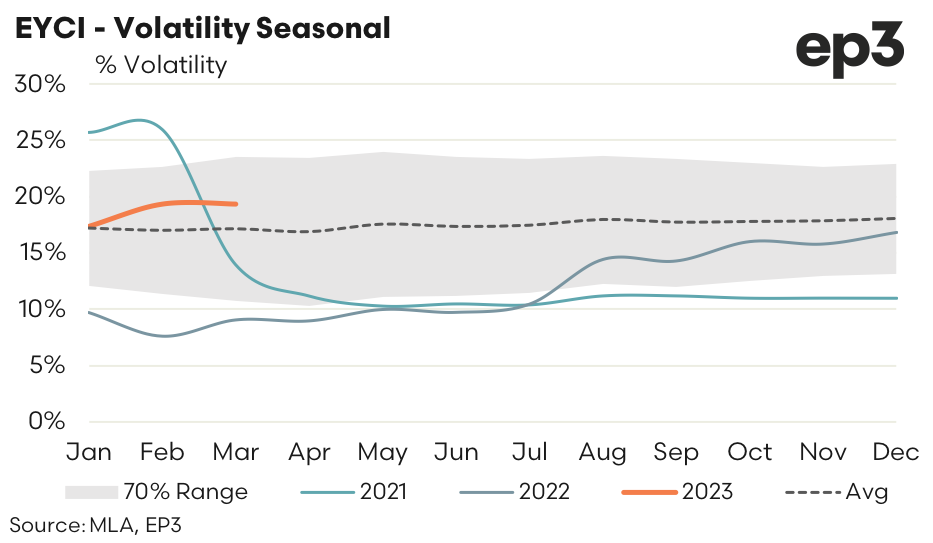
- Seasonal volatility patterns do not suggest particular months or times in the year are often more/or less volatile than others, over the long term.
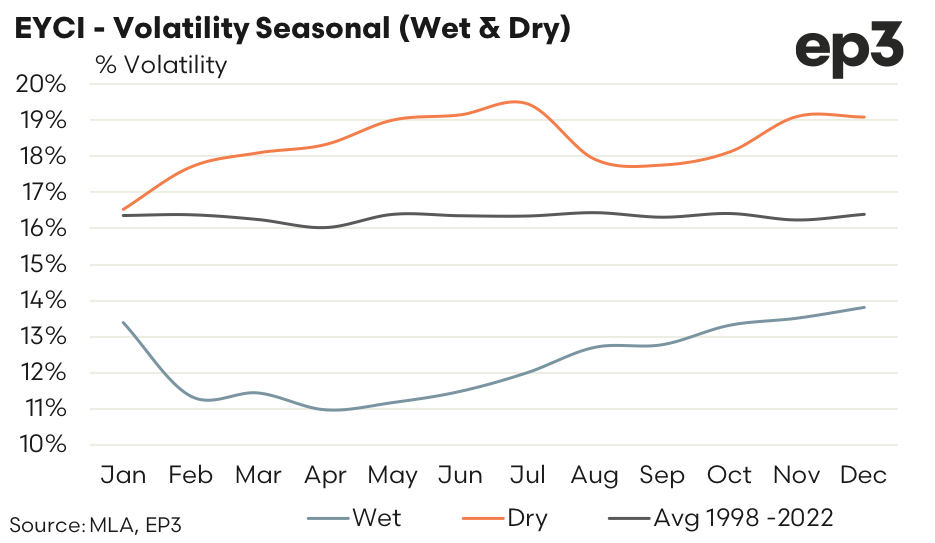
- Years that have experienced lower than normal rainfall tend to be more volatile than years that have experienced wetter than average conditions.
The Detail
Are young cattle prices more volatile these days? We were asked that question recently by a subscriber and agreed it was worthy of investigation. Market price volatility refers to how much variation there is in price over a specified period in time. If the price of a commodity fluctuates rapidly in a short period, hitting new highs and lows, it is said to have high volatility. Conversely, if the commodity price moves higher or lower more slowly, or stays relatively stable, it is said to have low volatility.
Analysis of the monthly price change for the Eastern Young Cattle Indicator (EYCI) annualised into a rolling measure of percentage volatility demonstrates that since 1997 the volatility calculation has ranged between 5% and 30%. The long term average volatility sits at 16% (as demonstrated by the black dotted line) and the trend in volatility shows an almost negligible increase in volatility has been seen over the last 25 years (as shown by the grey dotted line).
Statistical measurement of the EYCI volatility over time highlights that the “normal” range in volatility is between 11% to 22%, as outlined by the grey shaded 70% range boundary. Meanwhile, movements in volatility below 5% or above 27% are considered relatively rare, occurring just 5% of the time since 1997 and indicated by the boundary of the two orange dotted lines.
An assessment of the seasonal pattern in EYCI volatility shows that there is limited discernible trend in price variation over the year, on average and the relatively static width of the grey shaded 70% range over the season. This suggests that higher or lower periods of volatility do not tend to occur regularly at particular times in the year.
That isn’t to say that these periods of higher or lower times of volatility don’t exist at all. As the early part of 2021 and 2022 demonstrate when EYCI volatility began the year higher and lower than the historic “normal” range would have suggested, respectively.
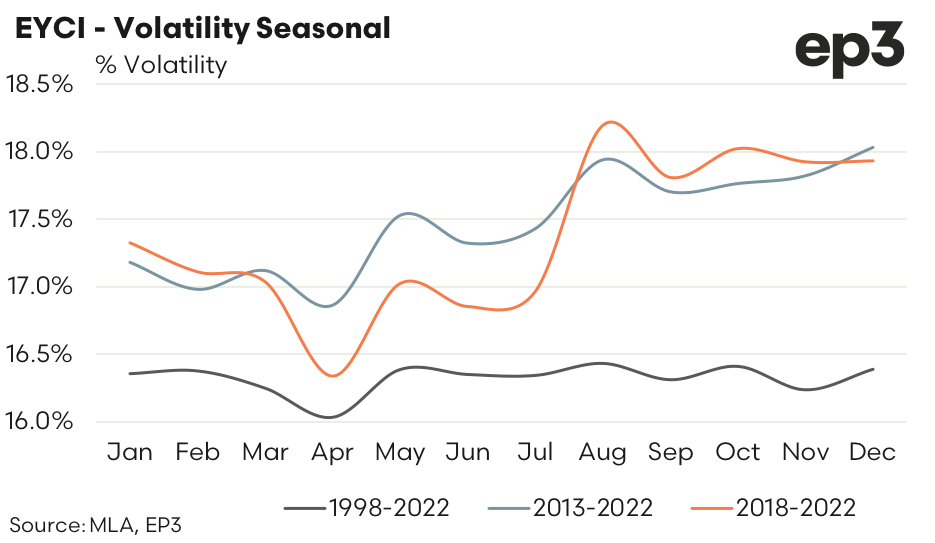
Filtering the volatility data into average seasonal trend patterns for the last five years, the last ten years and the last 25 years shows that there has been a slight increase to volatility levels in recent years by around 1-2 percentage points, with the second half of the season more commonly demonstrating higher levels of volatility than the first half of the year. Meanwhile, April appears to be relatively consistent as the month most likely to have low levels of volatility present for the EYCI.
Interestingly, filtering the volatility data into years that are wetter than normal versus years that are drier than normal shows that dry years are likely to be more volatile, around 2-3 percentage points higher than the average historic volatility levels. Meanwhile, wetter years tend to be around 3-5 percentage points less volatile than the average pattern.


