Off their highs

Market Morsel
We have reported regularly on beef processor profitability since the inception of EP3 (including under its former name, TEM). Several times we have had to tinker and adjust the beef processor model as new data is made available and as old data is no longer accessible. The model has undergone a fresh overhaul in recent weeks and it is now termed the Beef Processor Trading Conditions Index (BPTC).
The earlier beef processor margin model we utilised on the EP3 website was created using similar data and methodology to the Australian Meat Processor Corporation (AMPC) theoretical beef processor margin model, which was created by AMPC (with input from our analysts) back in late 2018.
In essence the AMPC model utilised a selection of data inputs on cattle pricing, beef export receipts, co-product revenues and processing costs to create an industry representative indicator of beef processor profitability that could be calculated each month to determine how current trading conditions were for the sector. However, the AMPC model was only created for an industry report, measuring processor profitability trends from 2007 to 2018, so the ongoing upkeep of the model and reporting of beef processor trading conditions was not continued.
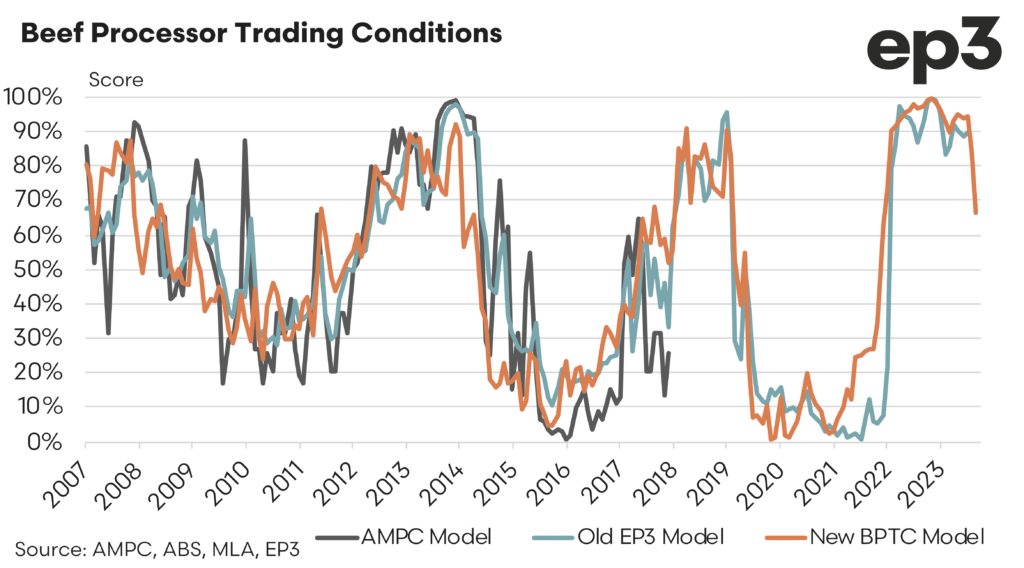
The chart below shows the output of the AMPC model versus the output of the newly created BPTC index and the older version of the EP3 beef processor margin model. As is clearly evident, while the outputs are different they all share a similar directional trend over time.
In order to compare the three models easily I have displayed their respective outputs as a percentile ranking chart which tracks the monthly changes to beef processing trading conditions and ranks the current conditions based on the historic variation in trading conditions. In this way it is similar to rainfall deciles used by the Bureau of Meteorology that help explain how much or how little rain has fallen, based upon the historic records.
The rainfall decile system in Australia ranks historical rainfall from 1 to 10 to show how much it rained compared to the past. A decile of 1 means the rainfall is among the lowest 10%, indicating very dry conditions, while a decile of 10 means it’s among the highest 10%, indicating very wet conditions.
In a similar fashion the percentile chart displayed for the three processor models ranks the processor profitability against the historic variation in profit according to each model and shows how the current trading conditions are performing. For example, a percentile score between 0% to 10% indicates the lowest 10% of records and is consistent with very tough trading conditions for the beef processing sector. Alternatively, a score between 90% to 100% represents the top 10% most profitable times for beef processors and is reflective of very favourable trading conditions.
In the last quarter of 2023 Australian beef farmers saw cattle prices weaken significantly as fear of a return to dry conditions gripped the market. While this was a difficult time for beef producers it provided some very favourable buying opportunities for the nation’s processors. An additional boost to processor’s bottom line at this time too was a booming international beef market. Strong offshore demand for beef and a huge herd liquidation in the USA supported global beef export prices for meat product and for the various co-products sold by beef abattoirs as they extract full value from the processed animal carcass. Given these very favourable conditions it is rather unsurprising to see that during late 2023 and early 2024 the BPTC index was sitting within the 90% to 100% range. However, in recent months the situation has weakened somewhat for the nations processing sector.
Since June 2024 there has been a solid recovery in Australian cattle prices, with the National Heavy Steer lifting by around 18% and the National Processor Cow Index up by nearly 38%. While this is good news for cattle farmers it means higher input costs for processors. Meanwhile, over the same timeframe beef export pricing in some key markets for Australia has eased with Japanese prices down by 1.1% and South Korean prices off by 4.9%. Additionally, some co-product categories have seen price declines ranging from 2% to 6%.
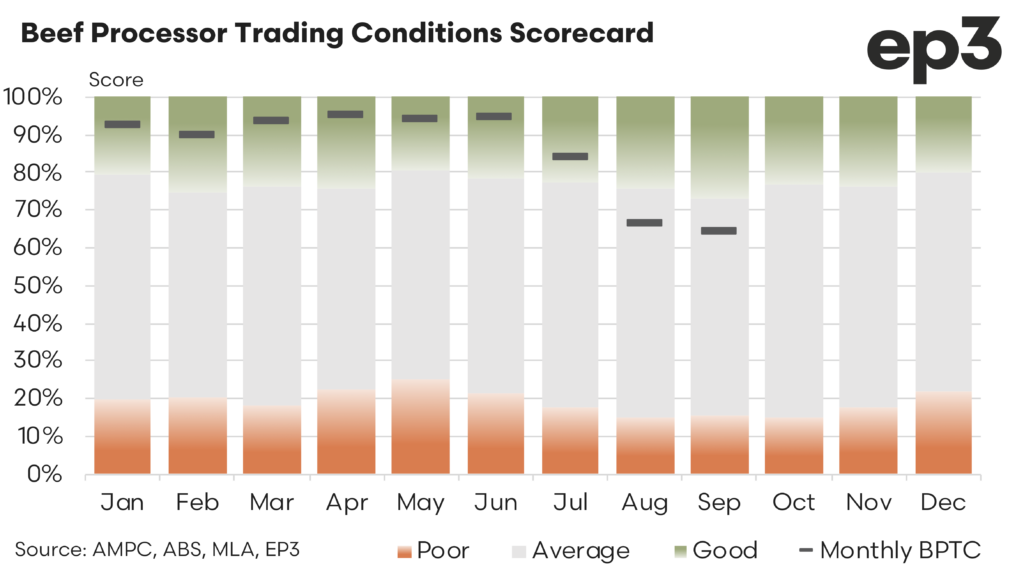
These lower beef export prices and softer co-product pricing has meant reduced earnings for beef processors and when combined with the higher cattle input costs have seen the BPTC index trend downwards recently. Currently, the BPTC score sits at 64%, which means that current profitability for the nation’s beef processors is higher than 64% of the historic monthly records back to 2007. But there are still 36% of the historic records where trading conditions have been more favourable.
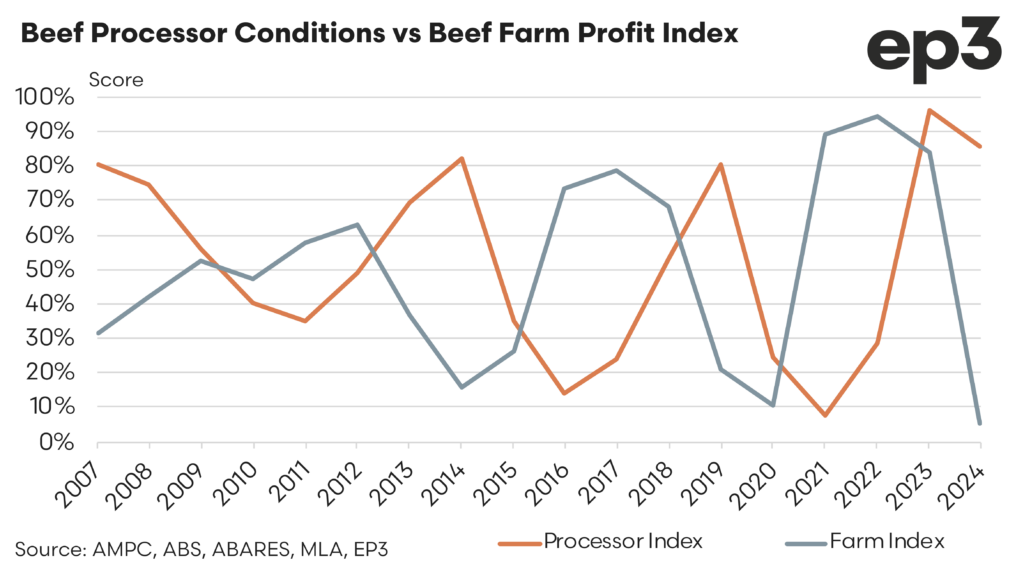
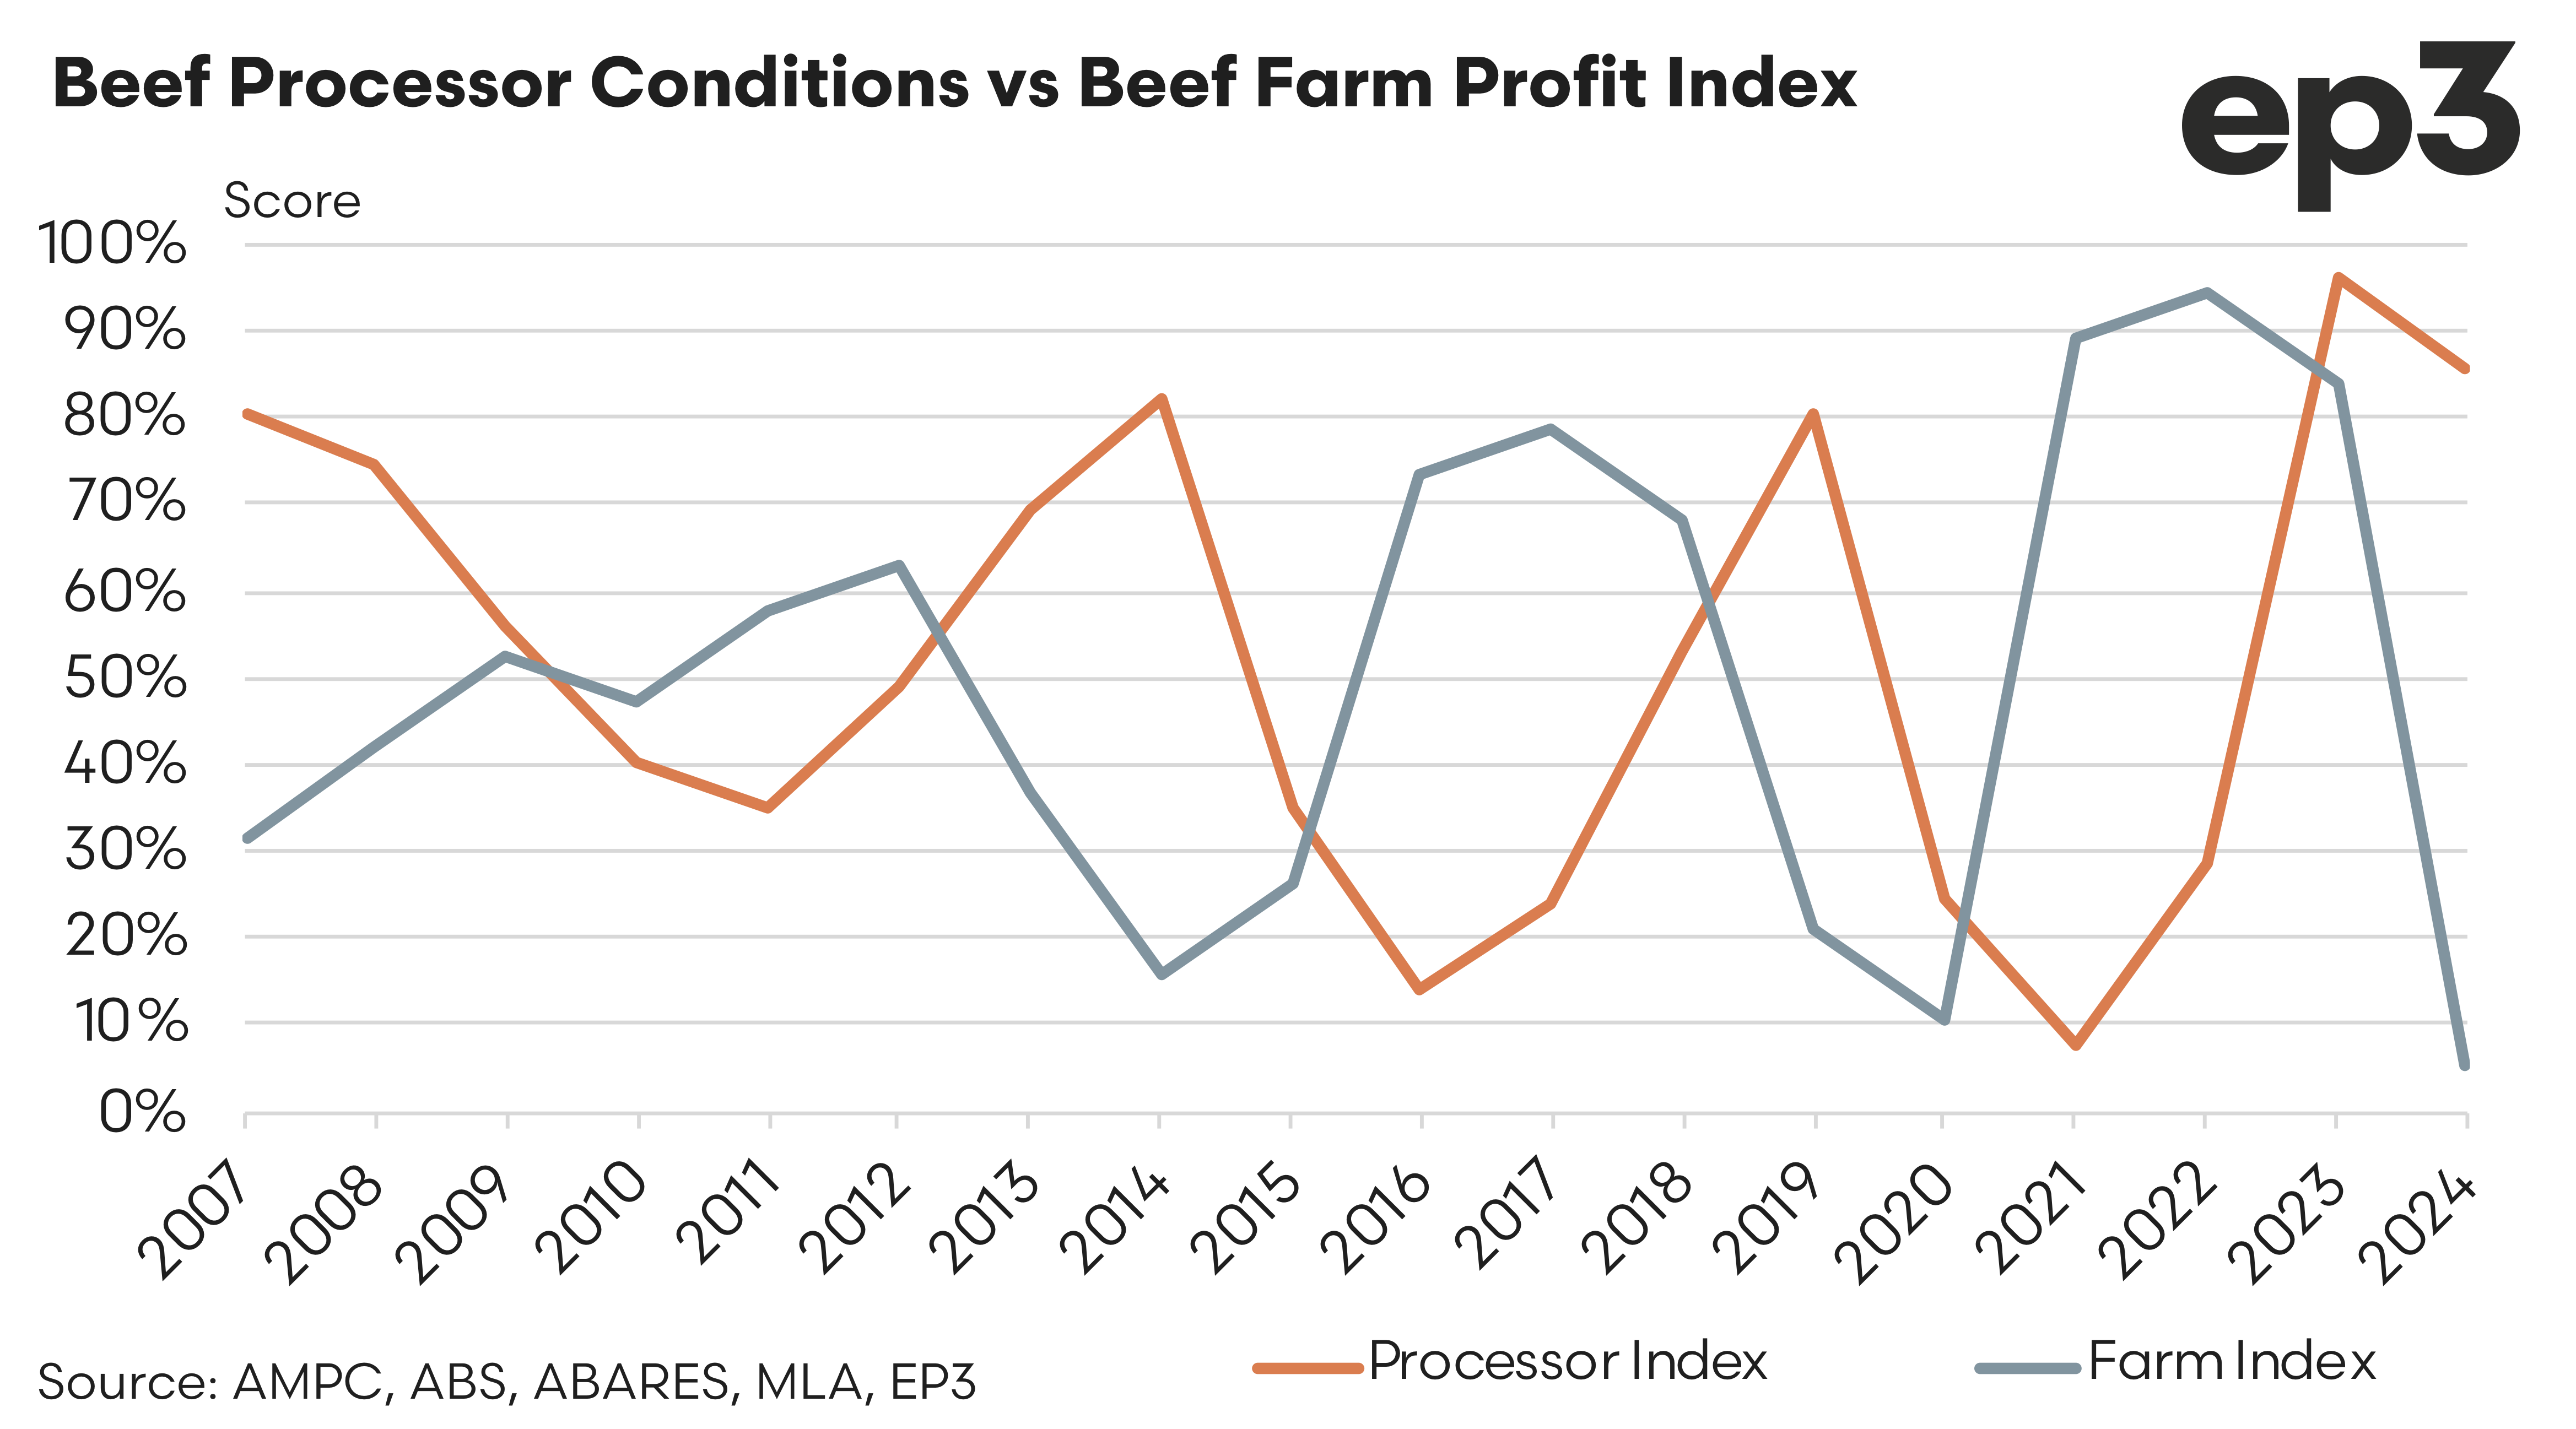
Analysis of the annual BPTC index versus the ABARES beef farm profit (expressed as a percentile rank) shows that often when beef processor conditions are favourable and peaking in their cycle it corresponds closely to the low points in beef farm profitability. Similarly, when beef farms are running most profitably the beef processing sector is experiencing tougher trading conditions, as shown on the chart below.
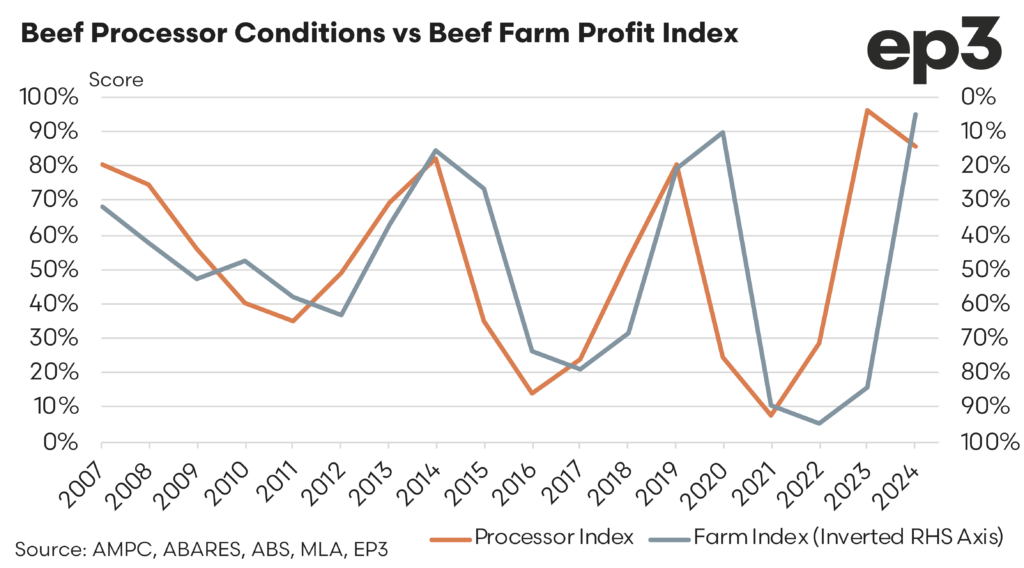
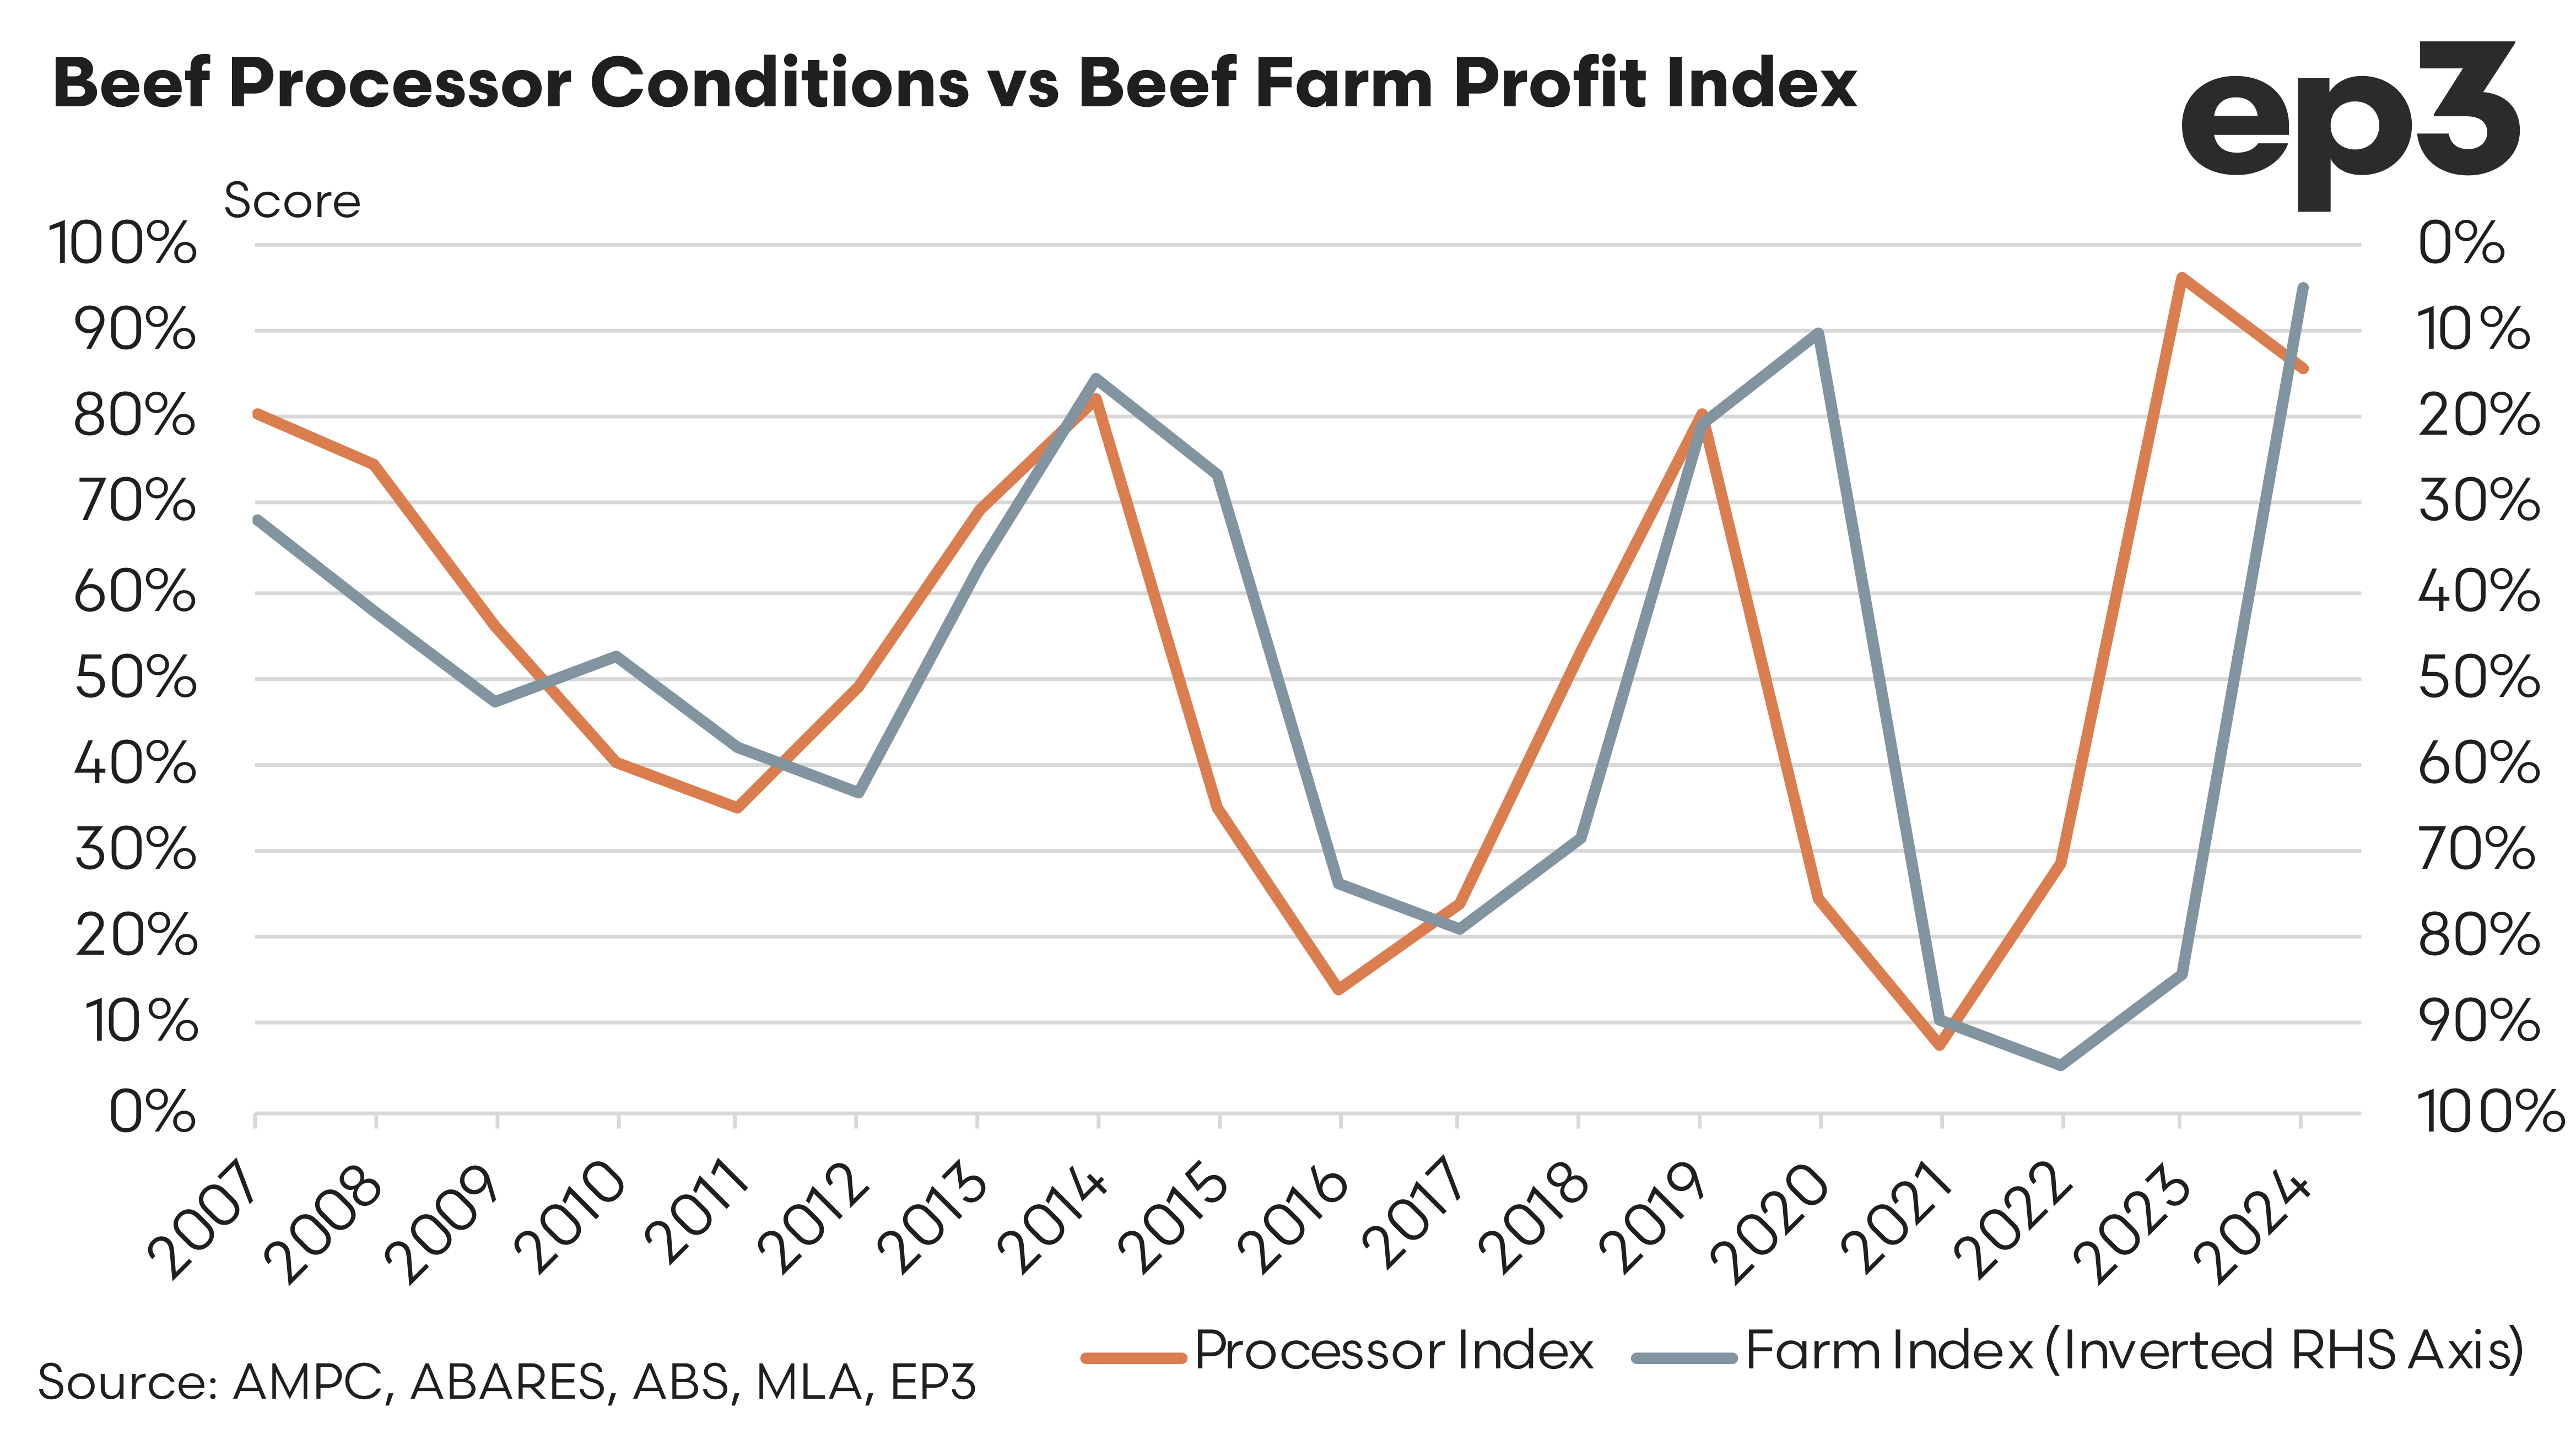
An easier way to view these two cycles is to adjust the beef farm profit to an inverse (show it upside down) as per the revised chart below. Here we can see much more clearly how close the two cycles are in line with each other, with the processing sector index looking like it usually leads the directional trend and the beef farm profitability follows soon after.

