
Peaks and troughs

The Snapshot
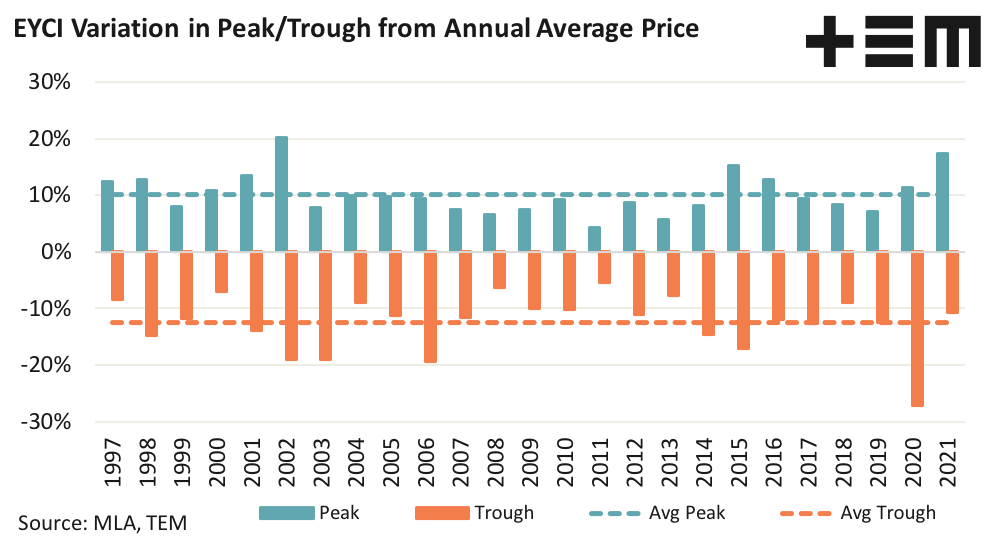
- Since 1997 the EYCI has seen annual price peaks between 4% to 20% above the annual average price, with a long term average annual gain of 10% noted across the entire 1997 to 2021 period.
- EYCI price troughs have been recorded between a 5% to a 27% decline since 1997. The long term average annual price decline across the entire 1997 to 2021 period comes in at 12% below the annual average price.
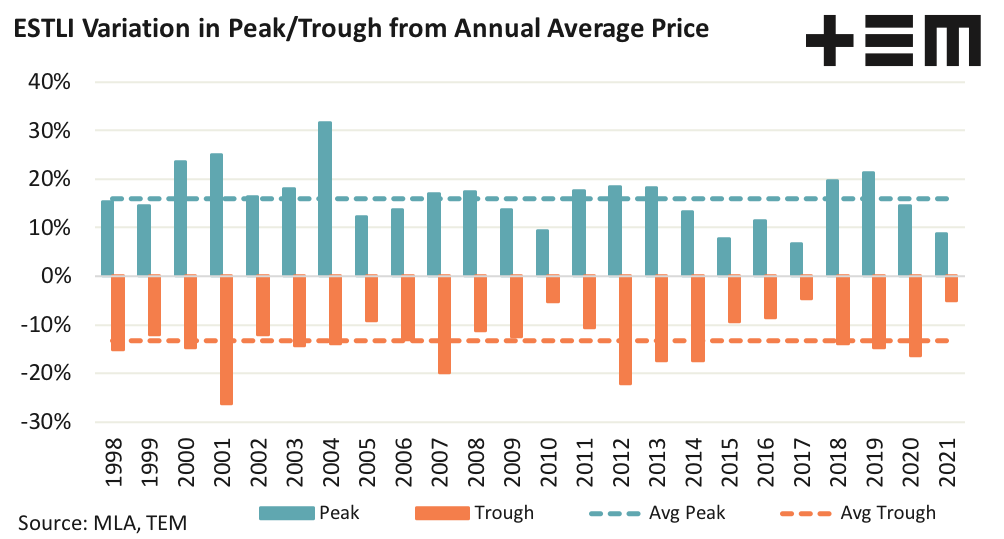
- Since 1998 the ESTLI has seen seasonal price peaks ranging between 6% and 32% above the annual average price and a long term annual average gain of 16% above the average annual price.
- Between 1998 to 2021 ESTLI seasonal troughs have come in between a decline of 5% to a decline of 26%, with a long term annual average decline of 13% noted across the entire 1998 to 2021 period.
The Detail
A Episode3 subscriber asked us to look into this one, as they were curious as to the variation in prices seen for young cattle and trade lamb over the calendar year. The question was, “In any given year how far above the annual average price is the seasonal peak and how far below the annual average price is the seasonal trough for the Eastern Young Cattle Indicator (EYCI) and the Eastern States Trade Lamb Indicator (ESTLI)?”
Since 1997 the EYCI has seen annual price peaks between 4% to 20% above the annual average price, with a long term average annual gain of 10% noted across the entire 1997 to 2021 period. Meanwhile, price troughs have been recorded between a 5% to a 27% decline over the same time frame. The long term average annual price decline across the entire 1997 to 2021 period comes in at 12% below the annual average price.
Since 1998 the ESTLI has seen seasonal price peaks ranging between 6% and 32% above the annual average price and a long term annual average gain of 16% above the average annual price. Between 1998 to 2021 ESTLI seasonal troughs have come in between a decline of 5% to a decline of 26%, with a long term annual average decline of 13% noted across the entire 1998 to 2021 period.
As of mid July 2022 the annual average EYCI sits at 1097 c/kg cwt and the annual average ESTLI sits at 800 c/kg cwt.
In recent weeks the EYCI has come under unseasonal price pressure pushing below 1000 cents this week. Using the long term average price trough of 12% under the average would suggest a potential bottom in the EYCI around 965 c/kg cwt, based on current annual average EYCI levels. Although, as an analyst I’d be hesitant to use this method to attempt to predict a potential market bottom this season.
The ESTLI is yet to demonstrate the normal seasonal winter price rally but this week prices began to creep higher. Based on the 16% long term average price peaks usually seen and the current average of 800 cents for the ESTLI this suggests a potential peak of 928 c/kg this season. However, as the normal winter gains have been quite delayed this season I’d expect getting to this level will be a bit of a task this season.
The seasonal price declines that usually occur in the spring flush is another matter though. Based on the current average of 800 and the long term average declines of 13% usually seen for the ESTLI puts a potential spring flush trough at 696 c/kg cwt.